9 Simple Steps to Create Powerful Excel Templates

If you've ever felt that sinking feeling of staring at a blank spreadsheet, you know it's a huge time-waster. For anyone who works with data, building the same report from scratch over and over again is a familiar grind.
The fix? An Excel template. It's a pre-built, reusable file where you’ve already done the heavy lifting—designing the layout, formatting the tables, and plugging in the formulas. You just open it, add your new data, and you're good to go.
3 Key Reasons to Use Excel Templates Instead of Starting from Scratch
Starting a weekly sales forecast or a monthly budget from a blank grid isn't just frustrating—it's a massive productivity killer. I’ve seen finance and project management teams lose hours every week just recreating the same reports, a process that’s practically begging for inconsistencies and errors. You might think building it fresh guarantees accuracy, but it often does the exact opposite.
Spending too much time on Excel?
Elyx AI generates your formulas and automates your tasks in seconds.
Sign up →This is the exact problem Excel templates solve. Instead of that empty grid, a template gives you a standardized, intelligent starting point. This isn’t just about working faster; it’s about creating a more reliable, professional, and error-proof workflow.
1. Ensure Data Consistency Across Teams
When everyone on a team builds their own version of the same report, you get chaos. One person might calculate a metric one way, while another uses a different date format. Trying to consolidate that data is a nightmare.
A well-built template acts as the single source of truth. Everyone starts with the same layout, the same formulas, and the same definitions. For example, a standard sales forecast template means every regional manager reports their pipeline using the exact same stages and probability calculations. Suddenly, company-wide roll-ups become a simple copy-and-paste job.
2. Reduce Human Error Significantly
Let's be honest: manual data entry is where mistakes happen. A misplaced decimal, a typo in a formula, or a copy-paste error that doesn't update can unravel an entire analysis. Templates put a stop to this by pre-building and protecting the most important parts of your spreadsheet.
You can lock cells with critical formulas and use data validation to control what gets entered. Think of a project budget template with a dropdown list for expense categories—it’s impossible for someone to misspell "Marketing" and throw off your entire summary.
By setting up your template to guide users and pre-validate their entries, you’re not just saving time. You're building a safety net that catches mistakes before they can cause any damage. This turns your spreadsheet from a potential risk into a truly reliable tool.
3. Speed Up Reporting and Analysis
The most immediate benefit is pure speed. How much time would you get back if your monthly financial report was 80% done the second you opened the file? That's what a good template does. It gives you a framework that's ready for your data.
- Financial Reporting: A financial analyst opens a month-end close template, drops in the latest trial balance, and the income statement and balance sheet update instantly. No rebuilding required.
- Project Management: A project manager can use a timeline template to map out a new project's phases in minutes instead of spending an hour drawing a Gantt chart from scratch.
- Small Business Operations: For small business owners, templates for invoicing, inventory, or payroll are lifesavers. You can find some great examples in our guide on Excel templates for small business.
When you cut out the tedious setup work, your team can jump straight to what matters: analyzing the data and making decisions. The time you save isn't just a few minutes here and there—it adds up to hours of high-value strategic work every single month.
Your 7-Step Foundation for Building a Basic Excel Template
If you've ever found yourself recreating the same spreadsheet over and over—for monthly reports, project budgets, or weekly timesheets—you know how much time it eats up. Building a solid Excel template is your ticket out of that repetitive cycle. Think of it not as a technical chore, but as a one-time investment that pays you back with saved hours, every single time.
It's all about creating a clean, intuitive, and reusable foundation. The idea is to build a master file that prevents mistakes, keeps data consistent, and lets anyone on your team get straight to work. Let's walk through the core steps using a simple monthly budget tracker as our example.
To get started, here’s a high-level look at the entire process. These are the seven essential building blocks for any great Excel template.
7 Essential Steps to Your First Excel Template
| Step | Primary Goal | Key Tip |
|---|---|---|
| 1. Define Purpose | Clearly state what problem the template will solve. | Be specific. "Track monthly expenses" is better than "Finance sheet." |
| 2. Plan Structure | Sketch out where inputs, calculations, and outputs will go. | Separate user inputs from your formulas to prevent accidental edits. |
| 3. Build Layout | Create clear headers and sections in a blank workbook. | Use color-coding (e.g., light yellow) for cells requiring user input. |
| 4. Format as Tables | Convert your data ranges into official Excel Tables. | This makes your template dynamic—formulas and formatting expand automatically. |
| 5. Add Formulas | Insert calculations to automate the work. | Reference entire table columns (e.g., SUM(Table1[Amount])) for dynamic formulas. |
| 6. Protect Your Work | Lock down cells that shouldn't be changed. | Unlock only the input cells, guiding the user and protecting your formulas. |
| 7. Save as .xltx | Save the file as an Excel Template to ensure reusability. | This is the key step that creates a new copy each time the file is opened. |
With that roadmap in mind, let's dive into the first few foundational steps.
Step 1: Define Your Template's Purpose and Plan Its Structure
Before you even open Excel, stop and ask the most important question: What problem is this template going to solve? A fuzzy goal leads to a messy spreadsheet. For our example, the objective is crystal clear: create a monthly budget tracker to compare income against expenses.
With that purpose nailed down, you can sketch out a basic structure on paper or in a simple text doc. Think in terms of three distinct zones:
- Input Section: This is where the user does all their work. They’ll enter their monthly income and list out each expense.
- Calculation Area: This is the engine room. It’s where your formulas live, doing all the heavy lifting behind the scenes. Often, you’ll keep this on a separate, hidden sheet.
- Output/Summary Section: This is the dashboard. It’s where the key takeaways—like total savings, spending by category, and budget variances—are displayed.
A few minutes of planning here will save you hours of cleanup later. A logical layout is the backbone of a good template. If you want to dig deeper into organizing data effectively, our guide on how to organize data in Excel is a great resource.
Step 2: Set Up a Clean and Clear Layout
Now it's time to open a new Excel workbook. Using your plan as a guide, start laying out the different sections. Create big, bold headers like "Monthly Income," "Expense Log," and "Budget Summary."
A simple but incredibly effective trick is to use color to visually separate the input cells from everything else. I like to use a light yellow background for any cell where a user needs to type something. This simple visual cue instantly makes the template more intuitive and user-friendly.
Step 3: Format Your Data Entry Areas as Tables
This next tip is a game-changer, yet so many people skip it. Instead of just adding borders and colors to your data area, turn it into an official Excel Table. Just select your expense log range, go to the Home tab, and click Format as Table.
Why is this one small action so powerful?
- It’s Dynamic: When you add a new expense to the row just below the table, the table automatically expands. Any formulas you have that reference the table will instantly include this new data—no manual updates needed.
- It’s Readable: Alternating row colors (banded rows) make long lists of data much easier to scan.
- It’s Smart: Tables come with filter and sort buttons in the headers by default, giving you powerful data analysis tools right out of the box.
Using Tables is a non-negotiable for building a robust template. You can see this principle and other foundational steps in action in more complex examples, like a professional cash flow statement template in Excel.
A template's real value comes from its reusability. By thinking ahead about structure and using features like tables, you build a tool that works for you, not against you. This is the difference between a static report and a dynamic asset.
This workflow is all about shifting from tedious, repetitive tasks to a smarter, more efficient process.
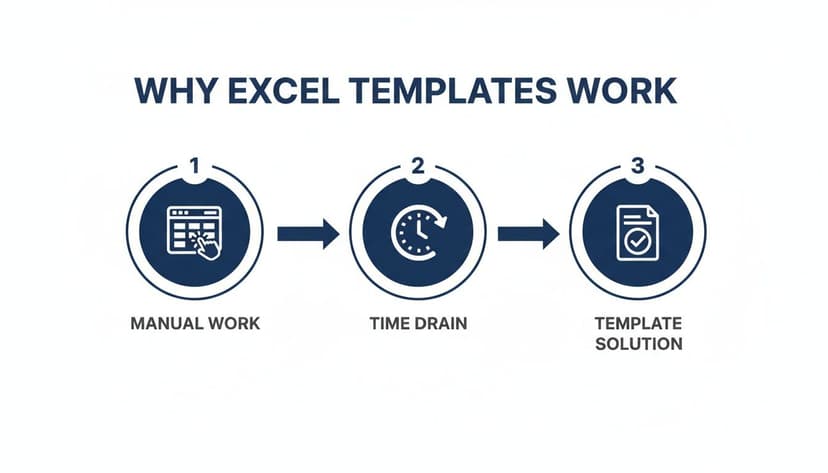
As the visual shows, templates are the bridge from manual spreadsheet headaches to a streamlined, automated workflow.
Step 4: Finalize and Save as an Excel Template File
This last step is absolutely critical, as it’s what makes your file truly reusable. Instead of just hitting "Save," you need to save it as a special file type: an Excel Template (.xltx).
Here’s exactly what to do:
- Go to
File>Save As. - Choose where you want to store your template.
- In the
Save as typedropdown menu, find and select Excel Template (*.xltx). - Give it a clear, descriptive name like "Monthly Budget Tracker" and click Save.
So what’s the big deal? When you save as an .xltx file, you protect your original work. The next time someone double-clicks that file to open it, Excel won't open the original. Instead, it will automatically create a brand-new, untitled copy of your template. This forces the user to save their version as a regular .xlsx file, leaving your master template clean, pristine, and ready for its next use.
9 Advanced Features to Make Your Templates Dynamic and Error-Proof
With a solid layout in place, it’s time for the fun part: adding the features that turn a simple file into a smart, interactive tool. This is where you elevate a basic spreadsheet into a professional-grade asset that saves time, prevents headaches, and guides users toward accuracy.
We'll use a sales dashboard template as our running example to see how these features come together. This isn't just about looks; it's about building a system that works for you. You can get ahead by learning from others' template creation strategies on macabacus.com.
1. Create Named Ranges for Cleaner Formulas
Tired of deciphering formulas like =SUM(C2:C50)? There’s a better way. By giving a cell range a simple, descriptive name like Sales_Amount, you make your formulas instantly understandable.
To set one up, just highlight your data range, type the new name into the Name Box (just left of the formula bar), and hit Enter. It’s that easy.
Now, your formula becomes =SUM(Sales_Amount). This is a lifesaver for anyone, including your future self, who needs to understand how the template works.
2. Implement Data Validation to Prevent Errors
Think of data validation as your template's built-in quality control. It lets you set rules for what kind of data can be entered into a cell, and one of its best uses is creating dropdown lists to standardize entries.
In our sales dashboard, you could create a dropdown for "Region" with choices like "North," "South," "East," and "West." This completely stops someone from typing "N." or "Northern," which would throw off all your summaries.
3. Use Conditional Formatting to Visually Highlight Key Metrics
Conditional formatting is what makes your data "talk." It automatically changes a cell's appearance based on its value, turning a wall of numbers into a clear, at-a-glance dashboard.
Here are a few ways I use it all the time:
- Spot outliers: Turn any sales figure over $10,000 green.
- Track progress: Use data bars to create mini in-cell bar charts.
- Flag problems: Change the font to red for projects past their due date.
For the sales dashboard, you could set up a rule to color-code reps based on their quota attainment, instantly showing who’s crushing it and who needs support.
4. Leverage Powerful Formulas like SUMIFS
While SUM is a workhorse, SUMIFS is the key to building truly dynamic summaries. It lets you add up values that meet several criteria at once, which is perfect for a flexible dashboard that answers specific questions on the fly.
Want to find total sales in the "North" region for "Q1"? Your SUMIFS formula would look like this:=SUMIFS(Sales_Amount, Sales_Region, "North", Sales_Quarter, "Q1")
Here's the breakdown:
Sales_Amount: The numbers you want to sum (our named range).Sales_Region: The range where the regions are listed."North": Your first condition—only sum rows where the region is "North."Sales_Quarter: The range containing the quarters."Q1": Your second condition—it filters further to only include "Q1" sales.
Formulas like
SUMIFSdo the heavy lifting for your users. They don't have to manually filter and calculate; the dashboard gives them instant answers, making them look like a genius.
5. Pull Data Automatically with XLOOKUP
VLOOKUP and its more powerful successor, XLOOKUP, are your go-to functions for finding and pulling data from a table. This is incredibly useful for keeping information consistent across your workbook.
For example, you could have a separate "Products" sheet with all your product IDs and their corresponding prices. In the main sales log, a user only needs to enter the product ID. An XLOOKUP formula can then automatically pull the correct price, guaranteeing accuracy and eliminating manual entry. Better yet, when prices change, you only have to update them in one place.
If you're new to formulas, you can get up to speed with our helpful guide on how to make a formula in Excel.
6. Protect Cells to Safeguard Your Hard Work
After you've perfected all the formulas and formatting, the last thing you want is for someone to accidentally delete a critical calculation. This is where worksheet protection comes in.
It’s a simple two-step process:
- Unlock input cells: First, you have to tell Excel which cells users are allowed to edit. Select those cells, right-click, choose
Format Cells, go to theProtectiontab, and uncheck theLockedbox. - Protect the sheet: Now, head to the
Reviewtab and clickProtect Sheet. You can add a password for extra security.
That's it. Users can now only type in the cells you designated, keeping the template's engine safe from accidental damage.
7. Incorporate Dynamic Date and Time Functions
Functions like TODAY() and NOW() make your template feel current. For instance, TODAY() always shows the current date whenever the file is opened. This is perfect for report headers or for calculating things like invoice aging.
8. Build Interactive Controls
Beyond simple dropdowns, you can add other form controls to make your template feel more like an app. Think of checkboxes for to-do lists or option buttons for selecting a report type. You can link these controls to formulas to drive different calculations or change what a chart displays.
9. Create a Separate "Settings" Sheet
Here’s a pro tip: for a truly robust template, create a dedicated sheet called "Settings" or "Config." This sheet becomes the central hub for all your variables. Store your dropdown list sources, key assumptions like tax rates or commission percentages, and any other inputs here. This makes your template incredibly easy to update and maintain, as all customizable elements are in one convenient place.
6 Ways AI Can Accelerate Your Excel Template Workflow
Alright, you've built a solid template with all the bells and whistles—formulas, data validation, the works. But let's be honest, the real bottleneck isn't always building the template, it's using it. What if you could take the manual work out of not just the template's function, but its creation and day-to-day use?
This is where AI tools like ElyxAI step in and completely change how you work with Excel. We're moving beyond simple formula suggestions. Think of it as having a conversation with your spreadsheet, telling it what to do in plain English, and watching it happen.
1. Create a Complete Template from a Single Prompt
First up, the most direct way to get started: just ask for what you need. Instead of spending an hour building a financial report from scratch—setting up the tabs, formatting headers, and writing formulas—you can give a single, clear command.
For example, you could tell an AI agent like ElyxAI:
"Create a monthly financial report template with sections for P&L, balance sheet, and cash flow, including charts for revenue trends and a summary dashboard."
The AI gets to work, structuring the entire workbook for you. It adds the right sheets, lays out placeholder tables, and even drops in starter formulas and clean, professional formatting. This one trick can turn hours of tedious setup into a couple of minutes.
2. Automate Your Data Cleanup and Entry
A great template is useless without clean data. And if you've ever tried to paste raw data from another system into a structured template, you know the pain. It almost never fits. This is where AI becomes your go-to data assistant.
Imagine you have a messy export from your CRM. The AI can handle the entire prep phase:
- Finding and zapping duplicate entries.
- Standardizing formats, like fixing inconsistent dates or capitalization.
- Splitting or merging columns so the data slots perfectly into your template.
You can simply instruct the AI, "Clean this raw sales data and populate the 'Sales Dashboard' template." It does the heavy lifting, and you get to skip the most frustrating part of the process.
3. Get Instant Analysis and Charts
Once your data is in, the next step is figuring out what it all means. Instead of wrestling with PivotTables or the chart builder, you can just ask questions. The beauty here is that the AI can interpret your goal and pick the best way to show the answer.
You could ask, "Analyze the sales data in this template and show me the top 5 products by region using a bar chart." The AI doesn't just make a chart; it does the background analysis needed to create it, saving you several steps.
4. Generate Smart Summaries and Spot Trends
Visuals are great, but sometimes you need a quick written summary. Think of this as having a junior analyst built right into your spreadsheet.
After your financial model template is filled out, you could ask the AI:
"Review the P&L sheet and summarize the key trends in revenue and expenses for the last quarter."
The AI will scan the numbers and give you a concise, easy-to-read summary. It will point out significant changes, growth rates, and maybe even flag things you should look into. This closes the gap between looking at raw numbers and understanding what they actually mean for the business. For more complex workflows, you can even integrate these templates with systems designed for automated data processing.
5. Write Macros and Scripts on the Fly
For those unique, repetitive tasks that aren't covered by a standard feature, AI can write VBA scripts or macros for you. This is a game-changer for anyone who doesn't code.
Need a button that sorts data and emails a report? Just describe it. The AI generates the script, turning a complex automation task into a simple request. You can learn more about how this works in our guide to the Excel AI macro generator. It makes your templates endlessly more capable without you needing to become a programmer.
6. Generate Complex Formulas from Plain English
Struggling to write that complex XLOOKUP or nested IF statement? With an AI assistant, you can simply describe what you want the formula to do, and it will generate it for you.
For instance, you could ask:
"Write me an Excel formula that checks if the value in cell A2 is over 5000; if it is, return 'High Value', otherwise return 'Standard'."
The AI will instantly provide the correct formula: =IF(A2>5000, "High Value", "Standard"). It will even explain how the formula works so you learn as you go. This lowers the technical barrier, allowing anyone to build sophisticated, automated logic into their templates.
3 Common Template Mistakes and How to Avoid Them

Building a great Excel template is more than just getting the layout and formulas right. A template's real value is tested over time, and I've seen even the most brilliant spreadsheets turn into a complete mess because of a few common, and totally avoidable, mistakes.
If you can spot these pitfalls ahead of time, you can create templates that are not just powerful but also practical and error-proof for anyone who uses them. Let’s walk through the biggest blunders I’ve encountered and, more importantly, how you can sidestep them.
1. Hard-Coding Values That Should Be Dynamic
I see this one all the time. Someone types a value, like a tax rate or commission percentage, directly into a formula. Imagine hard-coding 0.08 for a sales tax into twenty different cells. What happens when that rate changes? You’re stuck hunting down every single formula to update it by hand. It’s a recipe for disaster.
The fix is simple: create a dedicated "Settings" or "Inputs" sheet. Place all your key variables there—tax rates, discount tiers, project codes, you name it—and give them clear labels.
Now, instead of typing the number into your formula, you reference the cell on your Inputs sheet. When a value needs to change, you update it in one spot, and the entire workbook updates instantly. This makes your template much easier to maintain and scale. If you want to dive deeper into organizing your sheets, our article on formatting a worksheet in Excel has some great tips.
2. Overly Complex Formulas
We've all seen them—formulas so long and nested they look like they belong in a physics textbook. While they might seem impressive, they are an absolute nightmare to debug. When an error inevitably pops up in a monster formula with ten nested IF statements, good luck finding the source of the problem quickly.
A good template prioritizes clarity over complexity. The goal is for another person—or your future self—to understand how it works without needing a decoder ring.
Instead of building one massive, all-in-one formula, break the logic down. Use helper columns to handle intermediate calculations. Each column can perform one small part of the overall task. Sure, it adds a few columns to your sheet (which you can always hide from the final view), but it makes your logic transparent and troubleshooting a breeze. Alternatively, use an AI tool to generate and explain the formula for you, ensuring that even complex logic is well-documented.
3. Forgetting to Protect Your Template's Structure
You just spent hours perfecting the layout, formulas, and formatting. The last thing you want is for someone to accidentally delete a critical formula or type over a header. An unprotected template is an accident waiting to happen.
Thankfully, the solution is a quick, two-part process:
- First, decide which cells users should be able to edit. Select those cells, right-click, choose
Format Cells>Protection, and uncheck the Locked box. - Then, head to the
Reviewtab and click Protect Sheet.
That's it. Now, users can only change the cells you've specifically designated for input, keeping the bones of your template safe and sound. This is a non-negotiable step for any template you plan to share. It guides your users and prevents a world of headaches.
4 Common Questions (and Expert Answers) About Excel Templates
Once you get the hang of building templates, you start running into the same few questions. I've heard them all over the years. Getting these details right is what separates a decent template from one your team actually loves to use. Let's tackle some of the most common ones.
1. What’s the Big Deal with .xltx vs. .xlsx Files?
This is probably the most frequent question, and the answer is crucial. Think of it this way: opening a regular .xlsx workbook is like editing the master copy of a document. Every change you save overwrites the original. For a template, that's a recipe for disaster.
An .xltx template file, on the other hand, is built with a safety feature. When you open one, Excel doesn't open the original file. Instead, it instantly creates a fresh, untitled copy (like "Book1"). This forces you to save your work as a new .xlsx file, leaving the master template untouched and pristine for the next person. It’s a simple distinction, but it's the core of what makes templates reusable.
2. How Do I Share These Templates with My Team?
A template is only useful if people can find it. You’ve got a couple of solid options for getting your templates into your team's hands.
- The Shared Folder Method: This is the quick and easy approach. Just save your
.xltxfile in a shared space everyone on your team can access—think SharePoint, a shared network drive, or a dedicated OneDrive folder. They just navigate there, open the template, and get to work. - The "Official" Company Method: For a more seamless experience, you can have your IT admin deploy templates to a "Workgroup Templates" library. This makes your custom templates show up right inside Excel under
File > New, usually in a tab with your company's name. It’s the gold standard for making sure everyone is using the correct version.
3. Can I Put Macros in My Templates?
You absolutely can, and this is where you can add some serious automation. If you have a macro for a repetitive task—like a button that reformats a data dump or generates a PDF summary—you can build it right into the template.
The only trick is how you save it. Instead of the usual .xltx, you need to save the file as a Macro-Enabled Excel Template (.xltm). When a user opens an .xltm file, the new workbook inherits all the macros, ready to go.
This is my favorite trick for automating those tedious, multi-step processes. Imagine embedding a small assistant in your template that can clean up a report or archive data with a single click. AI tools can even write these macros for you based on a simple description.
4. How Can I Make a Template That Pulls in Live Data?
For any template that needs up-to-the-minute information, like a daily sales report or a project dashboard, you’ll want to use Power Query. You'll find it on the "Data" tab in a section called "Get & Transform Data."
Inside your template, you can use Power Query to set up a connection to an external data source—another workbook, a company database, or even a table on a website. Once it's set up, all a user has to do is open a new file from the template and click Data > Refresh All. Excel handles the rest, pulling in the latest data without any messy copy-pasting. It’s the best way to ensure your reports are always based on current information.
Ready to stop building templates and start getting answers? With Elyx AI, you can describe the report you need in plain English, and our autonomous agent builds it for you—from data cleaning and analysis to chart generation. Stop wasting hours on repetitive tasks and let AI do the work. Try ElyxAI for free and supercharge your Excel workflow today.
Reading Excel tutorials to save time?
What if an AI did the work for you?
Describe what you need, Elyx executes it in Excel.
Sign up