How to Add a Chart Title in Excel: 5 Methods

You've probably seen this happen. The chart looks polished, the colors are fine, the numbers are right, and then someone asks, “What exactly am I looking at?”
That's almost always a title problem.
If you're trying to learn how to add a chart title in excel, the basic step takes seconds. The more useful skill is knowing which method to use, when a static title is enough, and when you should link the title to a cell so it updates automatically with your dashboard or report.
Spending too much time on Excel?
Elyx AI generates your formulas and automates your tasks in seconds.
Sign up →Why Your Excel Chart Desperately Needs a Title
A chart without a title forces the reader to guess the context. Is it monthly revenue, regional headcount, conversion rate, or forecast variance? Even if the data is technically correct, the message gets weaker when the chart doesn't identify itself clearly.
This matters more than commonly recognized. According to Microsoft UX studies, adding clear titles to charts and their axes can improve a viewer's comprehension and ability to draw correct conclusions by as much as 62% in Ablebits' summary of Excel chart title guidance.
That tracks with what happens in real workbooks. A chart title isn't decoration. It gives the reader immediate context, makes exports and screenshots usable, and stops the back-and-forth that starts when a chart gets copied into PowerPoint or Teams with no surrounding explanation. If you're building reports regularly, good titles are part of good Excel data visualization practice.
What a title actually tells the reader
A strong title usually answers at least one of these questions:
- What is being measured. Example: Sales, profit margin, support tickets.
- What time period applies. Example: Q1 2025, last 12 months, month to date.
- What segment is shown. Example: North America, enterprise accounts, product line B.
- What the chart is meant to emphasize. Example: trend, comparison, variance, ranking.
A chart title should remove ambiguity before the reader studies the bars, lines, or labels.
The five methods that matter
When people search for how to add a chart title in excel, they usually need one of these:
- A fast title using the green plus icon.
- A Ribbon-based method from the Chart Design tab.
- A right-click route when menus feel hidden.
- A dynamic title linked to a cell.
- Better formatting so the title looks intentional, not default.
The first three solve the immediate problem. The fourth is the one that changes how you build dashboards.
3 Quick Ways to Add a Basic Chart Title
If you just need a title on the chart right now, use one of these. They all work, and the best one is usually the one you can find fastest in your version of Excel.

Use the chart elements button
This is the quickest method in many desktop versions of Excel.
- Click the chart once.
- Look to the right of the chart for the green plus icon.
- Check Chart Title.
- Click the placeholder title box and type your text.
If Excel inserts the title as Chart Title, just click into it and replace it with something useful like “Monthly Sales by Region”.
This method is ideal when you're cleaning up a chart before sending a file or exporting an image.
Use the Chart Design tab
This is the method I use when I want to be precise, especially in workbooks with several charts.
- Select the chart.
- Go to Chart Design.
- Click Add Chart Element.
- Choose Chart Title.
- Pick Above Chart or Centered Overlay.
Above Chart is usually the safer choice because it gives the title its own space. Overlay can work in a compact dashboard, but it can also compete with the data.
Practical rule: If the chart might be printed, pasted into slides, or viewed by someone else, use Above Chart unless space is extremely tight.
A quick visual walkthrough can help if the menu names vary slightly in your version of Excel:
Use the right-click menu
This one is less obvious, but it's handy when you're already editing the chart area.
Right-click the chart, then look for the chart formatting or element options available in your Excel version. In some builds, Excel exposes title controls through the context menu or through the formatting pane that opens from that menu.
Here's when I'd choose each method:
| Method | Best when | Trade-off |
|---|---|---|
| Green plus icon | You need speed | Easy to miss if the chart isn't selected |
| Chart Design tab | You want a reliable menu path | Slightly slower |
| Right-click menu | You're already editing chart settings | Options vary more by version |
One gotcha that trips people up
If you don't see any chart title option, make sure the chart itself is selected first. The Chart Tools tabs only appear after selection, and that's one of the most common reasons people think the feature is missing.
The Pro Method: Creating 1 Dynamic Title Linked to a Cell
Static titles are fine for one-off charts. They're a pain in recurring reports.
If your chart changes every week, every month, or based on a filter, the title should update too. That's where a dynamic chart title earns its keep. Instead of typing text directly into the chart, you link the title to a worksheet cell. When that cell changes, the title changes automatically.
Microsoft benchmarks show that linking a chart title to a cell dynamically has a 98% success rate and can cut update time by 75% in pivot-linked charts compared to manual edits, according to Microsoft's instructions for linking a chart title, label, or text box to a worksheet cell.
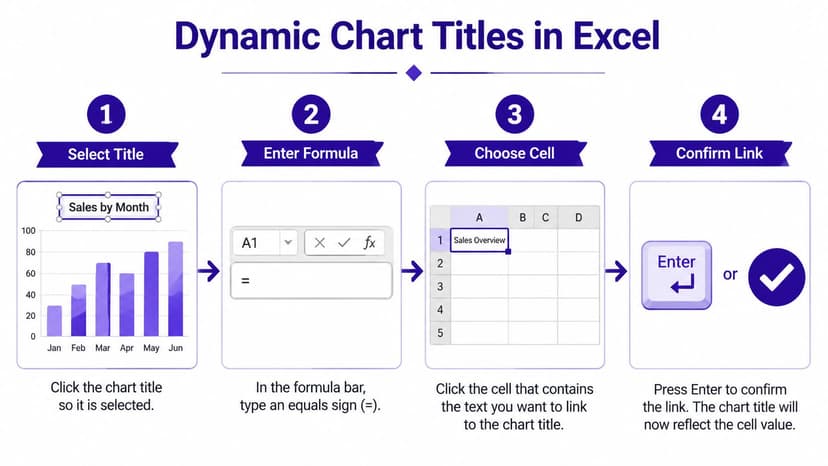
The exact steps that work
Use this sequence:
- Add a normal chart title first if the chart doesn't already have one.
- Click the border of the title box, not the text inside it.
- Click in the formula bar.
- Type
= - Click the cell you want to link to.
- Press Enter.
If your source cell is on another sheet, use a fully qualified reference such as:
=Sheet1!A1
If the sheet name contains spaces, Excel will show it like this:
='Sales Dashboard'!H27
That last detail matters. If the workbook uses multiple sheets, proper linking matters just as much as the title text itself. If you want a refresher on reference behavior, this guide on how to link cells in Excel is useful.
Build the title in a helper cell first
The cleanest approach is to create the final title text in a worksheet cell, then link the chart title to that one cell.
Example formula:
="Sales for " & B1 & " - " & TEXT(TODAY(),"mmm yyyy")
Here's what each part does:
="Sales for "adds fixed text.& B1appends the content of cell B1, such as a region name like West.& " - "adds a separator.TEXT(TODAY(),"mmm yyyy")converts today's date into a readable month-year format like Apr 2026.
If cell B1 contains West, the title becomes:
Sales for West – Apr 2026
That's much better than typing a title manually every month.
Why this works better in dashboards
Dynamic titles solve two practical problems:
- They reduce manual edits when date ranges, regions, or categories change.
- They keep the title aligned with the actual chart logic, especially when slicers, formulas, or pivot outputs drive the chart.
Click the title border first. If you click inside the text, Excel treats it like plain text editing and the link won't be created.
What works and what doesn't
A few habits make dynamic titles far more reliable:
- Use a dedicated helper cell rather than trying to force long logic directly into the title.
- Reference the sheet name explicitly in multi-sheet workbooks.
- Keep the title readable even if the formula can produce long text.
- Test the result by changing the source cell and confirming the title updates.
What usually fails is sloppy selection. People click into the title text, type =A1, and expect a live link. Excel won't interpret that the way you want unless the title box itself is selected correctly.
4 Tips for Formatting Titles for Maximum Impact
A title can be accurate and still look weak. Default formatting often leaves charts looking unfinished, especially in dashboards, management packs, and presentation exports.

Open the formatting pane by right-clicking the title and choosing Format Chart Title, or select the title and press Ctrl+1. That pane is where Excel hides the useful controls.
If you want a more consistent visual system across multiple charts, these chart templates for Excel can help you standardize layout and formatting choices.
Use a clear font hierarchy
The simplest upgrade is often enough:
- Use Calibri 14 pt bold for a straightforward business chart.
- Keep it larger than axis labels so the title reads as the main label.
- Avoid decorative fonts that weaken readability.
If everything on the chart has the same visual weight, the title won't guide the reader.
Match color carefully
Color can help, but only if it supports the chart.
You can format the title to match a primary series color, your company palette, or the dashboard theme. In most cases, a dark neutral title is still the safest option. Bright title colors look clever in isolation and messy in a report with many charts.
Design shortcut: If the data is already colorful, keep the title restrained.
Choose placement based on the chart's job
A title above the chart feels more formal and usually reads better in reports. Overlay titles can work in compact dashboards, but they need enough whitespace.
Use this quick guide:
| Placement | Best for | Risk |
|---|---|---|
| Above Chart | Reports, printouts, exports | Takes more vertical space |
| Centered Overlay | Tight dashboards | Can interfere with data |
Keep the wording shorter than you think
Long titles are where otherwise good charts start to look amateur.
Instead of writing a full sentence, tighten it to the key message. Compare these:
- Weaker: Monthly performance of regional sales teams across the current financial year
- Stronger: Regional Sales Performance, Current FY
Shorter titles scan faster and survive resizing better.
Troubleshooting 4 Common Chart Title Frustrations
Most guides stop too early. Adding a chart title is easy. Fixing one that won't behave is the actual job.
Data from Microsoft community forums in 2024-2025 shows that 40% of user queries about chart titles not updating stem from incorrect linking methods in multi-sheet workbooks or on older Excel versions, a pitfall highlighted in this Microsoft Community discussion summary on chart title issues.
If you're already using AI assistance inside spreadsheets, this broader guide on Excel AI help is also worth a look for repetitive troubleshooting tasks.
The title won't update after linking
This is the most common dynamic-title problem.
Usually, one of these is true:
- You clicked inside the title text instead of selecting the title box
- The source reference isn't qualified with the sheet name
- The workbook is using an older layout or a chart on a separate sheet
Try this fix sequence:
- Delete the broken title link.
- Re-add a standard chart title.
- Click the title border once.
- In the formula bar, enter the cell reference again.
- If the source is on another sheet, use the full sheet reference.
The title text gets cut off
This happens when the title is too long for the chart area or when the chart is resized after the title is added.
Use one of these fixes:
- Shorten the title text
- Widen the chart
- Reduce the font size slightly
- Switch from overlay to above-chart placement
Long titles aren't a formatting badge of honor. Usually they mean the title is doing the job of a subtitle.
The Chart Title option is missing or greyed out
This usually isn't a bug. It's often one of two things:
- The chart hasn't been selected, so Excel isn't showing chart-specific tools.
- The chart type doesn't support the exact option you expect in the same way.
Start by clicking the chart area directly. If the Chart Design tab appears, you're in the right place. If you're working with an unusual chart type, try changing the chart type temporarily to confirm whether the title controls appear as expected.
If Excel looks like it's hiding the feature, check selection first. More chart-title problems start there than anywhere else.
The title disappears after filtering or changing the chart
This is especially annoying with PivotCharts and report-style workbooks.
The usual causes are chart refresh behavior, field changes, or layout resets triggered by filtering. When that happens:
- Reconfirm that the title still exists as a chart element.
- Reapply the title if the chart layout was reset.
- Check whether the helper cell feeding the dynamic title still returns the expected text.
- Test the chart after the filter change rather than assuming the old link remained intact.
If a workbook is used repeatedly by several people, dynamic titles are worth checking as part of your normal QA before distribution.
The Future: 1-Prompt Title Creation with ElyxAI
Manual title work isn't hard. It's just repetitive.
You click the chart, add the title, decide on placement, build a helper cell, link the title, test the formula, adjust formatting, then repeat the same process across several charts. That's manageable once. It's tedious in a live reporting file.

That's why Excel users are moving toward AI-assisted workflows. Instead of working through every menu yourself, you can describe the result you want in plain language. If you want context on where this is heading, this overview of what is Excel AI gives the bigger picture.
A practical prompt looks like this:
Create a column chart from A1:B13, add a chart title above the chart, link it to cell F1, and format the title in bold.
That kind of request is easier to review than a long list of manual steps. It also reduces the small errors people introduce when they're rushing through monthly reporting.
The value isn't that AI makes chart titles magical. It's that it removes the friction around the mechanical parts of Excel work so you can focus on whether the chart says the right thing.
If you want Excel to execute tasks instead of just suggesting them, Elyx AI is worth trying. It works inside Excel as an autonomous add-in, so you can ask for complete workflows in plain language, including chart creation, formatting, dynamic titles, cleanup, and reporting steps that normally eat up your time.
Reading Excel tutorials to save time?
What if an AI did the work for you?
Describe what you need, Elyx executes it in Excel.
Sign up