6 Steps to Pro Project Tracking Spreadsheets in Excel

Projects rarely fall apart because the team forgot to care. They fall apart because the work lives in too many places. A due date sits in an email thread, the budget lives in a separate sheet, task ownership hides in meeting notes, and status updates get repeated differently by three people.
That's why project tracking spreadsheets still survive inside serious teams. Excel has been a de facto project management tool for decades because its grid can hold tasks, dates, owners, and status fields in one place, and teams often extend that into master sheets, budget tabs, risk logs, and dashboard summaries, as shown in Office Timeline's Excel project tracking guidance. The spreadsheet becomes the control layer, even when the project itself spans meetings, files, and handoffs.
The problem isn't the spreadsheet. The problem is building one that stays useful after week two.
Spending too much time on Excel?
Elyx AI generates your formulas and automates your tasks in seconds.
Sign up →Stop Juggling a Dozen Project Notes
If your current setup is part inbox, part notebook, part memory, you're already doing project tracking. You're just doing it in a way that breaks under pressure.
Missed deadlines usually don't start as dramatic failures. A task slips because nobody owns it clearly. A dependency gets missed because the timeline is stored separately from the task list. A stakeholder asks for a status update, and someone spends half an hour rebuilding the answer from scattered notes.
A proper Excel tracker fixes that by turning project activity into a single operating sheet. You get a visible list of tasks, who owns them, when they start, when they end, and what status they're in. That basic structure is why spreadsheets became the default option for many teams in the first place, especially when they need something flexible and fast.
For teams handling several initiatives at once, the pain gets worse. Personal notes don't roll up into portfolio reporting. Shared visibility disappears fast. If that sounds familiar, this guide on managing multiple projects in Excel is a useful companion.
A tracker should answer three questions without discussion: what's due, who owns it, and what's blocked.
A significant shift happens when the spreadsheet stops being a static list. Add controlled fields, formulas, and visual signals, and it starts behaving like a lightweight system instead of a manual log. That's the difference between a workbook people tolerate and one they consistently use in weekly reviews.
There are two ways to get there. You can build it yourself, field by field and formula by formula. Or you can delegate the repetitive build steps to an AI agent inside Excel that creates the structure, formulas, summaries, and formatting from a plain-language request.
Both approaches work. What matters is knowing which parts need your judgment, and which parts are just spreadsheet labor.
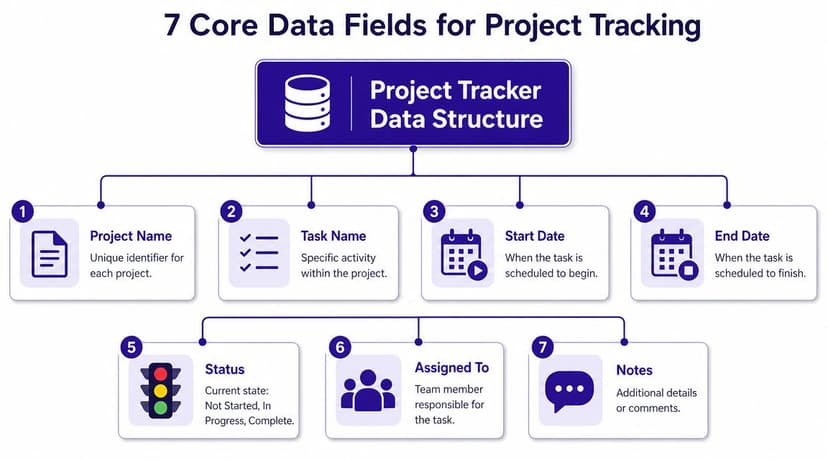
Design Your 7 Core Data Fields
A project tracker usually fails before the first formula goes in. The failure starts in the column design. If people can type anything, label fields however they want, or squeeze multiple facts into one cell, the sheet turns into cleanup work.
Set up the table properly once. Then the formulas, filters, charts, and summaries have something reliable to work with.
If you're fixing a workbook that already has inconsistent headers and scattered inputs, this guide on how to organize data in Excel helps before you build the tracker itself.
The structure that holds up in real use is simple. One row per task. One column per field. No merged cells, no stacked notes, no “see comment” as a substitute for data.
The seven fields that matter first
Start with these seven columns and resist the urge to add ten more on day one.
Task ID
Give each task a unique ID such asT-001,T-002, andT-003. This matters once you have repeated task names like “Review” or “Approval,” and it makes lookups, comments, and handoffs less messy.Task Name
Name the work clearly enough that someone outside the project can understand it. “Approve vendor quote” is usable. “Vendor” is not.Owner
Assign one accountable owner per row. Contributors can live elsewhere if you need them later, but accountability breaks fast when one task has three names in the same cell. Use Data Validation so “Sam Lee” does not become “Sam,” “S Lee,” and “Samuel” across the file.Start Date
This is the planned start date, not a rough guess buried in a note. You need it for sequencing, workload review, and the Gantt chart you'll build later.End Date
Pick one meaning and keep it consistent. Either this column is the due date or the planned finish date. Teams get into trouble when half the sheet uses one definition and half uses the other.Status
Keep the list controlled. A practical set is Not Started, In Progress, On Hold, Completed. I usually leave Overdue out of the manual dropdown and calculate it with logic later. That avoids the common mistake where a task is marked “Completed” and “Overdue” by different people at different times.Priority
Use a small scale. High, Medium, and Low is enough for most spreadsheet trackers. If everything is marked Critical, the column stops helping.
Design choices that save time later
A few setup decisions make the difference between a tracker people update and one they avoid.
Use an Excel Table, not a loose range. Tables carry formulas down automatically, keep filters attached, and make structured references easier to read.
Keep headers flat and literal. “Owner” works better than “Task Resource Assignment.” Short labels are easier to scan in weekly reviews.
Separate data from commentary. If a blocker needs explanation, add a dedicated Notes column later or keep a separate issue log. Do not turn the Status cell into a paragraph.
What breaks these trackers early
I see the same problems in spreadsheet rebuilds:
Free-text status values
Excel will treat “done,” “Done,” and “Completed” as different values.Dates stored as text
The sheet may look fine, but formulas, sorting, and timeline views will fail.Multiple values in one cell
“Alex / Priya / Finance” is not clean ownership data.Merged cells in the header area
They make filtering, sorting, and table conversion harder than it needs to be.
Practical rule: if you expect to sort it, filter it, count it, or chart it, give it its own column.
Build it yourself or delegate the setup
Now, the build vs. delegate decision starts to matter.
If you know your process well, creating these seven fields manually in Excel takes a few minutes. The repetitive part is adding dropdowns, formatting the table, standardizing date columns, and setting up the sheet so the next person cannot break it accidentally.
That repetitive setup is a good handoff point for ElyxAI. Give the agent a plain-language prompt, then review the structure before your team starts using it.
Create an Excel project tracker table with these columns: Task ID, Task Name, Owner, Start Date, End Date, Status, and Priority. Add dropdown lists for Status and Priority, format the range as an Excel table, and apply date formatting to the Start Date and End Date columns.
That is the right split of work. You decide how the project should be tracked. ElyxAI handles the spreadsheet labor.
Write 5 Formulas for Dynamic Tracking
Monday morning usually exposes the difference between a tracker that works and one that only looks organized. A lead asks which tasks are late, how many are done, and where the budget is drifting. If the answer requires manual counting, color-filling rows by hand, and checking dates one by one, the sheet is still a list. A useful tracker calculates the obvious answers for you.
The formulas below are the ones I keep coming back to in Excel. They cover scheduling, status rollups, delay flags, visual alerts, and simple cost tracking. Build them yourself if you want full control. Delegate the setup to ElyxAI if you want the formulas inserted, copied down, and paired with formatting rules without spending an hour on spreadsheet maintenance.
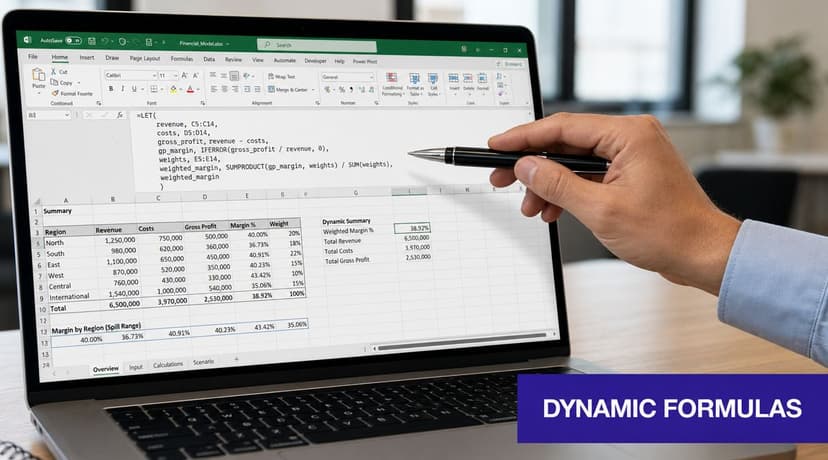
1. Use NETWORKDAYS for working duration
If C2 is Start Date and D2 is End Date:
=NETWORKDAYS(C2,D2)
This returns business days rather than calendar days, excluding weekends by default.
That matters because project conversations usually happen in working time. A task that runs from Thursday to Monday spans five calendar days, but only three working days. If your team uses a holiday list, extend the formula:
=NETWORKDAYS(C2,D2,$J$2:$J$15)
That extra range is worth adding early. It prevents avoidable arguments about whether a task is late or whether the sheet is counting time correctly.
2. Use COUNTIF for status totals
If column F contains Status and you want the number of completed tasks:
=COUNTIF(F:F,"Completed")
Use the same pattern for "In Progress", "On Hold", or "Not Started".
This is the formula behind many KPI tiles. It is simple, readable, and good enough for small and mid-sized trackers. The trade-off is that it depends on consistent status values. If someone types a variation instead of choosing from a dropdown, your counts drift. That is one reason I prefer setting up data validation first, then writing summary formulas after the allowed values are locked down.
3. Use IF and AND to flag overdue work
If D2 is End Date and F2 is Status:
=IF(AND(D2<TODAY(),F2<>"Completed"),"Overdue","")
This checks whether the planned finish date has passed and whether the task is still open.
Keep the output blunt. “Overdue” works better than a vague label because managers scan these files quickly. If you want a fuller signal, add another state for work due soon:
=IF(F2="Completed","",IF(D2<TODAY(),"Overdue",IF(D2<=TODAY()+3,"Due Soon","")))
That version is more useful in live delivery meetings because it catches the tasks that are about to become a problem, not only the ones that already are.
4. Use a formula-based conditional formatting rule for at-risk rows
For a full-row highlight when a task is overdue, select the task table and create a Conditional Formatting rule with:
=AND($D2<TODAY(),$F2<>"Completed")
Choose a fill color that your team will treat seriously. Red is fine for true exceptions. Amber is often better if the file is reviewed daily and you do not want every delay to look like a crisis.
This rule does not write text into the sheet. It changes what people notice first. That is a practical distinction. In a busy tracker, visual hierarchy matters as much as the formulas themselves. If you need better chart styling after the logic is in place, this guide to Excel data visualization patterns is a useful next reference.
5. Use SUMIF for cost by phase, owner, or workstream
If column B contains Phase and column H contains Cost, this totals the Design phase:
=SUMIF(B:B,"Design",H:H)
Swap "Design" for an owner, department, or project code as needed.
This is usually enough when the tracker needs light financial control without turning into a full budget workbook. Once cost categories multiply, SUMIFS becomes the better choice because you can filter by more than one condition. For example, cost for Design tasks that are still open:
=SUMIFS(H:H,B:B,"Design",F:F,"<>Completed")
That gives you a more honest view of outstanding spend than a single total.
A compact formula map
| Need | Formula | What it tells you |
|---|---|---|
| Working duration | =NETWORKDAYS(C2,D2) |
How many business days the task spans |
| Completed count | =COUNTIF(F:F,"Completed") |
How many tasks are done |
| Delay flag | =IF(AND(D2<TODAY(),F2<>"Completed"),"Overdue","") |
Which tasks are late |
| Visual risk alert | =AND($D2<TODAY(),$F2<>"Completed") |
Which rows should be highlighted |
| Cost summary | =SUMIF(B:B,"Design",H:H) |
Total cost for one category |
If you want to delegate the setup, give ElyxAI a prompt with the column names, the formulas, and the output behavior. For example: add a Duration column using NETWORKDAYS, create an Overdue flag based on End Date and Status, count Completed tasks in a summary area, and apply a conditional formatting rule to overdue rows. That is the build versus delegate split in practice. You keep the logic. The agent handles the repetitive Excel work.
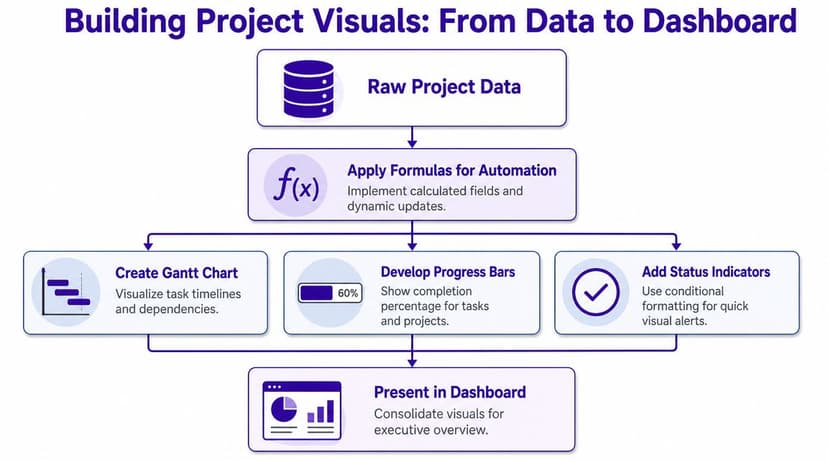
Build a Gantt Chart and 3 Progress Visuals
A tracker that only lists rows forces people to read too much. Visuals shorten the conversation. One glance should tell you what's running late, what's moving, and what's done.
Microsoft's template guidance pushes project trackers beyond simple task lists by recommending fields like dependencies, resources, cost, and completion status for stronger reporting, as shown in its project tracker and timeline guidance. That's the right direction. A modern spreadsheet should support both daily execution and management visibility.
If you want more chart design ideas inside Excel, this article on Excel data visualization gives good design patterns.
Build the Gantt chart the practical way
Use a simple stacked bar chart. You need at least these columns:
- Task Name
- Start Date
- Duration
Duration can be calculated from your start and end dates. Then:
- Insert a Stacked Bar Chart
- Use Start Date as the first series
- Use Duration as the second series
- Format the Start Date series with No Fill
- Reverse the task order on the vertical axis if needed
That leaves you with visible bars floating across the timeline, which creates the Gantt effect.
A Gantt chart is most useful when task sequencing matters. If your project has approvals, handoffs, or milestone windows, this view immediately shows overlap and congestion.
Here's a walkthrough worth watching before you format your own timeline:
Add three visuals people actually use
Not every visual belongs in a working tracker. These three do.
In-cell progress bars
If you have a Percent Complete column, apply Conditional Formatting with Data Bars.
This gives each task a compact visual indicator inside the cell. It's cleaner than adding another chart and easier for line managers to scan during a review.
A donut chart for task status
Summarize task counts by status and insert a donut chart. Keep the categories limited. Too many slices make it noisy.
This is useful for one question only: what share of the work is complete versus still active. If you need detailed diagnosis, use a PivotTable instead.
Icon-based status signals
Use Conditional Formatting icon sets or a dedicated health column with green, yellow, and red indicators. Keep the rule logic simple. For example:
- Green when completed
- Yellow when in progress
- Red when overdue or blocked
A visual should remove explanation, not create another legend people need to memorize.
For AI-assisted setup, a practical request is: create a Gantt chart from Start Date and End Date, add data bars to Percent Complete, and build a donut chart summarizing task count by Status. That's a good example of work that's repetitive enough to delegate.
Create Your 4-Part KPI Dashboard
At some point, nobody wants the task list. They want the answer.
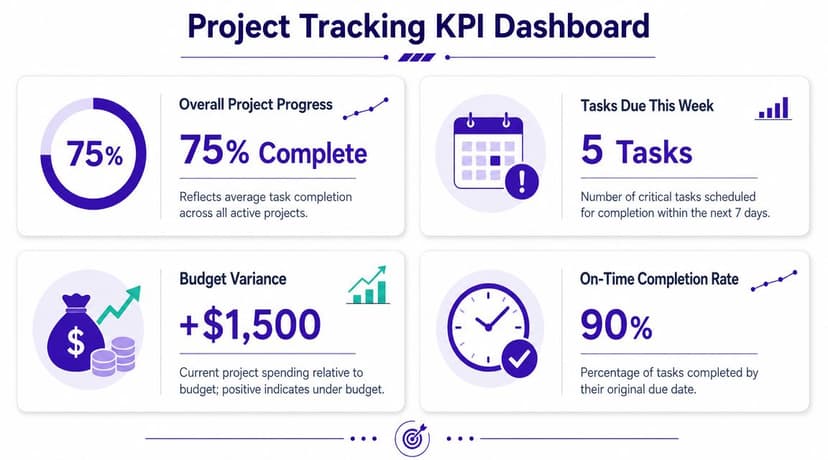
A dashboard exists for that moment. It turns detailed project tracking spreadsheets into a management view that answers the same recurring questions: How much is done? What's late? Are we staying within budget? Who is overloaded?
Excel trackers are often used precisely because they provide a quantitative view of KPIs and timelines, and one project-tracking resource notes that without effective tracking tools, teams risk joining the 78% of projects that reportedly go over budget in ProjectManager's discussion of Excel tracking. That's why dashboards matter. They convert raw maintenance into decision support.
If you want a ready-made layout pattern, this guide to a project tracking dashboard template shows the kind of components worth including.
The four KPIs I'd put in first
Create a separate worksheet called Dashboard and keep it lean.
| KPI | Formula idea | Why it matters |
|---|---|---|
| Overall completion | Completed tasks divided by total tasks | Shows delivery momentum |
| Overdue tasks | COUNTIF on Alert or Status | Surfaces immediate execution risk |
| Budget vs actual | Planned cost compared with actual cost | Exposes financial drift |
| Task load by owner | COUNTIF or PivotTable by Owner | Shows workload concentration |
Overall completion can be as simple as:
=COUNTIF(F:F,"Completed")/COUNTA(A:A)
You may need to exclude header rows or blanks depending on your table structure, but the logic is straightforward: divide completed tasks by total tasks.
Overdue tasks work well with the earlier alert formula. If your alert column says “Overdue,” then:
=COUNTIF(G:G,"Overdue")
Budget versus actual is usually cleaner in a separate financial sheet, then pulled into the dashboard with direct references or summary formulas.
Use PivotTables for the questions that change
Dashboards fail when every new question requires rebuilding formulas. That's where PivotTables help.
A simple PivotTable can show:
- Open tasks by owner
- Completed tasks by project
- Cost by phase
- Task count by priority and status
Given that managers rarely ask for the same cut of the data every time, flexibility in data presentation is essential. One week they want workload by owner. The next week they want all in-progress items by business unit. PivotTables let you reshuffle the summary without breaking the underlying tracker.
Manager check: If your dashboard can't be updated in a few clicks, it won't stay current for long.
Where an AI agent saves real time
This is the point in the workflow where AI becomes more than a formula helper. An agent such as Elyx AI can work inside Excel from a natural-language request, then execute the sequence itself: build a summary sheet, create PivotTables, insert charts, apply formatting, and adjust the layout. That's different from getting instructions and doing the work manually.
A practical prompt looks like this:
Create a dashboard sheet from my project tracker. Show total tasks, completion percentage, overdue tasks, task count by owner, and a status chart. Format it for a weekly management review.
That's the kind of work project managers shouldn't have to rebuild from scratch every Friday.
From Tracker to Template Your Next Steps
A tracker earns its keep when the weekly update takes minutes, not an afternoon. I usually judge an Excel tracker by one test: can a project lead open it on Friday, update dates and status, and trust the outputs without checking every formula? If the answer is no, the file is no longer a tracker. It is maintenance work.
Spreadsheets still have a clear place. They work well for a single project, a repeatable workflow, or a team that needs one shared structure with obvious rules. Excel gives you full control over fields, formulas, views, and formatting. That control is the advantage, and it is also the limit. Once several people are editing the workbook, reporting requests change every week, or teams start keeping side files to avoid breaking the master sheet, the tracker begins to cost more than it saves.
A practical cutoff looks like this.
Keep the tracker in Excel if:
Your process repeats cleanly
The same stages, owners, and status values show up every cycle.One file can answer the main questions
You are not stitching together updates from separate sheets or departments.The workbook is stable
People can update rows without breaking formulas, filters, or charts.Reporting is mostly consistent
Leadership asks for the same handful of views each week.
Turn it into a template once the structure is proven. Remove old project rows, keep the formulas, preserve formatting, protect the cells that should not be edited, and write a short tab with usage rules. If you want a clean process for standardizing that handoff, this guide on how to create Excel templates is a solid next step.
Then make one decision that most spreadsheet guides skip. Decide what you will keep building yourself and what you will delegate.
I still build the first version manually when I need to test the logic, choose the right fields, or see where the workflow breaks. After that, the repetitive work should be delegated. An AI agent such as Elyx AI can handle the time-consuming parts inside Excel: setting up the tracker from a plain-language prompt, applying formulas across new rows, generating recurring views, and rebuilding the template when requirements change. That is the significant upgrade. Not a prettier spreadsheet, but a tracker you can reuse without spending every Friday repairing it.
Reading Excel tutorials to save time?
What if an AI did the work for you?
Describe what you need, Elyx executes it in Excel.
Sign up