5 Methods for Automation on Excel: From Macros to AI

At 9:07 on a Monday, most Excel pain looks the same. Someone downloads three CSV files, fixes date formats by hand, deletes blank rows, rebuilds the same pivot tables, tweaks the same chart colors, and then wonders why half the morning disappeared.
That pattern is why automation on excel matters. Not as a grand transformation project, but as a way to stop doing work the spreadsheet can already do for you. The practical path starts with the tools built into Excel, then expands into connected workflows, and finally reaches AI agents that can execute a full request from one prompt.
Your Monday Morning Report Does Not Have to Be Manual
A common reporting cycle goes like this. Sales exports come from one system, finance data comes from another, and operations adds a manually maintained sheet with product categories or account owners. The analyst combines them, cleans them, matches headers, fixes text casing, and recreates the same summary pack that looked nearly identical last week.
Spending too much time on Excel?
Elyx AI generates your formulas and automates your tasks in seconds.
Sign up →That work feels normal because it happens so often. It still isn't the best use of your time.
Professionals using Excel automation report saving an average of 3+ hours per week on repetitive tasks like data cleaning, pivot tables, and report formatting, with error reduction of up to 90% compared to manual processes, according to this overview of automating Excel reports. In practice, that means fewer copy-paste mistakes and more time spent checking whether the numbers mean anything.
For finance teams, that shift matters even more when reporting deadlines are tight. If you're trying to map where spreadsheet work fits into a broader reporting process, this guide on Financial Reporting Automation is a useful companion because it frames Excel work inside the larger reporting chain instead of treating the workbook as an isolated task.
Practical rule: If you repeat the same Excel task every week or month, assume it should be automated until proven otherwise.
The mistake I see most often isn't lack of effort. It's using the wrong tool for the job. A macro is great for repeating interface actions. Power Query is better for recurring data cleanup. Dynamic reports solve the “why did my chart range break?” problem. Power Automate handles events outside the workbook. AI agents step in when you want the result without building every intermediate step yourself.
1. The 60-Second Fix with Record Macro
Excel automation started with VBA in 1993, when Microsoft turned Excel from a static spreadsheet into a programmable tool that could record and execute macros, as described in this history of Excel report automation. That history still matters because the Record Macro button remains the fastest entry point for many everyday tasks.

When Record Macro is the right choice
Use it when the task is mostly visual and repetitive. Good examples include:
- Formatting exports: Apply a table style, bold the header row, freeze panes, and set column widths.
- Standardizing presentation: Add the same title block, company colors, and number formats to every weekly report.
- Repeating workbook actions: Sort by the same column, filter the same field, and print or export the same range.
A recorded macro acts like a digital replay of your actions. Excel watches what you click and converts those steps into reusable VBA instructions.
A simple report formatting example
Say you receive a raw CSV every Friday. It always needs the same cleanup on the surface level:
- Open the file.
- Select the data range and turn it into an Excel Table.
- Apply your preferred table design.
- Autofit columns.
- Format revenue as currency and dates as dates.
- Add a header with the report name.
To record that:
- Go to View or Developer and click Record Macro.
- Give the macro a clear name such as
FormatWeeklySalesReport. - Perform the steps once, carefully.
- Click Stop Recording.
- Run it next time from the Macros menu or assign it to a button.
That’s the quickest win in automation on excel because you don't need to write code to get value.
If you want a practical walkthrough of how recorded VBA steps can be edited and improved later, this article on editing Excel macros is worth reading.
Record a macro only after you’ve done the task manually a few times. If the process still changes every week, the macro will only replay your confusion faster.
Where macros break
Macros are brittle when the worksheet structure changes. If last week’s export had revenue in column F and this week’s export moved it to column H, a recorded macro may fail or format the wrong cells.
A good rule is simple:
| Task type | Best fit |
|---|---|
| Same clicks every time | Record Macro |
| Same data cleanup every time | Power Query |
| Same output that must stay current | Dynamic report |
Macros are useful. They just aren't the answer to every repetitive Excel problem.
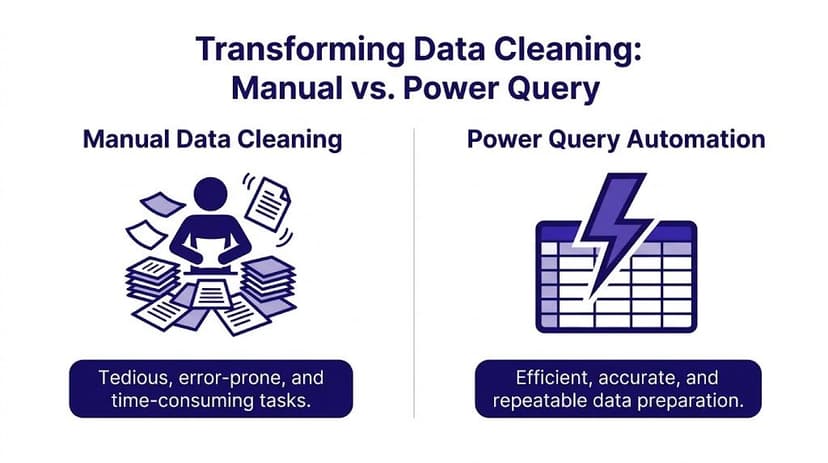
2. Automate All Data Cleaning with Power Query
Most spreadsheet time isn't spent on analysis. It's spent getting the data into shape so analysis is even possible. That's where Power Query earns its place.
A macro repeats clicks. Power Query builds a repeatable data preparation pipeline. You define the cleanup steps once, and then refresh them when new files arrive.
A realistic monthly workflow
Take a common case. You receive one sales file per month in the same folder. Each file has a few annoyances:
- Extra columns your report doesn't need
- Blank rows scattered through the export
- Duplicate records from system retries
- Names in one field when you need first and last name split
- Wide layouts that don't summarize cleanly in PivotTables
Power Query is built for this pattern.
Start from Data > Get Data > From Folder if the files live in one directory. Then use the editor to apply transformations such as removing unnecessary columns, filtering out blanks, removing duplicates, splitting columns, and unpivoting month or category fields into a proper tabular structure.
What the main transformations actually do
A lot of tutorials mention these steps without explaining why they matter.
- Remove columns when a source system exports technical fields nobody uses. This keeps your model lean and your report easier to audit.
- Split column by delimiter when a field like
Full Nameneeds to becomeFirst NameandLast Name. That matters if another table uses separate fields for matching. - Remove duplicates when transaction IDs or customer rows repeat. This prevents inflated totals.
- Unpivot columns when your source spreads values across many month columns. PivotTables work better when dates live in one column and values in another.
If you work with messy files often, this guide on what data munging means in Excel work gives useful vocabulary for the cleanup stage.
The biggest Power Query advantage isn't speed by itself. It's that the same cleanup logic runs again on the next file instead of relying on memory.
Why Power Query beats manual cleanup
Power Query was first released as a free add-in in 2010 and became native in Excel 2016. According to this Excel automation overview, it can reduce manual data cleaning time by up to 80% when used for repeatable transformations.
That number makes sense in practice because the painful part of data cleanup isn't one action. It's the chain of small actions. Filter. Delete. Reformat. Split. Recheck. Repeat. Power Query captures that chain.
What Power Query does not do well
It won't replace everything.
- It doesn't drive the Excel interface the way a macro can.
- It doesn't send messages or trigger approvals in other apps.
- It assumes some structural consistency in the source files.
When the source format is chaotic in a different way every time, you either need stronger upstream data discipline or a tool that can reason through the changes.
3. Create Dynamic Reports That Update Themselves
A clean dataset is only half the job. The next failure point is the report itself. Plenty of teams automate import and cleanup, then still rebuild charts and formulas manually because the report range keeps breaking.
Dynamic reports solve that.
Start with the right structure
The most reliable Excel reports usually separate the workbook into simple layers:
- Data sheet for raw or query-loaded data
- Control sheet for assumptions, selections, and checks
- Report sheet for the final output
That structure keeps formulas cleaner and reduces accidental edits. It also makes handoffs easier when someone else inherits the workbook.
Format your cleaned dataset as an Excel Table. This is one of the most practical moves in automation on excel because Tables expand automatically when rows are added. Formulas, PivotTables, and chart sources become much easier to maintain.
If you want a step-by-step reporting walkthrough, this guide on how to create a report in Excel is a useful reference.
Build a report that grows with new data
Once your source is a Table, build output from that object instead of fixed cell ranges.
A practical stack looks like this:
| Component | Why it matters |
|---|---|
| Excel Table | Expands with new rows |
| PivotTable | Summarizes without custom formulas everywhere |
| PivotChart | Updates when the pivot refreshes |
| KPI formula cells | Gives quick status indicators |
| Conditional formatting | Makes exceptions visible immediately |
For project tracking or operational reporting, a formula like =IF(C2<=B2,"On Time","Delayed") labels each item based on actual versus target date. Then a completion KPI can be calculated with `=COUNTIF(D$2:D$100,"On Time")/COUNTA(D$2:D$100)“ to show the share of on-time items, using the formula pattern described in this Excel automation article.
Here’s what that second formula is doing in plain English:
COUNTIF(D$2:D$100,"On Time")counts the rows marked On Time.COUNTA(D$2:D$100)counts all non-empty status cells.- The first value is divided by the second to return a completion rate.
The dollar sign before the row reference anchor keeps the range stable when copied across other cells. That small detail prevents reporting formulas from drifting.
Check before refresh: Compare row counts before and after import, especially when your report feeds leadership or clients.
That matters because quality controls such as row count comparisons and checksum verification after imports are a key success factor in Excel automation. Organizations using that kind of structured control reportedly save an average of 15 hours per week on reporting tasks, according to this implementation guide on automating an Excel spreadsheet.
A relatable use case outside corporate reporting
This structure also applies to individual performance tracking. For example, a trader logging entries, exits, and notes can turn a raw log into a dynamic dashboard with win/loss summaries, setup tags, and review charts. A ready-made trading journal template in Excel is a good example of how a plain table becomes a living report once the structure is right.
Dynamic reports aren't flashy. They just remove the need to keep fixing the same workbook.
4. Connect Excel to Other Apps with Power Automate
Some Excel work doesn't start in Excel at all. A form gets submitted. A file lands in OneDrive. A message arrives in Outlook. Someone updates a SharePoint list. In those cases, the workbook is just one stop in a broader process.
That’s where Power Automate helps.

A practical workflow example
A simple but useful flow looks like this:
- A colleague submits a Microsoft Form.
- Power Automate captures the response.
- The flow adds a row to an Excel Online table stored in OneDrive or SharePoint.
- Teams sends a notification to the project manager.
- The workbook stays current without manual rekeying.
That changes Excel from a file someone updates into part of an operating process.
If you're building this kind of workflow, this article on Power Automate with Excel covers the setup patterns worth knowing.
The real trade-off
Power Automate is useful because it reaches beyond the workbook. It can react to events and move data through connected apps. But it also exposes one of the biggest frustrations in modern Excel work.
A major pain point is the lack of a single cross-platform automation solution that works smoothly across Web, Windows, and Mac, especially because VBA is desktop-only and Office Scripts are web-only, as discussed in this Microsoft Learn user thread on Excel automation across platforms.
That fragmentation matters in hybrid teams. One person builds a desktop macro. Another works in Excel for the web. A third needs the process on a Mac. Suddenly the automation only works for part of the team.
When Power Automate fits well
Use it when the trigger or destination lives outside Excel.
- Form intake: Capture responses and log them automatically.
- Notifications: Alert people in Teams or email when a status changes.
- Scheduled flows: Refresh or distribute workbook-based outputs at set times.
- Cloud workflows: Keep shared files in OneDrive or SharePoint tied to other Microsoft 365 tools.
It’s less useful when your pain is purely inside the workbook. If the problem is data cleanup, use Power Query first. If the problem is report formatting, a macro may be simpler.
5. Use AI to Execute Complete Workflows Autonomously
The hardest part of Excel automation isn't always the work. It's knowing how to build the sequence in the first place.
A lot of users can describe the result they want with complete clarity. They want duplicates removed, categories standardized, a PivotTable built, a chart added, and the layout cleaned up. What they can't always do quickly is translate that request into Power Query steps, formulas, pivots, formatting rules, and review checks.

That gap is why autonomous AI agents matter. A major gap in Excel content is guidance on full multi-step workflow automation. A 2025 Gartner survey found 72% of power users still spend 40% of their time on mechanics because tools like Copilot explain steps rather than executing them, according to this article on automation in Excel and autonomous agents.
What changes with an AI agent
Traditional automation asks you to build the machinery first. An AI agent starts from the outcome.
A typical natural-language request might be:
Clean this data by removing duplicates and blank rows, standardize date formats, create a pivot table showing total sales by region and product category, add a bar chart for regional sales, and format the report professionally.
That is not one task. It’s a chain of tasks across cleanup, transformation, summarization, visualization, and presentation.
An AI agent for Excel is built for this kind of chained request. If you want the concept explained clearly, this article on what an Excel AI agent is is a good starting point.
Before and after in practical terms
Here’s the before state many teams know well:
- Raw file with inconsistent dates
- Blank rows from export artifacts
- Duplicate customer records
- Text categories with inconsistent naming
- No summary layer for decision-making
The after state is what managers want to open:
- Clean table ready for analysis
- Grouped view by region, product, or owner
- Visual chart that updates with the data
- Readable formatting instead of a dump of system output
That’s where an autonomous tool can save more than keystrokes. It can save design effort.
Later in the workflow, video demos help because the difference is visual, not just theoretical.
Where AI agents fit and where they don't
An agent doesn't replace judgment. It handles mechanics well, but you still need to decide what the report should prove, which metrics matter, and whether the output matches business logic.
That means the strongest use cases are the ones where the desired outcome is clear but the manual process is long:
| Situation | Why an AI agent helps |
|---|---|
| Messy recurring exports | It can clean and reshape without you building every step |
| One-off analysis requests | It reduces setup time for pivots, charts, and formulas |
| Non-technical users | It lowers the need to know VBA, M code, or advanced formulas |
| Expert users under deadline | It offloads mechanics so they can review and refine |
One option in this category is Elyx AI, an Excel add-in that executes multi-step spreadsheet workflows from natural language inside the workbook. The practical appeal isn't that it invents a new kind of spreadsheet. It's that it handles tasks like cleaning data, creating pivots, generating charts, and formatting output without requiring the user to stitch together every step manually.
Ask AI for an outcome, not a feature. “Build a weekly margin report from this table” is better than “help me with formulas.”
What doesn't work well is vague prompting. “Make this better” usually produces mixed results because the instruction is underspecified. Clear requests still matter.
Choosing Your Automation Path
The right automation path depends less on your skill level and more on the shape of the problem.
If the task is repetitive formatting inside desktop Excel, use a macro. It’s fast to record, easy to rerun, and ideal for surface-level repetition.
If the pain lives in imports, cleanup, merges, and reshaping, choose Power Query. It’s the reliable option when the source changes by period but follows the same general structure.
If your problem is that reports keep breaking when new rows arrive, build a dynamic report with Tables, PivotTables, formulas, and simple control checks. That gives you output that stays alive instead of output you keep repairing.
If the workbook needs to react to forms, messages, schedules, or cloud files, use Power Automate. That’s the bridge between Excel and the rest of your stack.
If you know the end result you want but don't want to build every step yourself, an AI agent is the next layer. It’s useful when the work is multi-step, the request is clear, and the friction sits in execution rather than thinking.
The core lesson is simple. Don't automate Excel because automation sounds advanced. Automate the parts that steal attention from analysis, review, and decision-making. That’s where Excel stops being a maintenance task and starts becoming a tool that supports the job.
If you want to try the last step in that roadmap, Elyx AI lets you describe a spreadsheet task in plain language and have the add-in execute the workflow directly inside Excel. It's a practical fit when you're done spending time on cleanup, pivots, charts, and formatting mechanics and would rather review the finished work.
Reading Excel tutorials to save time?
What if an AI did the work for you?
Describe what you need, Elyx executes it in Excel.
Sign up