9 Ways Excel AI Can Transform Your Spreadsheets

Ever found yourself wondering what Excel AI actually does? It's not magic, but it's close. Think of it as having a personal data assistant right inside your spreadsheet who understands plain English and can automate tedious jobs in seconds. Whether it's cleaning up messy data, writing a tricky formula, or building a full-blown report, AI is completely changing how we work with spreadsheets.
9 Answers to 'What Can Excel AI Do'
Imagine you have a skilled colleague who loves doing the boring parts of your job—the tasks that make your eyes glaze over. That’s Excel AI. Instead of spending hours clicking through menus or Googling the right function, you just tell the AI what you want. It handles all the heavy lifting, freeing you up to think about what the data actually means.
The big question for most people is, "What can it do that I can't already do myself?" The real difference isn't just about what's possible; it's about speed and simplicity. AI makes advanced Excel functions accessible to everyone. You no longer need to be a formula wizard or a PivotTable expert to uncover powerful insights from your data.
Spending too much time on Excel?
Elyx AI generates your formulas and automates your tasks in seconds.
Sign up →If you're just getting started and want a deeper dive into the fundamentals, our guide on what is Excel AI is the perfect place to begin.
It all happens right inside Excel through a simple chat panel. You just type what you need, like you’re talking to a person.
This integrated approach is key. You never have to leave your worksheet, so your workflow stays smooth and uninterrupted.
To give you a clearer picture, we've put together a table that breaks down the core functions of Excel AI. It shows what each capability does and gives a real-world example of how you might use it.
A Glance at 9 Core Excel AI Capabilities
| AI Capability | What It Does for You | Example Use Case |
|---|---|---|
| 1. Data Cleaning | Automatically standardizes formats, removes duplicates, and fills gaps. | Fixing a messy contact list with inconsistent phone numbers and missing zip codes. |
| 2. Formula Generation | Creates complex formulas from a simple description. | "Get the total sales for the North region in Q2" becomes a perfect SUMIFS formula. |
| 3. Pivot Table Creation | Builds an entire PivotTable from a single command. | "Summarize sales by product category and month." |
| 4. Chart & Graph Building | Generates professional charts to visualize your data. | "Create a bar chart showing revenue per salesperson." |
| 5. Data Analysis | Identifies trends, outliers, and key patterns in your dataset. | "Analyze this sales data and tell me the top 3 performing products." |
| 6. Report Automation | Combines data, tables, and charts into a complete summary report. | "Create a weekly performance report from this raw data." |
| 7. Text & Data Extraction | Pulls specific information out of unstructured text. | Extracting all email addresses or invoice numbers from a column of notes. |
| 8. Data Formatting | Applies conditional formatting or styles based on instructions. | "Highlight all sales figures over $10,000 in green." |
| 9. Predictive Forecasting | Uses historical data to project future outcomes. | "Forecast next quarter's sales based on the last two years of data." |
As you can see, these capabilities aren't just minor conveniences. They automate the entire data workflow, from raw numbers to a polished, insightful report.
The ultimate goal here is to turn your instructions into finished work. You focus on the "what," and the AI handles the "how."
This shift saves the average professional over 3 hours per week on repetitive spreadsheet tasks alone.
These nine functions are just the beginning. To get a sense of how AI is being used everywhere, it's worth reading up on What Can Artificial Intelligence Do Today?. Understanding the bigger picture helps you see just how powerful these tools are becoming, giving you a clear guide to the future of spreadsheets.
1. Tame Your Messy Data with AI
Anyone who works with data knows the drill. Before you can get to the exciting part—the analysis and insights—you have to roll up your sleeves and clean the data. It's easily the most tedious part of the job. In fact, some studies show that analysts can spend up to 80% of their time just preparing data.

This means manually fixing typos, getting date formats to match, hunting down duplicate entries, and figuring out what to do with blank cells. It’s slow, repetitive work, and it’s surprisingly easy to make a small mistake that throws off your entire analysis.
How Excel AI Handles the Dirty Work in 3 Steps
This is where Excel AI tools really shine. Instead of you having to write complex formulas or go through a dozen manual steps, you can just tell an AI agent what you need done using plain English. An AI tool like ElyxAI acts like an expert data analyst sitting right inside your spreadsheet. It understands your instructions and gets the job done in seconds.
You can give it a whole list of instructions in one go. For example, you could type a single command like:
- "Find and remove all the duplicate rows based on the 'Email' column."
- "Standardize all the dates in the 'Join Date' column to MM/DD/YYYY format."
- "In the 'Sales' column, fill any empty cells with the average of that column."
The AI reads this, understands all three distinct tasks, and executes them one after another—no extra clicks needed. This doesn't just give you hours back in your day; it also makes your data far more reliable by eliminating the chance of human error. The result is a clean, trustworthy dataset that’s ready for you to analyze.
If you're still doing some cleaning by hand and want to sharpen your skills, our guide on data cleaning best practices has some great tips.
2. Generate Complex Formulas with Natural Language
Let's be honest—we've all been there. You spend hours wrestling with a complex formula, trying to nest VLOOKUP or INDEX(MATCH) just right, only to be greeted by that dreaded #N/A! error. That constant back-and-forth between your spreadsheet and a search engine is one of the most common frustrations in Excel.
Thankfully, AI is changing the game. Now, instead of memorizing syntax, you can generate the most complicated formulas just by describing what you need in plain English.

Think of it as having a translator. You know what you want the data to do, and the AI translates your simple words into the precise language Excel understands. No more syntax headaches.
From 1 Simple Command to a Powerful Formula
Imagine you're a sales manager staring at a massive sheet of quarterly data. You need a specific number, but the thought of building the formula from scratch is daunting. With an AI tool, you can just type out your request.
Your prompt:
"Create a formula to find the total sales for the North region in Q3, excluding any returns."
The AI gets to work and instantly provides the perfect formula for the job.
The AI-generated formula:=SUMIFS(Sales[Amount], Sales[Region], "North", Sales[Date], ">=2026-07-01", Sales[Date], "<=2026-09-30", Sales[Type], "<>Return")
Formula Explanation:
SUMIFS: This function sums cells that meet multiple criteria.Sales[Amount]: This is the range of cells to sum (the sales figures).Sales[Region], "North": The first condition. It only includes rows where the 'Region' is "North".Sales[Date], ">=2026-07-01": The second condition. It filters for dates on or after July 1st.Sales[Date], "<=2026-09-30": The third condition. It filters for dates on or before September 30th (covering Q3).Sales[Type], "<>Return": The final condition. It excludes any rows where the 'Type' is "Return".
This opens up advanced Excel capabilities to anyone. If you want to see this in action, our guide on how to use an Excel AI formula generator has more great examples. It's also a fantastic way to learn, as many AI tools will explain why the formula works, helping you become a better Excel user in the process.
3. Build Pivot Tables and Charts with a Single Command
Let's be honest: pivot tables are one of the most powerful tools in Excel, but they can also be one of the most frustrating. Figuring out which fields go into the rows, columns, and values boxes often feels like a guessing game of dragging and dropping until the report finally looks right. And then you still have to build a chart on top of that.
This is where AI completely changes the game. Instead of wrestling with the PivotTable Fields pane, you can just tell the AI what you want to see. The whole process becomes less of a technical chore and more of a simple conversation.
From 1 Command to Insightful Visuals
Imagine you have a spreadsheet packed with sales data from the last quarter. Building a summary report by hand could easily eat up a good chunk of your afternoon. With an AI tool, you just type out your request, even if it involves multiple steps.
"Create a pivot table showing total revenue by product category and region, then make a bar chart to visualize it."
An AI agent like ElyxAI gets to work immediately. It will:
- Scan and understand the layout of your data.
- Pinpoint the correct columns for "Revenue," "Product Category," and "Region."
- Build the pivot table for you, placing everything in the right spot.
- Generate a clean, professional-looking bar chart from that new summary data.
What used to be a tedious, multi-step process is done in seconds, all from a single instruction. No more trial and error.
2 Key Benefits of AI Chart Suggestions
One of the smartest things about using AI here is that it helps you avoid common mistakes. The AI understands the context of your data and guides you to the best visual.
- Contextual Recommendations: If you ask it to show monthly sales trends, it will almost certainly suggest a line chart, which is perfect for tracking data over a period.
- Clear Comparisons: If you’re comparing sales across different product lines, it might recommend a bar chart for a clear side-by-side comparison. This ensures your charts aren't just decorative, but actually tell a clear and accurate story.
If you want to see this in action, take a look at our guide on how to create a pivot table using AI. It’s a fantastic way to see how you can go from raw numbers to a compelling report without all the manual heavy lifting.
4. Automate Entire Workflows from Raw Data to Finished Dashboard
This is where Excel AI really shines. We’re moving beyond asking for a single formula or chart. Now, you can hand off an entire multi-step project, from messy raw data all the way to a polished dashboard, and let the AI handle everything in between.
Think of it less like a calculator and more like a junior analyst. You’re no longer the one doing the tedious work of cleaning, summarizing, and visualizing. Instead, you're the manager who sets the objective. You give the high-level goal, and the AI executes the step-by-step process to get it done.
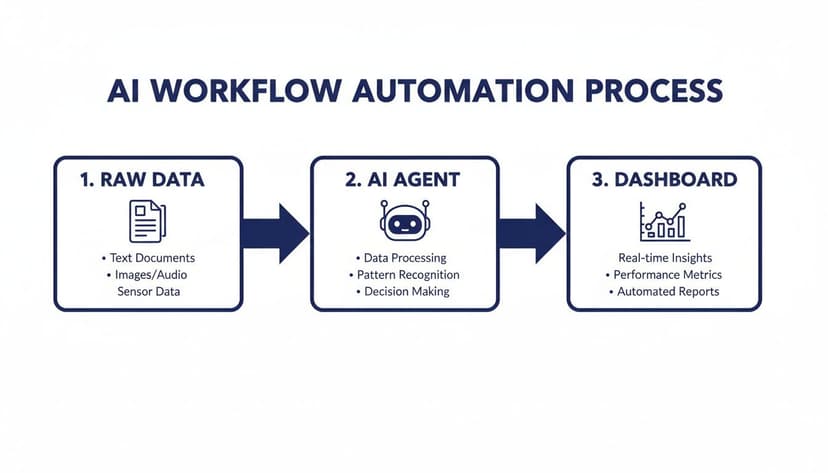
This process is what it looks like in practice. The AI becomes the engine that takes a jumble of raw information and turns it into clean, clear insights, without you needing to touch a single cell manually.
From 1 Complex Request to a Finished Report
Let's say you just got a fresh dump of sales data. Your end goal is a clean report for your weekly meeting, but getting there involves a bunch of steps. Instead of doing them one by one, you can give your AI a single, comprehensive command.
Your Prompt: "Take this raw sales data, clean it by removing duplicates and errors, create a summary report with pivot tables for sales by region, generate trend charts for monthly performance, and format the report using our company's branding colors."
A tool like ElyxAI understands this isn't just a list of tasks—it's a sequence. It knows to clean the data first, then build the pivot tables from that clean data, create the charts from those pivots, and finally, apply the formatting. The result? A finished report, ready to go.
The time savings here are huge. A 2024 study from Microsoft found that people using AI tools were 29% more productive and made decisions faster. Many professionals are already saving 3+ hours every week on exactly these kinds of repetitive reporting tasks. You can find more discussions on these AI-powered productivity gains at Windows Forum.
When you hand off the entire workflow to an AI, you get to skip the grunt work and jump straight to the most important part of your job: analyzing the results, finding opportunities, and making smart decisions. If you want to explore this further, check out our guide on how to automate Excel reports.
5. Predict the Future with Trend Analysis and Forecasting
Excel has always been great for looking at what’s already happened. But what if it could give you a reliable glimpse into the future? With AI, now it can. These tools use machine learning to dig through your historical data—like past sales figures or web traffic—to spot hidden patterns and generate surprisingly accurate forecasts.

Suddenly, Excel isn't just a ledger for past performance; it’s a strategic tool for planning your next move. You get to skip the headache of building complex statistical models from scratch.
From 2 Years of Data to a 6-Month Forecast
Think about your next quarterly planning meeting. The old way involved painstakingly drawing trendlines and making educated guesses. Now, you can just ask the AI a straightforward question.
"Forecast our sales for the next six months based on the last two years of data, and make sure to account for seasonality."
The AI gets to work, applying sophisticated algorithms to project future trends. This gives you a solid, data-backed foundation for deciding where to allocate your budget or what sales targets to set. It's a true game-changer for everything from managing inventory to proving marketing ROI.
Why AI Forecasting Is Becoming the New Norm in 2026
This isn't just a niche feature; it’s quickly becoming standard practice. The adoption of AI in Excel has been massive. By 2026, a staggering 63% of advanced users were already using at least one AI tool in their workflow. You can read more about the latest AI in Excel statistics on Acuity Training.
This shift is happening because it makes powerful analytics available to everyone, not just data scientists. It means less time crunching numbers and more time thinking strategically about the big question: "So, what's next?"
3 Frequently Asked Questions About Excel AI
It’s smart to ask a few questions before bringing a new tool into your spreadsheets, especially one that works with your data. Let's tackle some of the most common ones we hear from people thinking about using AI in Excel.
1. Is My Data Secure When Using an Excel AI Add-in?
This is usually the first question people ask, and for good reason. The answer comes down to the specific tool you choose—not all are created equal. A trustworthy AI add-in like ElyxAI is built with a privacy-first approach and is an official Microsoft AppSource add-in. It processes your information locally on your computer. Here’s what that really means for you:
- Your data never leaves your machine. The only thing sent to the cloud is your instruction (the request you type), not the spreadsheet data itself.
- Your spreadsheet is never stored on some far-off server or used to train other AI models.
When you're vetting a tool, find its privacy policy. It should state clearly that your data stays yours and is handled with enterprise-grade security.
2. Do I Need to Be an Excel Expert to Use These AI Tools?
Not at all. In fact, that's one of the best parts. These AI tools are designed to bridge the gap between beginners and Excel power users. You don’t need to be a formula wizard or have memorized how to build a pivot table. Tools like ElyxAI are made to understand plain English. Instead of hunting down a tutorial to figure out some complex function, you just describe what you need done. This lets newcomers perform advanced tasks right away, and it gives experts a way to automate their most repetitive work.
3. How Is an AI Agent like ElyxAI Different from Microsoft Copilot?
This is a great question. While both are AI assistants for Excel, they play different roles. Think of them as two different kinds of helpful colleagues.
Microsoft Copilot is woven into the entire Office 365 suite. It's great for brainstorming ideas, summarizing information across different apps (like Word and Excel), and handling quick, single-step tasks inside your spreadsheet.
An AI agent like ElyxAI, however, is a specialist built to be an autonomous doer for complete, multi-step projects. You can give it a high-level goal, and it will carry out the entire sequence of tasks on its own. For instance, you could tell ElyxAI, "Clean this messy data, build a sales report with a pivot table, create three charts from that table, and format everything professionally." It will just do it.
So, Copilot is a fantastic assistant for suggestions and quick actions; ElyxAI is the expert who takes the project off your plate and gets it done for you.
Ready to stop wasting hours on repetitive Excel work? ElyxAI acts like an expert analyst sitting right beside you, turning your plain-English requests into finished reports in seconds. Start your free 7-day trial and see how much you can accomplish. https://getelyxai.com
Reading Excel tutorials to save time?
What if an AI did the work for you?
Describe what you need, Elyx executes it in Excel.
Sign up