How to Automate Excel Reports: A Practical Guide with Power Query, VBA, and AI

Automating your Excel reports is a structured process: you first connect your data sources using Power Query to create a reliable data pipeline, then build dynamic dashboards with tools like PivotTables, and finally, use scripts (like VBA) or platforms (like Power Automate) to handle the refresh and distribution. This practical guide will show you how to transform a tedious, repetitive task into an efficient, hands-off workflow.
Why Manual Excel Reporting Is Holding You Back
If you're still spending hours every week—or even every day—copying and pasting data into Excel for your reports, you're facing a common but significant challenge. This manual process is not just tedious; it's a major bottleneck prone to human error, which delays critical decisions and keeps your team bogged down in data assembly instead of performing valuable analysis. This cycle is unsustainable for any growing business.
This problem is more widespread than you might think. Despite the availability of advanced BI tools, Excel remains a cornerstone in many departments, particularly finance. A projected 58% of finance leaders will still rely on Excel as their primary technology by 2025. More concerning is that nearly half of them—49%—operate with zero automation, performing all tasks manually. This reveals a significant gap between Excel's capabilities and its day-to-day application.
Spending too much time on Excel?
Elyx AI generates your formulas and automates your tasks in seconds.
Sign up →The Hidden Costs of Sticking to Manual Methods
The true cost of manual reporting extends beyond lost hours. It creates a ripple effect of issues that slowly degrade your team's efficiency and the trustworthiness of your data.
- Data Inaccuracy: Every manual data touchpoint—from a simple copy-paste to retyping a number—introduces a risk of error. A single incorrect figure can invalidate an entire report, leading to flawed business decisions. To get a better handle on this, check out our guide on how to automate data entry in Excel.
- Delayed Decisions: When your team must wait days for a report to be manually compiled, they are forced to make decisions based on outdated information. An automated process provides insights almost instantly, enabling proactive strategy rather than reactive damage control.
- Inconsistent Outputs: When different people build the same report, the results often vary. Inconsistent formatting and structure look unprofessional and can cause confusion. An automated process ensures a standardized, clean template is used every single time.
The primary benefit of automation isn't just speed. It's about enhancing accuracy, consistency, and the strategic value of your reports. The goal is to transition from a manual data wrangler to an automated analyst—a crucial step for any team aiming to be truly data-driven.
To fully appreciate the impact of this shift, it's helpful to understand the broader benefits of business process automation across an organization. In this guide, we'll walk you through how to apply these principles directly within Excel, transforming your reporting from a chore into a powerful, automated asset.
Build a Bulletproof Data Pipeline with Power Query
This is where the foundational work of automating your reports begins. If you are still copying and pasting data, it is time to adopt a more efficient method. We will use Power Query, Excel’s built-in data engine, to create a repeatable data pipeline that handles all the heavy lifting for you.
Think of Power Query as your dedicated data assistant. It meticulously records every step you take to clean and prepare your data—removing blank rows, splitting columns, or standardizing date formats—and saves it as a reusable "recipe." You define the process correctly once, and Power Query executes it perfectly every time.
Your First Automated Data Workflow
Let's explore a common scenario: you receive monthly sales data as separate CSV files in a shared folder. Manually combining these files each month is not only time-consuming but also highly susceptible to errors. With Power Query, you can set up the process once and eliminate this manual task permanently.
The process begins by connecting Power Query directly to the folder containing your sales files. Instead of opening each file individually, you simply point Excel to the folder. Power Query intelligently accesses the folder, retrieves all the files, and consolidates them into a single, clean table.
Once connected, you can apply various transformations:
- Remove Unnecessary Columns: Eliminate any data that is not relevant to your final report. A cleaner dataset is simpler to work with.
- Filter Out Blank Rows: A single click can remove all the empty rows that often appear in raw data exports.
- Standardize Data Types: This is a critical step. Ensure numbers are formatted as numbers and dates as dates to prevent common issues when creating charts and formulas.
- Split Columns: Easily separate a "Full Name" column into "First Name" and "Last Name," or break down a complex product ID into its component parts.
The traditional manual approach is slow and fraught with potential errors, trapping you in a cycle of repetitive tasks.
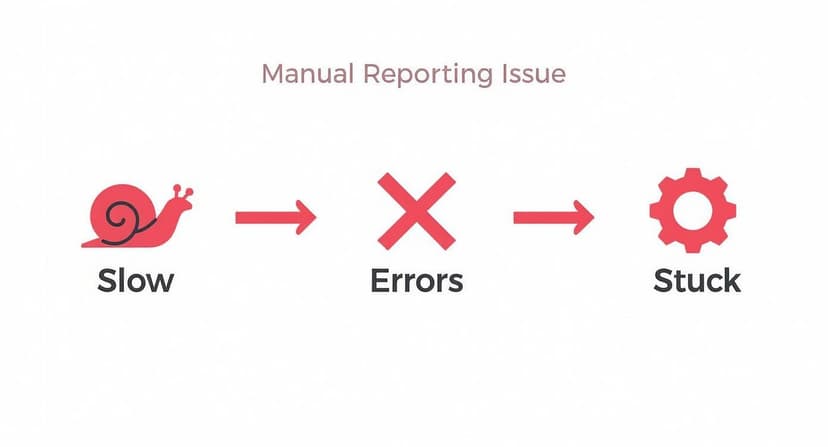
This image perfectly illustrates the problem. Manual reporting is slow, prone to human error, and gets bogged down in repetitive steps. Power Query was specifically designed to solve these issues.
Let's compare the two approaches to highlight the difference in efficiency.
Manual vs Power Query Data Preparation
| Task | Manual Method (Repetitive & Error-Prone) | Power Query Method (Automated & Consistent) |
|---|---|---|
| Combining Files | Open each file, copy data, paste into master sheet. | Connect to folder, click "Combine." |
| Removing Columns | Manually select and delete columns each time. | Select columns to remove once; it's saved as a step. |
| Filtering Rows | Apply filters, copy visible cells, paste elsewhere. | Set filter criteria once; it applies automatically on refresh. |
| Fixing Dates | Use TEXT or DATEVALUE formulas; drag down. |
Change data type to "Date"; Power Query handles it. |
| Updating Report | Repeat the entire process from scratch with new data. | Click "Refresh All." |
The comparison clearly shows that Power Query is superior, turning a recurring manual task into a simple one-click update.
The Power of Repeatable Steps
Every action you perform in the Power Query Editor is logged in the "Applied Steps" pane on the right. This list serves as your automation blueprint—a perfect, chronological record of every transformation you’ve applied.
The key benefit here is its permanence. Next month, when new sales files are added to the folder, you won't need to repeat any steps. Simply go to the Data tab in Excel and click Refresh All. Power Query will instantly re-run every recorded step on all files—including the new ones—and update your master data table.
This represents a fundamental shift from doing the work to building a system that does the work for you. You are no longer just a data cleaner; you are the architect of the data cleaning process.
While coding knowledge is not required, it's empowering to know that every click you make generates a powerful script (in a language called M) in the background. If you're interested in learning more, our Excel Power Query tutorial is an excellent starting point.
Connecting to All Kinds of Data Sources
Power Query's capabilities extend far beyond handling local files. Its real strength lies in its ability to connect to a wide variety of data sources.
You can pull data directly from:
- SQL Databases: Establish a live connection to your company’s central databases.
- SharePoint Lists: Easily integrate data from your team’s collaboration sites.
- Web Pages: Scrape tables and other data directly from a website.
- Other Excel Workbooks: Consolidate information from multiple spreadsheets across your network without opening them.
By establishing these connections, you create a robust foundation for your reports. Your data pipeline becomes a "set it and forget it" asset that consistently provides clean, reliable data, freeing you to focus on what truly matters: generating insights, not wrestling with spreadsheets.
Design Reports That Update Themselves
Now that you've built a solid data pipeline in Power Query, the tedious part of the process is over. The next step is to create a professional, interactive report that essentially manages itself.
The objective is to design a front-end experience—the charts, tables, and summaries your audience will see—that requires no manual updates after the data is refreshed.
This is where you connect your clean data to powerful Excel tools like PivotTables and PivotCharts. These are not just for one-off analyses; they are the core components of a dynamic, automated dashboard. By linking them directly to your Power Query output, any new data will flow through to your visuals with a single refresh.
From Raw Data to Interactive Insights
A PivotTable acts as the bridge between your clean data table and your finished dashboard. It is the engine that can instantly summarize millions of rows of data into a comprehensible format.
Start by creating a PivotTable directly from your Power Query output. Then, simply drag and drop fields to arrange your data. For example, place "Sales Region" in the Rows area, "Product Category" in Columns, and "Total Revenue" in Values. In just a few clicks, you have a structured summary ready for analysis.
Next, you can build PivotCharts that are directly linked to that PivotTable. To visualize regional performance, create a bar chart. To track sales over time, a line chart is ideal. Because the chart is based on the PivotTable—which is, in turn, based on your Power Query data—the entire system is interconnected. When you refresh the data, the PivotTable updates, and your charts instantly reflect the new numbers.
The key is to build in layers. Your visuals depend on your PivotTables, and your PivotTables depend on your clean data source. This layered structure creates an automated chain reaction that eliminates the need to manually adjust charts ever again.
Making Your Reports Truly Interactive with Slicers
A static report is useful, but an interactive one is a game-changer. This is where slicers and timelines become invaluable. These are visual filters that allow anyone—even those unfamiliar with Excel—to explore the data on their own terms.
Instead of creating separate charts for each product or year, you can add a slicer for "Product Category" and a timeline for "Order Date."
- Slicers: These are user-friendly filter buttons. The best feature is that you can connect a single slicer to multiple PivotTables and PivotCharts. When a user clicks "Electronics," every visual on your dashboard instantly filters to display only electronics-related data.
- Timelines: Designed specifically for date fields, timelines allow users to filter by year, quarter, month, or day using a simple, intuitive slider. This is a fantastic way to analyze trends over various time periods.
This approach transforms your dashboard from a static image into a flexible analytical tool. Your colleagues can answer their own questions and drill down into the data that matters most to them, all without any risk of altering the underlying data or report structure.
Creating a Polished Summary Dashboard
While PivotTables are incredibly powerful, they are not always visually suitable for an executive summary. For a clean, high-level dashboard, you can create a dedicated summary sheet that extracts key metrics from your PivotTables using the GETPIVOTDATA formula.
This formula may seem intimidating at first, but it is one of the most useful functions for dashboard creation. It allows you to pull a specific value from a PivotTable. For example, you can retrieve the "Grand Total" of sales or the exact revenue for the "North Region" and "Software" category and place it in any cell you choose.
Using GETPIVOTDATA, you can design a beautifully formatted dashboard with key performance indicators (KPIs) displayed prominently. These cells will update automatically whenever the underlying PivotTable refreshes, giving you the best of both worlds: the analytical power of PivotTables and the polished, professional look of a custom report. This is how you connect your automated back-end to a presentation-ready front-end.
Choosing Your Automation Engine
You have now established a solid data pipeline and a dynamic report template. The next step is to make it all run automatically. This involves selecting an "automation engine"—the tool that will initiate the entire process, either on a set schedule or with a single click.
Choosing the right engine is crucial. The tool must match the task. We will examine three excellent options: the classic reliability of VBA, the cloud-based power of Power Automate, and the transformative potential of modern AI assistants.
Deep In-Workbook Control with VBA
Visual Basic for Applications (VBA) is Excel's native programming language and has been the go-to solution for complex automation inside a workbook for decades. If you need precise control over formatting, manipulating sheets, or executing custom logic, VBA is the most powerful tool for the job.
Think of it as providing Excel with a detailed set of instructions. For example, after your Power Query data refreshes, a VBA script could:
- Loop through specific worksheets and apply custom colors or borders based on cell values.
- Automatically generate and save separate PDF copies of the report for different departments.
- Execute complex calculations or custom functions that are beyond the scope of standard formulas.
VBA is ideal for tasks that are entirely self-contained within your workbook. Its main limitation is that it does not easily integrate with other applications or cloud services without advanced coding.
Connecting Excel to the Cloud with Power Automate
While VBA excels at internal tasks, Power Automate is the master of external workflows. It is a cloud-based service designed to connect different applications and services, with Excel as a key component. If your automation process needs to interact with anything outside the spreadsheet itself—such as sending an email, saving a file to SharePoint, or posting a message in Teams—Power Automate is the solution.
It operates on a simple, visual, "if this happens, then do that" logic. You could easily create a flow that:
- Triggers every Monday at 9:00 AM.
- Runs a script to refresh your Excel file stored in SharePoint.
- Converts the "Summary" tab into a PDF.
- Attaches that PDF to an email and sends it to your management team.
The major advantage is that this entire process runs in the cloud, so your computer does not need to be on. For scheduling and report distribution, Power Automate's power and simplicity are hard to beat.
Lowering the Barrier with AI Assistants
The most significant recent development in automation is the emergence of AI. The landscape of Excel automation over at sparkco.ai has been completely reshaped by artificial intelligence, transforming Excel from a simple spreadsheet into a powerful data analytics hub. Microsoft's own AI features now offer smart recommendations and automate tasks directly within Excel, reducing manual work and improving analytical precision.
For many users, the biggest obstacle to automation has always been coding. AI-powered tools like Elyx.AI are changing this by acting as a translator. Instead of learning VBA syntax, you can simply describe your needs in plain English.
Think of AI as your personal developer. You provide the logic, and it writes the code. This makes complex automation accessible to everyone, not just those with a programming background.
For example, you could ask an AI assistant: "Write me a VBA script that unhides the 'Details' worksheet, refreshes all the data, and then hides the sheet again." The AI will generate the precise code required. You can then copy and paste it directly into the VBA editor. This combination is incredibly powerful, offering the deep control of VBA without the steep learning curve.
Making the Right Choice for Your Report
So, which engine is right for you? The answer often depends on the specific task, and sometimes a combination of tools is the best approach. Here’s a simple guide to help you decide:
| Automation Engine | Best For… | Real-World Scenario |
|---|---|---|
| VBA Macros | Complex tasks inside the Excel file, like custom formatting, looping through sheets, or running unique calculations post-refresh. | A script that automatically formats a sales table, adding borders and conditional colors based on performance after the data has been updated. |
| Power Automate | Workflows that connect Excel to other applications and services, especially for scheduling and distributing reports. | An automated flow that refreshes an Excel file in OneDrive every morning, saves a copy to a SharePoint archive, and posts a message in Teams. |
| AI Assistants (Elyx.AI) | Generating the code for VBA or Power Automate when you're not a developer. It's your bridge to more advanced automation. | You need a VBA script to email the report but don't know how to code. You ask the AI to write it for you, then use that script in your workbook. |
Ultimately, these tools are complementary, not competitive. A truly robust automation setup might use a Power Automate flow to refresh a file, which in turn triggers a VBA macro inside the file to handle final formatting—a macro that an AI assistant helped you write. By understanding the strengths of each engine, you can build a hands-free reporting system that is both powerful and perfectly tailored to your needs.
Make Your Reports Run Themselves with Smart Scheduling and Distribution
You've built the engine; now it's time to make your report run and deliver itself completely autonomously. This is the final step in transitioning from a manual process to a truly automated system. The goal is to create a reliable, hands-free workflow that delivers insights to the right people at the right time, without requiring any manual intervention.
For this, we turn to workflow automation tools. If you are working in a cloud-based environment, a tool like Power Automate is a game-changer. It is designed to connect different cloud services, which is ideal for modern reporting setups where files are stored on SharePoint or OneDrive.

Cloud-Based Delivery with Power Automate
Let's walk through a common scenario. You have a sales report stored in a SharePoint folder. The objective is to have it refresh automatically at 8:00 AM every morning, convert the main dashboard tab into a PDF, and then email it to the management team.
Here's how you would build that flow in Power Automate:
- The Trigger: Start with a "Recurrence" trigger. You simply configure it to run daily at a specific time, such as 8:00 AM.
- The Refresh: Next, add an action to "Run a script" on your Excel file. This script is typically a single line of code that instructs Excel to refresh all data connections, which in turn executes your entire Power Query process.
- The Conversion: After allowing a moment for the refresh to complete, use a "Convert File" action to turn your "Summary" worksheet into a clean PDF.
- The Delivery: Finally, use the Outlook connector's "Send an email (V2)" action. You can enhance this step by adding the current date to the subject line and attaching the PDF created in the previous step.
The key benefit here is that the entire process runs in the cloud. Your computer can be off, or you can be on vacation—the workflow will still execute as scheduled. It's a robust solution for any team using the Microsoft 365 ecosystem.
On-Premise Automation with Windows Task Scheduler
But what if your report must reside on a local machine or a secure network drive? In that case, the classic solution is Windows Task Scheduler. It is built into the Windows operating system and is incredibly reliable for running scheduled tasks.
To make this work, you will need a small VBScript file to act as an intermediary. This script's sole purpose is to open your Excel file, trigger the refresh macro you've built, and then save and close the workbook.
Once the script is saved, you simply point Task Scheduler to it and set the schedule. It is a fantastic, no-cost method for automating reports that cannot be stored in the cloud. This approach is particularly useful for sensitive documents like financial reports, which are often stored on secure internal servers. If this applies to your situation, our guide on financial reporting automation offers more specific tips.
Best Practices for a Bulletproof System
Setting up the schedule is the easy part. The real challenge is ensuring it runs reliably without constant monitoring.
The true measure of successful automation isn't just that it works. It's that you can completely forget it's running. It should be so dependable that you only become aware of it if something goes wrong.
To achieve this level of reliability, adhere to a few fundamental principles:
- Centralize Everything: Never automate a report located on your personal C: drive. Always use a shared, accessible location like SharePoint, OneDrive, or a dedicated network folder. This single practice prevents the entire process from failing when you are out of the office.
- Plan for Failure: What happens if a data source is temporarily unavailable? Your workflow should be designed to handle such situations. In Power Automate, you can add a step that sends you a notification only if a preceding step fails.
- Keep It Simple: It can be tempting to build a complex workflow that performs many different tasks. Avoid this. The more components you add, the more potential points of failure. Focus on a clean, logical process that does one job and does it perfectly.
This isn't just about convenience; it's about staying current. By mastering these scheduling and distribution techniques now, you are not just saving a few hours—you are aligning your skills with the future of how business gets done.
Common Questions About Excel Automation
As you begin to automate your Excel reports, you will likely encounter a few common questions and challenges. This is a normal part of the learning process. You might wonder if you're using the right tool or worry about potential pitfalls. This section addresses these frequent hurdles with clear, practical answers to help you maintain momentum.
Consider this a quick reference guide for overcoming the problems that can stall your progress. With the right information, these challenges become minor obstacles rather than major roadblocks.
Can I Automate Reports with Web or Database Data?
Absolutely. Many people assume automation is limited to local files like CSVs or other Excel workbooks, but this is a misconception. You can certainly automate reports where the data resides in external sources, and Power Query is specifically designed for this purpose.
It includes a vast library of connectors designed to pull data directly from various sources, including:
- SQL Databases: Connect directly to your company's main database to access live, up-to-the-minute information.
- Websites: Need to track competitor pricing or market data? You can scrape data directly from tables on public web pages.
- SharePoint Lists: Easily integrate data from your internal team sites for project tracking or operational reporting.
The process is nearly identical to working with local files. You establish the connection once, apply your cleaning and transformation steps, and Power Query saves the entire sequence. From that point on, your automated refresh will pull the latest data directly from the live source.
VBA vs. Power Automate: What’s the Real Difference?
This distinction often causes confusion, but it is quite straightforward. The simplest way to understand it is by location: VBA operates inside an Excel workbook, while Power Automate operates outside of it, connecting Excel to other cloud services.
Choose VBA for tasks that are entirely self-contained within your spreadsheet. This includes applying complex conditional formatting after a data refresh, creating custom functions, or looping through worksheets to hide them based on specific criteria. It provides deep, granular control over the workbook itself.
Conversely, choose Power Automate when your workflow needs to interact with other applications. If you need to save your refreshed report to SharePoint, email a PDF version via Outlook, or post a "report is ready" notification in Microsoft Teams, Power Automate is the appropriate tool. It excels at orchestrating actions across different platforms.
How AI Helps Non-Coders with Automation
This is where automation becomes truly accessible, especially for those without a development background. AI acts as a powerful translator. For a long time, sophisticated automation was inaccessible without learning a programming language like VBA. AI assistants are dismantling that barrier.
Instead of struggling with syntax and debugging code, you can now describe what you want to achieve in plain English. For example, you could ask an AI assistant like Elyx.AI: "Write a VBA script that refreshes all data connections, saves the 'Dashboard' sheet as a PDF named with today's date, and then closes the workbook without saving changes."
The AI will generate the precise code to accomplish the task. This opens the door to advanced, custom automation for any Excel user, regardless of their coding expertise. It's like having a developer on call to build whatever you need, exactly when you need it.
The true value of AI in Excel isn't just speed; it's accessibility. It empowers subject-matter experts—the people who truly understand the data—to build their own automation solutions without needing to become programmers.
What Are the Most Common Mistakes to Avoid?
In my experience, knowing what not to do is just as important as knowing what to do. A few common mistakes can derail most automation projects, so be mindful of the following:
- Hardcoding File Paths: Never point your queries to a file on your personal desktop (e.g.,
C:\Users\YourName\Desktop\report.csv). The moment you are on vacation or that file is moved, the entire process will break. Always use a shared, central location like SharePoint or a network drive. - Ignoring Source Data Changes: Your automation is only as stable as the data it depends on. If someone renames a column in the source file, your Power Query refresh will fail. Implement error handling or, better yet, maintain clear communication with the owners of the source data.
- Building Overly Complex Solutions: It is tempting to create a single, massive query that does everything. Avoid this. These monolithic queries become slow and are a nightmare to troubleshoot. Instead, break your logic into smaller, more manageable queries that are easier to maintain and update.
- Forgetting About Data Security: When reports are distributed automatically, it is easy to lose track of who is viewing what. Be extremely careful with sensitive information and double-check your distribution lists to ensure data is only sent to authorized individuals.
By keeping these common issues in mind from the beginning, you can design a much more robust and reliable system for your automated reports.
Ready to eliminate manual data entry and bring intelligent automation directly into your spreadsheets? Elyx.AI is an AI-powered Excel add-in that lets you clean data, generate formulas, and create pivot tables using simple, natural language prompts. Stop wrestling with tedious tasks and start getting insights faster. Learn more and get started at https://getelyxai.com.
Reading Excel tutorials to save time?
What if an AI did the work for you?
Describe what you need, Elyx executes it in Excel.
Sign up