Master How to use excel as database in 2026

If you're trying to reconcile sales, customers, invoices, or project records across a pile of workbooks, you're already treating Excel like a database. The problem usually isn't Excel itself. The problem is that most files are built like scratchpads, not systems.
A finance analyst gets one export from the ERP, another from a CRM, and a third from a manually maintained tracker. Dates don't match. Customer names vary. Product IDs disappear in one file and reappear with spaces in another. At that point, the question isn't whether you should use Excel as a database. It's whether you can do it with enough structure that the file stays usable next month.
You can. But only within a clear boundary.
Spending too much time on Excel?
Elyx AI generates your formulas and automates your tasks in seconds.
Sign up →Why You Should Use Excel as a Database in 2026
Excel is still one of the fastest ways to build a usable data workflow without asking for IT support, database admin time, or a new app budget. That's why so many teams keep coming back to it, even after hearing for years that “Excel is not a database.”
That warning is partly right and partly lazy. Excel is a bad enterprise database. It can still be a very practical mini database for small to medium data work when the file is structured properly.

Excel supports database-like work up to its 1,048,576-row limit, which makes it viable for mid-sized use cases such as monthly sales tracking. Performance can degrade beyond a few hundred thousand records, so the file design matters from the start, as noted in this discussion of Excel as a database pros and cons.
What makes a spreadsheet behave like a database
A normal spreadsheet is a flexible grid. A database-style workbook is stricter.
It has:
- One table per subject like Customers, Orders, Products, or Regions
- One row per record
- One column per field
- Consistent IDs that let tables connect
- Controlled inputs so users can't type anything they want
That difference changes everything. Filtering becomes reliable. Lookups stop breaking. PivotTables make sense. Power Query can combine sources without heroic cleanup.
Practical rule: If you want to use Excel as a database, stop designing for appearance first and design for records first.
Why Excel still wins for many teams
For a lot of operations, finance, and analyst work, the practical choice isn't “Excel or SQL Server.” It's “Excel or chaos.”
Excel wins when you need something people can open, inspect, edit, and understand quickly. It also works well as the final reporting surface, even when data comes from other systems. If you're collecting raw inputs from forms, surveys, or distributed teams, a guide to top data collection platforms can help upstream quality before the data ever lands in Excel.
Use Excel as a database when the job is operational, visible, and moderately sized. Don't use it when you need deep permissions, heavy concurrency, or massive scale. That line matters.
The 3 Rules for Designing Your Excel Database Tables
Most Excel database problems start long before analysis. They start in the table layout.
If the file has merged cells, blank spacer rows, repeated headers, mixed date formats, and no stable ID, you don't have a database table. You have a report pretending to be raw data.

A reliable setup starts with disciplined tabular design. If you want a deeper primer before building, this guide on how to organize data in Excel is a useful companion.
Rule 1 Keep one record per row and one field per column
This is the foundation.
A proper Orders table should look like this:
| OrderID | OrderDate | CustomerID | ProductID | Quantity | Region |
|---|---|---|---|---|---|
| O-1001 | 01/05/2026 | C-204 | P-19 | 3 | North |
A bad version usually looks like this:
- Order number and date in the same cell
- Customer name split across two rows
- Region shown as a merged title above several records
- Blank rows inserted to “make it readable”
Excel Tables fix a lot of this. Select the range and press Ctrl+T. Once the range becomes a table, filters, structured references, and consistent formulas become much easier to manage.
Clean headers matter. Keep a single header row, avoid merged cells, and give each column a plain business name.
Rule 2 Define data types before users start typing
Database systems force types. Excel doesn't. That freedom is why files get messy.
If one person enters 1/5/26, another enters January 5, and another types TBD, your date field isn't a date field anymore. It's a mixed column that will break sorting, grouping, and imports.
Use these checks early:
- Dates: Format the whole column as Date before entry starts
- Amounts: Use Number or Currency consistently
- Codes: Keep IDs as text if leading zeros matter
- Booleans: Use controlled values like Yes/No instead of free text
A common example is a CustomerID like 000245. If Excel converts that to 245, you've lost the original key format. That's hard to reverse once files spread across teams.
Later, when you build a PivotTable, create relationships, or load data into Power Query, typed columns save hours of cleanup.
Here's a useful walkthrough before you move on to the next rule:
Rule 3 Every table needs a unique ID
If two customers share the same name, names can't be your key. If product descriptions change over time, descriptions can't be your key either.
Each table needs a unique identifier:
- Customers table uses
CustomerID - Products table uses
ProductID - Orders table uses
OrderID
That ID lets Excel mimic the relationship logic you expect from a database.
For example:
| CustomerID | CustomerName |
|---|---|
| C-204 | Northwind Retail |
Then in the Orders table:
| OrderID | CustomerID | Quantity |
|---|---|---|
| O-1001 | C-204 | 3 |
Now you can connect records reliably without matching on fragile text labels.
If a table doesn't have a stable key, create one before you build anything else. Otherwise every downstream lookup becomes guesswork.
5 Techniques for Enforcing Data Integrity
A good table can still fall apart once multiple people start editing it. Data integrity in Excel isn't automatic. You have to build guardrails.
The upside is that the best controls are simple. You don't need VBA to make a workbook much safer.
1 Use Data Validation for controlled entry
Data Validation is the fastest way to block bad inputs.
For a Region column, create a list such as North, South, East, West. Then apply Data > Data Validation > List. Users get a dropdown instead of a blank cell.
For dates, you can restrict entries to valid calendar values. For IDs, you can use a custom rule.
Example formula for a required OrderID pattern that begins with O-:
=LEFT(A2,2)="O-"
How it works:
- LEFT(A2,2) takes the first two characters from cell A2
- It compares them to "O-"
- If the result is TRUE, Excel accepts the value
- If it's FALSE, Excel blocks the entry
That doesn't create a perfect database constraint, but it prevents a lot of sloppy typing.
2 Use forms for safer input
Direct table editing is fast, but it invites mistakes. A simple entry form gives users one record at a time and reduces accidental overwrites.
In practice, this works well when one person maintains a tracker for orders, assets, or customer updates. Put the form on a separate sheet. Lock the raw table. Then add only the fields that should be edited.
Broader Pratt Solutions expertise on data quality frameworks is helpful. The key lesson applies directly in Excel. Good data quality comes from process design, not cleanup after the damage is done.
3 Remove duplicates deliberately
Don't wait until month-end to find duplicate records.
Use Data > Remove Duplicates only after deciding what defines a duplicate. Two rows with the same customer name may be valid. Two rows with the same OrderID often are not.
If you need a practical method, this guide on how to identify duplicates in Excel walks through the options.
A safer workflow is:
- Copy the raw data to a working sheet
- Highlight duplicates first
- Review duplicate logic by key columns
- Remove only confirmed duplicate records
Duplicates are rarely a tool problem. They're usually a definition problem.
4 Protect formulas and structure
Users usually don't mean to break a file. They just click into the wrong cell.
Lock cells that contain formulas, helper columns, lookup tables, and validation lists. Then protect the sheet while leaving input areas editable. This matters a lot in shared operational workbooks where people update records quickly.
At minimum, protect:
- Formula columns that calculate totals or statuses
- Reference sheets used for dropdown lists
- Headers and table structure
- Power Query output sheets if they refresh from source data
5 Use AI for repetitive cleaning passes
Excel's built-in tools handle one issue at a time. Real files often need several fixes at once.
An AI assistant inside Excel can help with tasks like standardizing state abbreviations, spotting mixed date formats, identifying likely duplicate records, or preparing a clean summary from several messy tabs. The value isn't magic. It's speed and consistency across repetitive cleanup work.
I still review the results. You should too. But for first-pass cleaning, AI can remove a lot of the mechanical effort that usually burns analyst time.
4 Powerful Ways to Query and Analyze Your Data
Once the tables are clean, Excel becomes much more than storage. It becomes a query tool.
The right method depends on the question you're asking. Some jobs need only a filter. Others need joins across tables. Others need repeatable transformation logic.
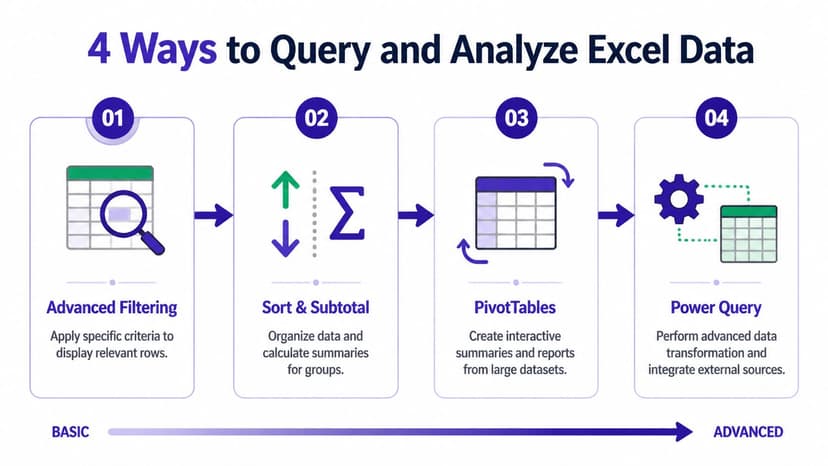
1 Start with filtering and sorting
This is the simplest query layer, and it handles more work than people admit.
If your Sales table is structured properly, you can filter Region to North, sort by OrderDate, and isolate the rows you need in seconds. Add Subtotal after sorting and Excel will calculate grouped summaries for visible sections.
Use this when:
- You need a quick answer
- The question is one-dimensional
- You don't need a reusable pipeline
It's manual, but it's transparent. Anyone looking at the file can follow what happened.
2 Use XLOOKUP for table-to-table retrieval
When you need Excel to behave like a relational database, lookups are the first bridge.
Example formula:
=XLOOKUP([@ProductID], Products[ProductID], Products[ProductName], "Not Found")
What this does:
- [@ProductID] takes the ProductID in the current row
- Products[ProductID] is the lookup column in the Products table
- Products[ProductName] is the return column
- "Not Found" handles missing matches cleanly
This is the Excel equivalent of pulling a field from a related table. It's cleaner than VLOOKUP because the return column doesn't have to sit to the right, and the formula is easier to read later.
For reporting, that often pairs well with a PivotTable. If you need a refresher, this article on how to create a pivot table covers the setup clearly.
Use XLOOKUP to enrich a table. Use Power Query when the joining logic becomes repetitive or spans multiple files.
3 Move to Power Query for repeatable joins and cleanup
Power Query is where Excel stops acting like a smart sheet and starts acting like a lightweight data pipeline.
It lets you:
- Import from other workbooks, CSVs, folders, and databases
- Rename columns consistently
- Split fields
- Change data types
- Merge tables
- Append monthly files
- Refresh the whole process later
This matters when you're receiving exports every week or month. Instead of redoing cleanup steps manually, you create the transformation once and refresh it.
A common example is combining Sales_Jan.xlsx, Sales_Feb.xlsx, and Sales_Mar.xlsx, then merging that result with a Customers table. In manual Excel, that's tedious. In Power Query, it's a maintainable process.
4 Use SQL when Excel is the file but not the interface
If you want to query Excel as if it were a database table, SQL through OLE DB is a practical option.
The connection string uses Provider=Microsoft.ACE.OLEDB.12.0, and a query like SELECT * FROM [Sheet1$] treats the worksheet as a table. For filtering large datasets, this method is reported as 2-5x faster than VBA loops in the source on querying Excel through OLE DB.
A simple example:
SELECT * FROM [Sales$] WHERE [Region] = 'North'
Use this when:
| Method | Best for | Weak spot |
|---|---|---|
| Filter and Sort | Quick manual inspection | Hard to repeat consistently |
| XLOOKUP | Pulling fields between tables | Gets messy across many joins |
| Power Query | Repeatable transformation | Extra setup at first |
| SQL via OLE DB | Programmatic querying | More technical and less native for everyday users |
If you're using Excel as a database for business work, this progression is the practical ladder. Start simple. Move up only when the complexity justifies it.
3 AI Workflows to Automate Your Excel Database Tasks
The traditional objection to Excel has never been that it can't hold structured data. The actual objection is that maintaining quality takes too much manual work.
That's where AI changes the equation. Used well, it doesn't replace judgment. It replaces repetitive mechanics.

Modern AI add-ins for Excel can handle complex queries, data modeling, and formatting autonomously, and some users report saving over 3 hours per week. Privacy-first setups using AES-256 encryption also address common security concerns, as described in this review of whether Excel can work as a database with modern AI tooling.
Workflow 1 Clean a messy workbook from a plain-language prompt
A common task looks like this:
- Remove duplicates based on
OrderID - Standardize region names
- Convert all dates to one format
- Flag blank customer IDs
An AI tool inside Excel can run those actions from a single request instead of making you click through five menus and build helper columns. That's valuable when the file changes every week but the cleanup logic stays roughly the same.
Workflow 2 Build a report across multiple sheets
Manual reporting usually means joining Sales, Customers, and Products, then building a summary table and chart. That process is straightforward for an experienced analyst and slow for everyone else.
AI can shorten that gap. If the workbook contains separate tables, the tool can identify likely keys, join the data, summarize it, and prepare a report layout. If your source data starts outside Excel, tools like a markdown api can also help structure web content before it reaches your workbook.
A practical next step is learning how an AI agent for data analysis fits into that workflow.
Good AI use in Excel isn't about asking for a formula explanation. It's about asking for a finished task.
Workflow 3 Detect patterns without building the full model yourself
Trend checks, category outliers, unusual regional shifts, and missing relationships often require several intermediate steps. Analysts can do that manually. It just takes time.
AI helps by scanning the workbook and surfacing likely anomalies, comparison views, and summary outputs faster than a manual pass. You still decide whether the result is meaningful. But you no longer have to do every setup action by hand.
AI makes Excel more viable for non-technical users. It lowers the operating friction that used to make structured Excel files collapse under their own maintenance burden.
The 3 Signals You've Outgrown Excel And What's Next
Plenty of teams leave Excel too early. Plenty leave too late. The better move is knowing the warning signs.
One useful middle ground often gets missed. For teams managing 10K-500K records, hybrid Excel-database setups can solve the immediate problem without forcing a full migration, as noted in this discussion of hybrid Excel-database architectures.
Signal 1 The workbook is slow all the time
If the file opens slowly, recalculates constantly, or crashes during refresh, you've hit a practical limit.
That doesn't always mean “move everything to SQL Server tomorrow.” Sometimes it means pushing raw transformations into Power Query, reducing formula-heavy sheets, or splitting storage from reporting. But if every monthly cycle feels fragile, Excel is telling you the design is no longer comfortable.
Signal 2 Multiple people need live editing on core data
Excel is weak when several users need to edit the same operational dataset at once with full control and no version confusion.
If your team keeps producing files called Final_v2_REAL_Final, the process has already outgrown a workbook-first model. At that point, the master data should probably live in a system designed for concurrency.
Shared reporting in Excel is fine. Shared record maintenance at scale is where things start breaking.
Signal 3 You need stronger security and audit control
Once the file contains sensitive business data, approval logic, role-based access needs, or a serious audit trail requirement, a workbook becomes a risky container.
Excel can still sit at the reporting edge. It just shouldn't remain the primary system of record.
A broader explanation of process failure often starts earlier than the tool choice. This piece on why business intelligence projects fail is worth reading if your reporting stack keeps becoming harder to trust.
Excel vs. Access vs. SQL Server
| Feature | Excel | Microsoft Access | SQL Server |
|---|---|---|---|
| Best fit | Analyst-driven tracking and reporting | Structured desktop database workflows | Enterprise data storage and multi-user systems |
| Data model | Tables, formulas, Power Query, Data Model | Relational database | Relational database |
| Ease of use | Highest for most business users | Moderate | Lower for non-technical users |
| Concurrent editing | Limited | Better than Excel in database scenarios | Built for it |
| Security depth | Basic compared with database systems | Better structure than workbook files | Strongest of the three |
| Typical next step | Stay if the workflow is stable | Upgrade if you need more structure without enterprise infrastructure | Upgrade if scale, security, or concurrency are core needs |
Excel is excellent when the dataset and process are controlled. Access is a logical next step for desktop relational work. SQL Server is the serious move when the data and collaboration demands stop fitting inside a file.
If you want Excel to stop feeling like manual labor, Elyx AI is built for exactly that gap. It works inside Excel, takes plain-language requests, and executes full workflows like cleaning messy tables, building pivot reports, generating charts, and formatting outputs without forcing you to do each step yourself. If your team spends more time operating spreadsheets than analyzing them, it's worth trying.
Reading Excel tutorials to save time?
What if an AI did the work for you?
Describe what you need, Elyx executes it in Excel.
Sign up