9 Steps to Master Excel AI Financial Modelling

If you've spent any time in finance, you know the drill. Financial modeling often means wrestling with complex formulas, chasing down broken links, and spending hours on tedious tasks that have little to do with actual analysis.
But what if your spreadsheet could do more than just calculate? What if it could become an active partner in your work? That's exactly what's happening now with AI tools built directly for Excel. This isn't about replacing spreadsheets; it's about making them smarter.
3 Reasons the Future of Finance Is AI in Your Spreadsheet

Spending too much time on Excel?
Elyx AI generates your formulas and automates your tasks in seconds.
Sign up →For years, Excel has been the go-to tool for finance professionals. It's powerful, flexible, and familiar. But let's be honest—its manual nature can be a major bottleneck. How many hours have you lost cleaning up messy data, consolidating dozens of reports, or just formatting a presentation?
Every minute spent on that kind of repetitive work is a minute not spent on strategy. It's also an opportunity for human error to creep in. We've all been there: one tiny mistake in a formula can throw off an entire forecast, leading to costly corrections and a loss of confidence.
This is where integrating artificial intelligence into your spreadsheet changes everything. Imagine just telling Excel what you need in plain English—"Combine these 15 CSV files, clean up the date column, and build a summary dashboard"—and watching it happen in seconds. This isn't science fiction anymore; it’s what modern AI add-ins can do right now.
How AI Elevates Your Financial Modelling in 3 Key Ways
An AI assistant doesn't replace your financial expertise; it amplifies it. By taking over the tedious, mechanical parts of the job, it frees you up to do what you do best: think critically, challenge assumptions, and provide real strategic insights.
The benefits are immediate and tangible:
- 1. Massive Time Savings: You can automate tasks that used to eat up your day, like data consolidation, cleaning inconsistent entries, or building an entire three-statement model from raw data.
- 2. Fewer Costly Errors: AI can systematically run checks and balances—like making sure your balance sheet actually balances—to catch mistakes before they become problems.
- 3. A Shift to Strategic Work: Instead of being a data operator, you can focus on the bigger picture, run more scenarios, and deliver the kind of high-value advice that leadership needs.
This shift is about moving from being a data mechanic to a true strategic advisor. You guide the AI with your expertise, and the AI handles the heavy lifting, creating a powerful partnership that delivers better, faster results.
In this guide, we’ll get practical and show you exactly how to master Excel AI financial modelling. We'll move beyond theory and dive into real-world workflows, using an AI agent to solve the kind of problems you face every day. To see what a top-tier tool can do, check out our deep dive on a powerful Excel AI add-in.
By the end, you'll have a clear path to building more accurate and insightful financial models in a fraction of the time.
3 AI-Powered Steps to Prepare Your Data Foundation
Ask any financial analyst where they spend most of their time, and they probably won't say it's crafting brilliant strategies. The honest answer? Data preparation. It's the unglamorous, often grueling process of gathering, cleaning, and organizing data before the real work can even start.
This is where most financial models break. It's not a secret that manual data entry is a minefield of errors. In fact, research shows a staggering 88% of spreadsheets used for financial modeling contain significant mistakes, ranging from busted formulas to simple typos. When your foundation is flawed, the entire forecast is at risk. That's why getting your data prep right isn't just a time-saver; it's essential for building an excel ai financial model you can actually trust.
1. Ditch the Copy-Paste: Automate Data Consolidation
The first headache is always just getting all your data in one place. You've got sales figures in a handful of CSVs, historical P&Ls in a separate workbook, and your budget notes tucked away on another sheet. The old way of doing this—manually copying and pasting—is not only slow but practically invites errors.
This is a perfect job for an AI assistant like ElyxAI. Instead of wrestling with different files, you can just tell it what to do in plain English.
Example Prompt: "Merge the data from 'Sales_Q1.csv', 'Sales_Q2.csv', and the 'P&L_History' tab into a single table. Match records using the 'Date' and 'Region' columns."
The AI gets to work, finding your sources and pulling everything together in seconds. It’s smart enough to line up the headers and columns, leaving you with one clean, unified dataset. A solid starting point always begins with good data ingestion, so knowing the best practices for importing CSV files is a key skill, even when an AI is doing the heavy lifting.
2. Clean and Standardize Data with 3 Simple Commands
Once your data is all in one place, you'll notice it’s a mess. That’s normal. You'll find duplicate entries, empty cells where there shouldn't be, and wildly inconsistent date formats (like "01/05/2024," "May 1, 2024," and "2024-05-01" all in the same column).
Fixing this by hand with a bunch of TRIM, IFERROR, and DATEVALUE formulas can take hours. With AI, you can skip the complex formulas and just state your goal.
Here are a few prompts I use all the time:
- To handle duplicates: "Find and remove any duplicate rows based on the 'Invoice ID' column."
- To fill in gaps: "In the 'Revenue' column, fill all empty cells with the column's average value."
- To fix formatting: "Standardize the 'Transaction Date' column to a 'MM/DD/YYYY' format."
This doesn't just save a massive amount of time; it enforces consistency, which is the bedrock of a reliable model. If you want to get a better handle on the theory behind these tasks, our guide on the fundamentals of data preprocessing is a great resource.
3. Structure Your Data for a Bulletproof Model
The last piece of the prep work is giving your clean data a proper structure. Turning your data into a formatted Excel Table is crucial. It’s what makes your model dynamic, allowing formulas and charts to update automatically as new information flows in.
Instead of manually creating a table and then painstakingly setting the data type for each column, you can have an AI agent do it instantly.
Example Prompt: "Convert the range A1:G500 into an Excel Table named 'FinancialData'. Make sure the 'Revenue' and 'COGS' columns are formatted as currency and the 'Date' column is a Short Date."
With one command, the AI builds the table and applies the correct formats. This guarantees that your calculations will work as expected and gives your model a professional, organized structure from the very beginning. You’ve just turned a messy sheet into an audit-ready foundation for your analysis.
7 Top-Tier AI Strategies for Automating Model Construction
So, you’ve cleaned up your data. Now comes the real heavy lifting: building the financial model’s core structure. This is where you translate business logic into a web of interconnected formulas, and it’s traditionally the most painstaking part of the entire process.
This is exactly where an AI assistant shifts from being helpful to being your partner. Forget about manually punching in complex formulas. With the right prompts, you can simply describe what you need, and the AI will generate the calculations. This approach to excel ai financial modelling doesn't just save time; it dramatically cuts down on the risk of human error.
1. Centralize Your Assumptions with an AI-Built Hub
Any solid financial model is built on a dedicated assumptions sheet. It's the control panel for all your key drivers—revenue growth, inflation rates, tax percentages, you name it. A well-organized assumption sheet is non-negotiable because it stops you from hard-coding numbers directly into formulas, which is a classic, error-prone shortcut.
Instead of building it from scratch, you can have an AI agent set it up for you in seconds.
Example Prompt: "Create an assumption sheet. Include sections for Revenue Assumptions with a 5% annual growth rate, Operating Expenses with a 3% inflation rate, and a Corporate Tax Rate of 21%."
Just like that, you get a clean, clearly labeled sheet. This makes your model transparent and incredibly easy to update down the road.
2. Build the 3 Core Financial Statements
With your assumptions ready, it’s time to construct the big three: the Income Statement, Balance Sheet, and Cash Flow Statement. The magic is in how they link together, and AI can help generate the formulas for each line item based on your instructions.
For example, once your revenue projections are in, you can simply tell the AI what to do next.
ElyxAI Prompt Example: "In the Income Statement, calculate Gross Profit in cell C5 by subtracting COGS in cell C4 from Total Revenue in cell C3."
This conversational method breaks a massive task into a series of small, logical steps, making sure every calculation lands exactly where it should.
3. Generate Complex Calculations from Plain English
Let's be honest—one of the biggest pains in financial modeling is remembering the exact syntax for Excel's countless functions. AI completely removes this mental block. For example, to calculate a conditional sum without AI, you'd need the SUMIFS function:=SUMIFS(sum_range, criteria_range1, criteria1, [criteria_range2, criteria2], ...)
Explanation:
sum_range: The range of cells to sum.criteria_range1: The range to check againstcriteria1.criteria1: The condition to apply tocriteria_range1.
With an AI tool, you can simply ask for the result in everyday language. This skill is invaluable and you can learn more from an Excel AI formula generator.
4. Construct Supporting Schedules for Debt and Depreciation
Truly detailed models need supporting schedules for things like debt repayment and asset depreciation. These mini-ledgers feed crucial numbers into your main statements and can be a headache to build manually. AI automates this beautifully.
- Debt Schedule: Just ask the AI to create a schedule that models interest and principal payments over the life of a loan.
- Depreciation Schedule: Instruct it to build a depreciation table for your fixed assets using a method like straight-line.
After the schedules are built, a final prompt ties it all together: "Link the interest expense from the debt schedule to the Income Statement and the ending debt balance to the Balance Sheet."
5. Seamlessly Integrate All 3 Model Components
A financial model is a living thing where everything is connected. Net income from the P&L flows to the cash flow statement and balance sheet. Debt and cash balances must reconcile across statements. Keeping these links intact is absolutely critical.
AI acts as your continuity checker. By giving clear commands, you ensure all your schedules and statements are properly wired together. This prevents the dreaded #REF! error and guarantees that a change in one assumption, like revenue growth, ripples correctly through the entire model.
6. Validate Your Model with AI-Powered Error Checking
You’ve built the model. Now for the moment of truth: validation. The classic test is making sure the balance sheet actually balances (Assets = Liabilities + Equity). If it doesn't, hunting down the source of the discrepancy can be a maddening, needle-in-a-haystack exercise.
This is where AI becomes an invaluable safety net.
Validation Prompt: "Check if the Balance Sheet is balanced for all periods. If not, highlight the cells where Total Assets does not equal Total Liabilities + Equity and identify the difference."
A single prompt like this can save you hours of debugging, pointing you directly to the problem so you can fix it and move on.
7. Visualize Your Data Preparation Workflow in 3 Steps
Before you can even begin building, your AI needs clean, structured data to work with. The groundwork laid during data prep is what makes the automated model construction possible. The process generally follows a simple three-step flow: consolidating scattered files, cleaning up inconsistencies, and structuring everything into a usable format.
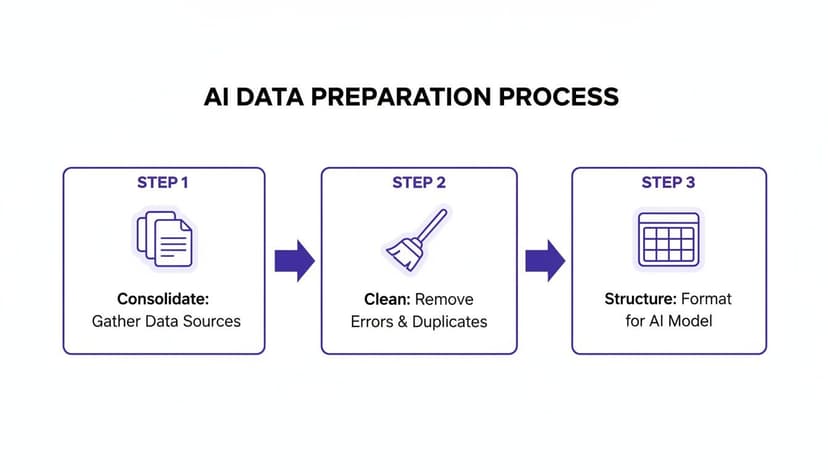
Think of it as the foundation. This automated prep work ensures the data feeding your model is reliable from the very start—and in financial modeling, a solid foundation is everything.
3 Advanced AI Techniques to Power Your Forecasts

Once your financial model's structure is in place, the real work begins: forecasting. This is where an AI assistant becomes more than just a convenience; it transforms your excel ai financial modelling from a static spreadsheet into a dynamic tool for seeing the future. Instead of just projecting a straight line forward, AI can deliver far more nuanced and reliable predictions.
The demand for this level of insight is skyrocketing. The market for AI in financial forecasting is projected to swell by USD 147.52 billion between 2024 and 2029, growing at a blistering 32.7% compound annual growth rate. This isn't just about faster calculations; it's about gaining a genuine competitive edge through smarter predictions.
Instead of wrestling with complex statistical formulas yourself, you can now simply tell an AI agent to analyze your data and pick the best-fit model. This not only saves an incredible amount of time but also brings a level of statistical rigor that was once out of reach for many analysts.
1. Uncover Trends and Seasonality with AI
One of the most powerful things AI brings to forecasting in Excel is its ability to automatically spot hidden patterns in your historical data. We’ve all seen it: sales spike during the holidays, or maybe there's a predictable dip in the summer. Recognizing these seasonal shifts is absolutely critical for a credible forecast.
For example, the FORECAST.ETS function in Excel can handle seasonality, but its syntax is complex:=FORECAST.ETS(target_date, values, timeline, [seasonality], [data_completion], [aggregation])
Explanation:
target_date: The date for which you want to predict a value.values: The range of historical data.timeline: The range of historical dates.[seasonality]: An optional number indicating the length of the seasonal pattern.
Rather than mastering this, you can get a detailed projection with a simple, conversational prompt.
Example Prompt: "Analyze the 'Monthly Sales' column in the 'FinancialData' table. Identify the underlying trend and any seasonal patterns. Then, generate a 12-month forecast using an exponential smoothing model and plot it on a line chart alongside the historical data."
A single request like this replaces what used to be a complicated, multi-step statistical slog. The result? A defensible forecast in minutes, not hours.
2. Run Dynamic Scenarios in Seconds with 5 Examples
A static forecast is a good start, but business leaders need to understand the full spectrum of possibilities. That's where scenario analysis comes in—modeling Best Case, Base Case, and Worst Case outcomes. Anyone who has tried to manage this manually knows the headache of tangled formulas and version control nightmares.
An AI agent makes this process fluid and dynamic. You can instruct it to build scenarios instantly just by tweaking your key assumptions. To get the most out of this, it's vital to improve forecast accuracy by understanding which drivers matter most.
Here are 5 prompts I use to model different futures on the fly:
- "Create a 'Best Case' scenario by increasing the revenue growth rate on the assumption sheet to 8%."
- "Generate a 'Worst Case' scenario by setting the inflation rate to 5% and decreasing customer retention by 10%."
- "Run a sensitivity analysis on Net Profit by varying the revenue growth assumption from -5% to +15% in 1% increments. Display the results in a table."
- "Show me the impact on Free Cash Flow if our Cost of Goods Sold increases by 20%."
- "Duplicate the Base Case model and label it 'Acquisition Scenario,' then increase revenue by $2M annually starting next year."
Commands like these let you stress-test your model from every angle, giving stakeholders a crystal-clear picture of potential risks and rewards without all the manual rework. For more ideas, our guide on how to improve forecast accuracy offers some great strategies.
3. Find and Flag Outliers Before They Skew Your Model
Your forecast is only as good as the historical data it's built on. But what if that data has anomalies lurking within it? A simple data entry typo, a one-off bulk sale, or a supply chain hiccup can create an outlier that throws your entire prediction off course. Manually scrubbing data for these issues is tedious and, frankly, easy to get wrong.
This is where AI’s anomaly detection capability is a lifesaver. You can simply ask your AI assistant to scan a dataset and flag anything that falls way outside the norm. It’s like having an eagle-eyed auditor review your numbers.
Example Prompt: "In the 'DailyTransactions' column, identify any values that are more than three standard deviations from the mean. Highlight these cells in yellow and list them in a new sheet named 'Anomalies'."
Think of this as a final quality check before you publish your forecast. By finding and investigating these outliers, you can make an informed decision to either exclude or adjust for them, ensuring your predictions are built on a solid, representative foundation.
3 AI Steps for Creating Executive-Ready Reports

Let's be honest: even the most brilliant financial model is dead on arrival if the key takeaways are buried in a sea of numbers. The final, and arguably most important, step is turning that complex grid into a clear, persuasive story for decision-makers. This is where your analysis becomes action.
Building a good dashboard in Excel has always been a time-consuming craft. It involves hours of clicking, formatting, and carefully arranging every element. With an AI agent like ElyxAI, you can sidestep that entire manual grind. Your role shifts from being a chart-builder to a storyteller.
1. From Raw Data to Polished Dashboard in 1 Prompt
Picture this: your model is finished. You've got your historicals and a solid three-year forecast. Instead of blocking off the rest of your afternoon for report building, you give your AI a single, clear instruction.
Example Prompt: "Create a dashboard on a new sheet. Include a waterfall chart showing the change in cash flow from last year to this year. Add a combo chart comparing projected revenue vs. profit margin for the next 36 months. Finally, create a summary table of key KPIs for the base case scenario."
The AI gets to work, generating each visual and table exactly as you asked, and arranges them on a fresh sheet. What used to take dozens of clicks and formatting adjustments now happens in minutes, pulling directly from your data and eliminating copy-paste errors.
2. Create Key Visuals with 3 Simple Prompts
The real power of AI visualization is that it understands intent. You don't need to be an Excel charting guru who remembers the 12 clicks it takes to create a combo chart. You just need to know what story you want to tell.
Here are 3 ways to use simple language to create powerful visuals:
- For Cash Flow Analysis: "Create a waterfall chart based on the cash flow statement to show how starting cash is impacted by positive and negative movements."
- For Profitability Comparison: "Build a combo chart to show Revenue and Gross Margin Percentage over time."
- For Performance Tracking: "Generate a KPI table with Revenue Growth, EBITDA Margin, and Free Cash Flow."
This approach makes advanced visualizations accessible to everyone. You can experiment with different chart types to find the most impactful way to present an insight, without getting stuck on the technical "how-to." If you're looking to explore this further, our guide on Excel data visualization has a ton of great strategies.
3. Bridge the Final Gap with AI-Generated Narratives
A dashboard of charts is good, but a dashboard with a summary that explains what the charts actually mean is what drives decisions. This is where AI reporting really shines.
After the AI builds your visuals, you can give it one last command to connect the dots.
Final Summary Prompt: "Write a brief, 3-sentence executive summary explaining the key trends shown in these charts. Focus on the projected revenue growth and its impact on profitability."
The AI analyzes the very data it just visualized and gives you a narrative draft. This text is an incredible starting point, instantly linking the numbers to the story. It’s that final touch that transforms a good report into a truly executive-ready deliverable.
Your New Role: 3 Ways AI Makes You a Strategic Analyst
After seeing what's possible, from cleaning up messy data to building polished reports, you might be wondering what this all means for your job. Let's get one thing straight: AI isn't here to replace financial analysts. It’s here to make you indispensable.
Think about all the time you've lost to mind-numbing, repetitive tasks. Hunting for that one broken formula, manually updating reports, or wrangling data from different sources. With AI tools like ElyxAI handling the grunt work, you get that time back. You're free to focus on what humans do best: thinking critically, challenging assumptions, and guiding business decisions with real conviction.
From Data Mechanic to Strategic Advisor
This is where your role fundamentally changes. You're no longer just the person who builds the model; you're the expert who interprets what it's telling you. It means less time being a "data mechanic" and more time being the strategic advisor management turns to for answers.
This isn't just a hypothetical shift—it's backed by real money. The financial modeling service market was valued at USD 2.67 billion in 2026 and is forecast to hit USD 4.34 billion by 2030. This explosive growth shows just how much companies are willing to pay for high-quality insights, not just number-crunching. You can explore the full data in this report on the expanding financial modeling market.
By adopting these AI-powered techniques, you are positioning yourself at the forefront of this industry shift. You become the human expert who guides powerful AI agents to achieve faster, more accurate results.
Embracing the Future of Finance in 3 Steps
The future of finance is a partnership. It’s your deep industry knowledge and critical thinking amplified by an AI’s incredible speed and precision. Imagine having an analyst on your team who can build a complex model from scratch in minutes, run a dozen scenarios before lunch, and never makes a copy-paste error. That's what this is.
Here’s what that partnership looks like in practice:
- 1. Move at the Speed of Business: Deliver complex models and urgent reports in a fraction of the time it used to take.
- 2. Go Deeper Than Ever Before: Effortlessly run more scenarios and stress-test your assumptions, uncovering risks and opportunities you might have missed.
- 3. Drive Real Impact: Free up your mental energy to focus on providing strategic advice that actually influences major business decisions.
Learning to build financial models with AI isn't just another skill to add to your resume; it's the start of a new way of working. You now have the framework to transform your workflow, elevate your career, and provide more value than ever before. The tools are here. It's time to put them to work.
3 Frequently Asked Questions About Excel AI
It's natural to have questions when you're thinking about bringing AI into your financial modeling workflow. I get asked about this all the time. Let's tackle 3 of the most common ones, from data security to how these new tools stack up against what you might already be using.
1. Is My Financial Data Secure When Using an AI Add-In?
This is probably the most important question, and the answer is yes—as long as you're using a tool built with privacy at its core. It all comes down to architecture.
With a privacy-first application like ElyxAI, your spreadsheet data never actually leaves your computer. The add-in is designed to only send your instructions (the text prompts you write) to the AI model. The numbers and sensitive details in your cells stay put.
All that communication is wrapped in enterprise-grade encryption, like AES-256 and TLS 1.3, so your financial information remains completely confidential. It’s never stored on a server or used to train the AI.
2. Can AI Handle My Company’s Unique Financial Models?
Absolutely. AI is surprisingly good at navigating complex and proprietary models, but it needs your expertise to guide it. Don't think of it as a mind-reader; think of it as a brilliant but junior analyst who needs clear instructions.
Instead of giving it a vague goal, you just break down your process into the same logical steps you would follow yourself. For instance, you could tell it:
- "First, calculate the Gross Margin using the data in columns C and D."
- "Next, project our operating expenses based on the 3% annual growth rate in the assumptions sheet."
- "Finally, make sure the resulting Net Income links directly to our Retained Earnings schedule."
A tool like ElyxAI understands the context of your workbook and will execute these commands one by one, adapting to the specific logic and layout of your model.
3. How Is This Different from Microsoft Copilot?
While they both fall under the "AI in Excel" umbrella, they play very different roles. I think of Microsoft Copilot as more of a guide. It can suggest a formula or explain a concept, but you're still the one doing the work and putting the pieces together.
An AI agent like ElyxAI, on the other hand, is an executor. It does the work for you.
It's the difference between getting a set of instructions and having an expert colleague build the model for you. You describe the final output—"Create a sales report by region with charts"—and the agent handles the entire workflow, from cleaning the data to building the charts and formatting the report right in your sheet.
Ready to see how this actually works and start winning back hours every week? Stop wrestling with tedious manual tasks and let an AI agent do the heavy lifting. ElyxAI gives you the power to automate everything from data prep to dashboard creation with simple, plain-English commands. Start your free 7-day trial today and see the difference for yourself.
Reading Excel tutorials to save time?
What if an AI did the work for you?
Describe what you need, Elyx executes it in Excel.
Sign up