Your Guide to Query in Excel: 7 Key Power Query Skills

You open a sales export on Monday morning. The dates are mixed, customer names have random capitalization, blank rows are scattered everywhere, and the region lookup lives in a different file. By Friday, the same cleanup will come back again with a fresh export and the same annoying steps.
That's where users first search for query in excel. They don't want theory. They want a repeatable way to import, clean, combine, and refresh data without rebuilding the process every time.
What is "Query in Excel" and Why It Beats Copy-Paste
A query in excel usually means using Power Query, which appears in modern Excel under Get & Transform. Think of it as a data-prep engine built into Excel. Instead of fixing a messy file once, you create a sequence of steps that Excel can replay whenever new data arrives.
Spending too much time on Excel?
Elyx AI generates your formulas and automates your tasks in seconds.
Sign up →
That matters because manual cleanup is fragile. One missed filter, one bad paste, one accidental sort, and your report is wrong. Power Query gives you something much better than speed alone. It gives you repeatability.
Excel is a strong home for this kind of work because it has been a foundational tool for spreadsheet analysis since its 1985 release, and it remains one of the most widely used data-analysis applications. Users can organize data, calculate, identify errors, visualize information, and make predictions in one place, which is why Excel works as a general-purpose analytics layer across everyday business reporting and analysis (WGU on Excel for data analysis).
The real shift
With copy-paste, you fix the current file.
With Power Query, you build a workflow.
That's the difference beginners often miss. If you import a CSV, remove blank rows, standardize product names, join a lookup table, and load the result into a PivotTable, you don't want to click those steps again next week. You want to hit Refresh.
Practical rule: If you've done the same cleanup twice, it probably belongs in Power Query.
Why busy teams like it
Power Query sits in a familiar Excel environment, so it feels less intimidating than jumping into a separate analytics tool. That's one reason Excel has stayed useful for non-specialists over time. People can learn data work inside a tool they already use daily.
This is also why Excel often sits beside broader automation stacks. If your team is connecting spreadsheet work to app workflows, approvals, or dashboards, it helps to understand how Microsoft tools fit together. A practical overview is this guide on how to build custom apps without expert coding.
The 3 Core Stages of a Power Query Workflow
Most confusion disappears once you stop thinking of Power Query as a mysterious editor and start thinking of it as a simple factory line.
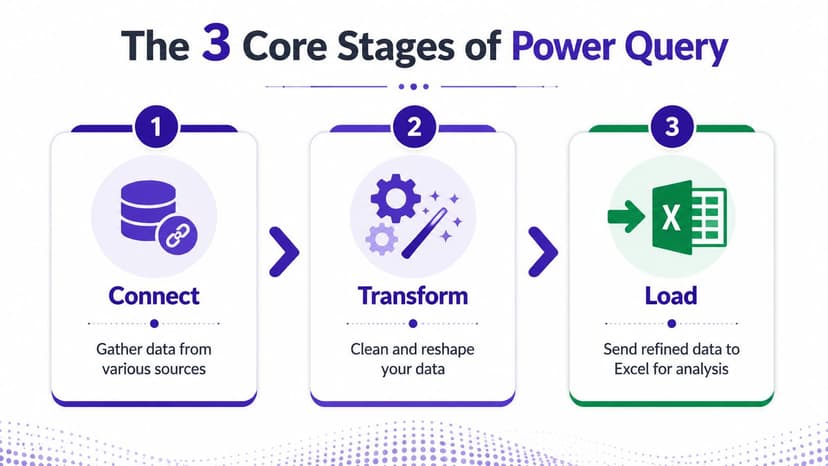
Connect
First, you connect to a source. That source might be another Excel workbook, a CSV export, a database, a web page, or a cloud service. The point is simple. Stop dragging data manually into your workbook and let Excel pull it from the original source.
If you work with incoming files every week, the time savings begin here.
Transform
Next, you transform the data. This is the part users typically refer to when discussing query in excel. You filter rows, split columns, fix data types, remove duplicates, merge tables, unpivot reports, and create new calculated columns.
Excel has stayed central to business analysis partly because its familiar interface lowers the barrier for non-specialists. Research on Excel in social research notes that the Microsoft interface can make it quicker to learn than many specialized statistical packages, which helps democratize everyday quantitative work (Sage Research Methods Community on Excel for research).
If the phrase data preprocessing sounds more technical than useful, this plain-language guide on data preprocessing in Excel and AI workflows is worth a read. It helps connect the cleanup work you do in Power Query with the broader idea of preparing data for analysis.
Load
Finally, you load the result somewhere useful. That could be:
- A worksheet table for everyday analysis
- A PivotTable-ready table for reporting
- A connection only query if the data feeds something else
- The data model when you want a more structured reporting setup
Think of the workflow like a recipe. You gather ingredients, prepare them, then serve the finished dish. If the recipe works, you keep it and use it again.
The mental model that makes Power Query easier
When people get lost, it's usually because they mix these stages together.
A cleaner way to think about it is this short checklist:
- Where is the data coming from
- What needs to change before analysis
- Where should the cleaned result go
That's the whole system. Once you keep those three questions in your head, Power Query stops feeling like a maze of buttons and starts feeling like an orderly process.
4 Beginner-Friendly Examples for Your First Query
The fastest way to learn query in excel is to solve small, boring problems that show up in real files. These four are the ones I'd start with.
Power Query's biggest advantage is that it turns those repetitive cleanup steps into a refreshable, ordered pipeline. Once you define the steps, you can refresh the query and re-apply the same logic to new source data, which is especially useful for recurring reporting (Integrate.io on Power Query workflows).
If you've heard the term data munging, that's basically the messy practical side of cleaning and reshaping raw data. This short explanation of data munging in business workflows maps well to what you're doing here.
1. Import another Excel file without copy-paste
You receive a workbook every month called something like Sales Export.xlsx.
Do this:
- Go to Data.
- Choose Get Data.
- Pick From File then From Workbook.
- Select the source file.
- In the Navigator window, choose the sheet or table you need.
- Click Transform Data if you want to clean it first, or Load if it's already ready.
Why this matters: the next file can follow the same path and structure. You won't need to copy one sheet into another workbook again.
2. Remove duplicates and blank rows
Messy exports often include duplicate records or empty lines that break summaries.
In the Power Query Editor:
- Select the table or the key columns.
- Go to Home and click Remove Rows if you want to remove blank rows.
- Use Remove Duplicates for duplicated records.
- Check the preview.
- Click Close & Load.
This is one of the first moments where Power Query feels better than ordinary Excel. In a worksheet, you might remove duplicates once. In Power Query, you save that cleanup as a reusable step.
Remove duplicates only after you've chosen the right columns. If you include a timestamp or row ID, rows that look duplicated to you may still count as different.
3. Split a Full Name column into First Name and Last Name
A file arrives with one column called Full Name, and you need two.
In the editor:
- Click the
Full Namecolumn. - Go to Transform.
- Choose Split Column.
- Pick By Delimiter.
- Select Space as the delimiter.
- If names are simple, split at the left-most delimiter. If they're more complex, review the output carefully.
This won't solve every naming pattern. Names with middle initials, double surnames, or titles need extra thought. But for a basic employee or customer list, it's a clean first exercise.
4. Merge two tables like a stronger VLOOKUP
Suppose one table has sales transactions and another has customer region data. You want region attached to each sale.
Steps:
- Load both tables into Power Query.
- In one query, go to Home and click Merge Queries.
- Select the second table.
- Click the matching column in both tables, such as
Customer ID. - Choose the join type.
- Expand the merged column and select the fields you want to bring in.
This is often easier to maintain than a worksheet lookup because the relationship lives inside the query logic.
A simple first-week practice plan
If you want confidence quickly, try this sequence on a non-critical file:
- Day one: Import a CSV or workbook
- Day two: Remove blanks and duplicates
- Day three: Split one text column
- Day four: Merge in a lookup table
That's enough to understand why people rely on query in excel for recurring reporting.
5 Common Power Query Transformations You Will Use Daily
Once the basics click, Power Query becomes more interesting. The true value isn't the import button. It's the transformations that solve common reporting problems.
I also want to make one part less scary. Power Query writes M code behind the scenes. You don't need to start by writing it yourself. In most cases, Excel writes it for you when you click buttons. Reading a little of it helps you understand what happened.
Conditional Column
Business problem: you need a simple rule such as classifying orders as “Large” or “Standard.”
In the editor, go to Add Column and choose Conditional Column. Then define a rule such as “if Amount is greater than a threshold, return Large, otherwise Standard.”
A typical generated M expression might look like this:
if [Amount] > 1000 then "Large" else "Standard"
You don't need to memorize that syntax on day one. It helps to notice that Power Query is just recording your business logic.
Unpivot Columns
Business problem: a report is laid out for humans, not analysis. Months run across the columns like Jan, Feb, Mar, and you need a proper table.
Select the month columns and use Transform > Unpivot Columns or Unpivot Other Columns, depending on your layout.
This step is powerful because it turns a cross-tab report into a structure that works for PivotTables, charts, and formulas.
If a report looks nice on screen but feels awkward to analyze, unpivot is often the fix.
Group By
Business problem: you want totals by customer, region, or product.
Use Home > Group By. Then choose the grouping column and the aggregation, such as Sum, Count, or Average.
This is the query equivalent of summarizing before analysis. Instead of loading every raw row into a worksheet, you can load a cleaner summary table.
Text cleanup with built-in functions
Business problem: names or categories are inconsistently capitalized.
You can use text transforms from the interface, such as uppercase, lowercase, trim, and clean. In M, text functions often appear in readable forms. If you want to understand text cleanup better in worksheet logic too, this guide on combining and cleaning text in Excel is a useful companion.
Here are a few common M-style text functions you'll see:
| Function | Purpose | Example |
|---|---|---|
Text.Proper |
Capitalize words in a standard way | Text.Proper([CustomerName]) |
Text.Upper |
Convert text to uppercase | Text.Upper([Region]) |
Text.Trim |
Remove extra spaces at the start or end | Text.Trim([Product]) |
Text.Combine |
Join text values together | Text.Combine({[FirstName],[LastName]}, " ") |
Custom Column
Business problem: you need a new field that doesn't exist yet, such as margin category, reporting month, or a combined label.
Go to Add Column > Custom Column and type a formula. For example:
[FirstName] & " " & [LastName]
That creates a combined name from two existing columns. If you've used worksheet formulas before, this feels familiar. The difference is that it becomes part of the refreshable data pipeline.
Why learning a little M is worth it
You don't need to become an M developer. But it helps to know that every click has a recorded expression underneath. That means your query is auditable. You can inspect it, tweak it, and understand why the output changed.
For analysts, that's a big deal. Hidden worksheet fixes are hard to track. Query steps are visible.
3 Advanced Tips for Faster and Cleaner Queries
At some point, a query works but feels slow, brittle, or hard to debug. That's when performance starts to matter.

Power Query can improve performance through query folding, which means it pushes transformations back to the source instead of doing everything inside Excel. Best practices such as setting the correct data types early and removing unneeded columns also reduce processing time (Excel Goodies on Power Query performance).
Check whether folding is helping
If your source is a database, folding can make a huge difference.
Here's the simplest analogy. You can either give instructions to the chef at the market and have them send only the prepared ingredients, or you can bring everything home and do all the work in your kitchen. Folding is the first option. It lets the source system do more of the heavy lifting.
Look for View Native Query when available. If later steps break folding, the query may become slower than you expect.
Faster queries usually come from asking for less data earlier, not from fixing performance at the end.
Manage dependencies on purpose
Queries often rely on other queries. One query imports raw sales. Another merges customer data. A third creates a monthly summary. If you rename, delete, or change one upstream query carelessly, the downstream ones can fail.
A few habits help:
- Name queries clearly: Use names like
Sales_Raw,Customers_Lookup, andSales_Final. - Separate staging from reporting: Keep raw connection queries apart from polished outputs.
- Avoid accidental circular logic: Don't build queries that feed each other in confusing ways.
This doesn't sound glamorous, but it keeps workbooks stable.
Use Applied Steps as a debugging timeline
The Applied Steps pane is one of the most helpful parts of Power Query. Each step records a change. When a column disappears, a data type breaks, or a merge returns nulls, step through the list one click at a time.
That lets you answer the only question that matters in debugging: where did the output first go wrong?
A practical rhythm looks like this:
- Click the last good step
- Click the next step
- Inspect the preview
- Edit or delete the step causing the issue
For many Excel users, that's easier than hunting through nested worksheet formulas across multiple tabs.
How 1 AI Command Can Replace 50 Power Query Clicks
There's a point where the promise of Power Query collides with reality. You know what result you want, but you don't want to remember every transform, join choice, load option, and cleanup sequence needed to get there.

That's why the more useful question today isn't just “how do I build a query in excel?” It's “should I build it manually at all?”
Recent tutorials still frame Excel querying as manual ETL, but the ecosystem is moving toward AI-assisted querying. The key decision is when to use Power Query versus an AI agent that can execute the workflow end to end (Excel Campus on Power Query and newer AI-assisted workflows).
What changes with AI-driven workflow execution
Instead of opening Power Query and clicking through each stage, you describe the outcome in plain language.
For example:
- Clean this sales export
- Merge it with the customer file using Customer ID
- Create a PivotTable by region
- Format the output for a management report
That instruction describes the goal, not the mechanics. If you're comparing approaches, this overview of Excel AI tools and how they work inside spreadsheets helps clarify the difference between formula assistance and workflow execution.
One example is Elyx AI, an Excel add-in that acts as an autonomous agent inside the workbook. Rather than only suggesting a formula or explaining the next step, it can execute multi-step spreadsheet tasks from a natural-language request, including cleaning data, building pivot reports, generating charts, and formatting the result.
Here's a short demo format that makes this shift easier to grasp:
The practical benefit
This doesn't remove the need for judgment. You still need to know whether the join key is correct, whether the source data is trustworthy, and whether the final report answers the business question.
What AI can remove is the mechanical burden. The repetitive clicks. The editor navigation. The rebuilding of a familiar pipeline from scratch when all you wanted was the finished analysis.
When to Use Power Query and When to Use AI
Use Power Query when you want direct control over the transformation logic. It's a strong choice when you're learning the mechanics, debugging a broken workflow, or building a query that needs careful inspection step by step.
Use an AI-driven Excel workflow when the outcome matters more than the manual path. That's often true when you already know what report you need and don't want to spend time assembling the same cleaning, merging, and formatting sequence again.
A simple rule works well:
- Choose Power Query when you need transparency, fine control, or deep debugging
- Choose AI when you need speed, less manual effort, and end-to-end execution from a plain-language request
If you're weighing AI against older automation methods, this comparison of Excel AI and VBA as alternatives for workflow automation is a useful next read.
The strongest Excel users usually don't pick one camp forever. They use Power Query when they need to understand the machine, and they use AI when they need the machine to get the work done.
If you spend too much time cleaning exports, merging files, building the same reports, and repeating Excel mechanics you already understand, Elyx AI is worth a look. It works inside Excel as an autonomous agent, so you can describe the job in plain language and let it execute the workflow directly in your spreadsheet.
Reading Excel tutorials to save time?
What if an AI did the work for you?
Describe what you need, Elyx executes it in Excel.
Sign up