Mapping Data Structures: 3 Essential Patterns in Excel

You open a CSV export, drop it into Excel, and immediately see the problem. Customer names sit in one column in this file, but your reporting template expects first name and last name separately. Dates switch between text and real date values. Region codes in the export don't match the names used in your master workbook. A product ID appears twice with slightly different formatting, so your lookup fails in one row and works in the next.
While often termed “cleaning data,” that phrase is too vague. What you're really doing is deciding how one structure should connect to another. You're matching fields, reshaping layouts, standardizing values, and preserving the meaning of the data while changing its form. That's the practical heart of mapping data structures.
If you've ever spent half a morning stitching together XLOOKUP, TEXT, LEFT, RIGHT, FILTER, Power Query steps, and manual fixes just to make one report usable, you're already doing data mapping. The difference is whether you're doing it ad hoc or with a clear model.
Spending too much time on Excel?
Elyx AI generates your formulas and automates your tasks in seconds.
Sign up →The Daily Struggle with Mismatched Data
A finance analyst downloads a sales export from a CRM on Monday morning. The file should feed a monthly report. Instead, it arrives with Cust Name, Txn Dt, St, and Amt as headers. The report model expects Customer Name, Transaction Date, State, and Revenue. One column stores dates as text like 03/01/24, another workbook uses a different regional date setting, and the state column contains a mix of abbreviations and full names.
So the analyst starts patching.
First comes a quick rename of headers. Then a helper column to convert dates. Then an XLOOKUP to map state abbreviations. Then a duplicate check. Then a manual sort because the order changed after a formula spill. By the time the workbook is usable, the analyst has spent more time preparing the data than reading what it says.
Why this keeps happening
Excel isn't the problem. Messy handoffs are.
Data comes from systems built for operations, not for your reporting logic. One team exports by customer. Another tracks by account. One file is wide, with a separate column for each month. Another is long, with one row per transaction. That mismatch is why ordinary spreadsheet work turns into repetitive cleanup.
For practical help with that early cleanup stage, this guide on how to organize data in Excel is a useful companion.
Practical rule: If you keep fixing the same mismatch every week, you don't have a one-off problem. You have a mapping problem.
What professionals often miss
People usually think the hard part is the formula. It usually isn't.
The hard part is deciding the rules. Which source column becomes which target column? What happens when a value is blank? Should CA become California? Should one row split into several records, or should several columns collapse into one category-value pair format?
Once those rules are clear, Excel becomes much easier to control. And once those rules are explicit, AI tools inside Excel can often automate most of the mechanics.
What Is Data Structure Mapping Really
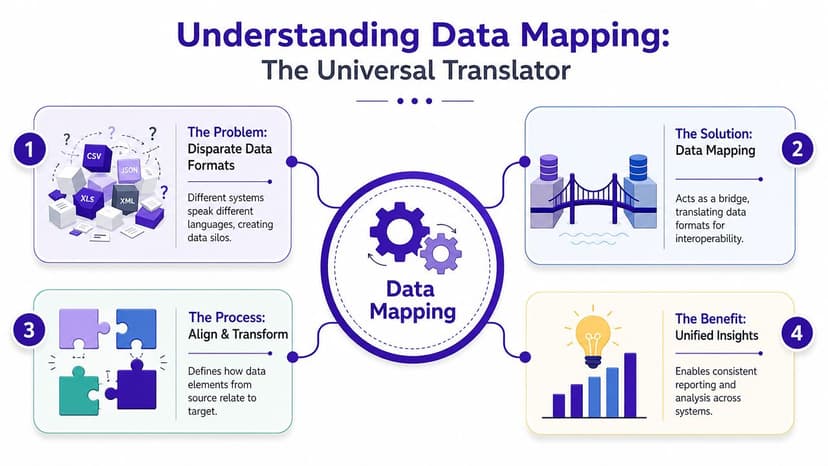
Data structure mapping is the set of rules that turns one layout into another without losing meaning.
For an Excel user, that usually means this: one file arrives in the shape the source system prefers, but your report, model, or dashboard needs a different shape. The columns may have different names. The codes may use different standards. One row may need to become several rows, or several fields may need to be combined into one.
A small example makes it concrete. A source export might contain Rep, Dt, and Gross. Your target table needs Salesperson, Date, and Revenue. Mapping defines those relationships. If Dt arrives as text and needs to become a real date, or if Gross includes symbols that must be removed before calculation, those cleanup steps are part of the mapping too.
The three parts that matter
Every mapping job has three parts, and keeping them separate prevents confusion.
The source
The raw export, CSV, copied report, form response, or old worksheet you start with.The target
The structure you need at the end. That might be a clean Excel Table, a pivot-friendly dataset, or a workbook split into related tables such as orders, customers, and products.The rules
The instructions that connect source to target. Rename this field. Split that text. Standardize these codes. Skip blank rows. Match this sheet to a lookup table.
If you have ever written formulas that break because a column name changed, you have already felt why mapping matters. The core work is not only moving values. It is preserving what each value means while changing its form.
Why this matters beyond spreadsheets
Mapping sits underneath reliable data integration, reporting, and automation. Teams use it to define field relationships, standardize formats, and catch quality issues before bad data spreads into downstream files or systems. That idea comes up across modern data engineering and analytics, but in Excel it shows up in a very practical way: fewer broken formulas, fewer manual fixes, and a dataset you can trust.
The broader history helps here. Once organizations began storing geographic information in structured digital systems instead of static paper maps, mapping became a machine-readable problem. Coordinates, attributes, and boundaries could be stored, matched, and transformed. GIS later grew into a large commercial market, as reflected in industry coverage from Encyclopaedia Britannica's overview of geographic information systems. The spreadsheet version is smaller in scale, but the logic is the same. You define how one structure corresponds to another so software can handle the repeatable work.
That is why many analysts start treating Excel less like a scratchpad and more like a lightweight data system. If that shift is relevant for your team, this guide on using Excel as a database is a useful next step.
A warehouse comparison helps, but it does not need to be fancy. Incoming boxes rarely arrive labeled and grouped the way the receiving shelf expects. Someone has to relabel, regroup, and route them correctly or the inventory record becomes unreliable. Data mapping does the same job for fields and values.
This idea shows up outside reporting too. In vehicle operations, teams often need to connect registration-based data to standardized records before they can assess consistency and risk. That need to reduce risk for UK motor trade follows the same principle.
ElyxAI shortens this process. Instead of writing every rename, split, lookup, and reshape step by hand, you can describe the target structure in plain language and let AI build much of the mapping logic for you inside Excel.
Good mapping changes the shape of data without changing its meaning.
3 Common Data Mapping Patterns in Excel
Most Excel users don't need a theory-heavy lesson on maps as abstract key-value objects. They need to recognize the patterns hiding inside ordinary workbook tasks.
A useful gap in most beginner material is that it explains definitions but doesn't show how map-like operations support actual reporting mechanics. In data storytelling, common angles include scale, change, ranking, variation, and relationships, with maps and heatmaps mostly used to communicate variation. What's often missing is the workflow beneath that output, like reshaping records and joining lookups in Excel. That's highlighted in this piece on the most common story types in data work.
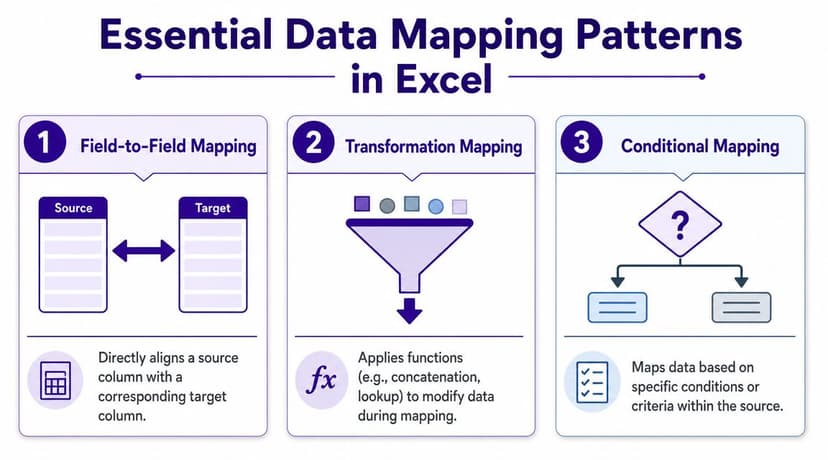
Pattern 1 Field to field mapping
This is the most direct form of mapping. One source column lines up with one target column.
| Source export | Target table |
|---|---|
| Cust Name | Customer Name |
| Txn Dt | Transaction Date |
| Amt | Revenue |
| Rep | Sales Rep |
This looks simple, but small inconsistencies create trouble fast. A source field might be named differently in each monthly export. One workbook might hold numbers as text. Another might include extra spaces in IDs.
A common Excel formula here is XLOOKUP, especially when the source values need a reference table.
Example formula
=XLOOKUP([@St],StateLookup[Code],StateLookup[State],"Not found")
How it works
[@St]is the value in the current row, such asCAStateLookup[Code]is the column that contains the abbreviationsStateLookup[State]is the return column with full names"Not found"gives you a safe fallback instead of an error
This is mapping in plain sight. You're telling Excel how one code should connect to a standardized value.
Pattern 2 Structural transformation
Sometimes the fields are correct, but the layout is wrong.
A common example is a wide sheet like this:
| Product | Jan | Feb | Mar |
|---|---|---|---|
| A | 120 | 130 | 125 |
| B | 90 | 95 | 100 |
For reporting, charts, and pivot tables, you often need a long format instead:
| Product | Month | Sales |
|---|---|---|
| A | Jan | 120 |
| A | Feb | 130 |
| A | Mar | 125 |
| B | Jan | 90 |
That isn't a simple rename. It's a reshape. You're remapping the structure itself.
Power Query often proves beneficial, especially for unpivoting monthly or quarterly columns into row-based records. If you want a stronger foundation for that approach, this guide on query tools in Excel is worth keeping nearby.
When a pivot table feels awkward, the issue is often the table shape, not the pivot settings.
Pattern 3 Normalizing a flat file
This is the pattern that confuses people most because it feels like one sheet is becoming several systems at once.
Suppose your raw sheet looks like this:
| Order ID | Customer Name | Customer Email | Product | Qty |
|---|---|---|---|---|
| 1001 | Maya Chen | [email protected] | Keyboard | 2 |
| 1001 | Maya Chen | [email protected] | Mouse | 1 |
| 1002 | Liam Patel | [email protected] | Monitor | 1 |
A cleaner structure may split that into separate tables:
Customers
| Customer Name | Customer Email |
|---|---|
| Maya Chen | [email protected] |
| Liam Patel | [email protected] |
Orders
| Order ID | Customer Email |
|---|---|
| 1001 | [email protected] |
| 1002 | [email protected] |
Order Lines
| Order ID | Product | Qty |
|---|---|---|
| 1001 | Keyboard | 2 |
| 1001 | Mouse | 1 |
| 1002 | Monitor | 1 |
You're not just cleaning. You're separating repeated facts so the workbook becomes easier to analyze, update, and validate.
Why these patterns matter together
Real spreadsheets often combine all three patterns in one workflow:
- Field alignment for renamed columns
- Transformation for date cleanup or lookups
- Normalization for cleaner downstream models
Once you can spot the pattern, the task feels less mysterious. You're no longer “fixing a messy sheet.” You're applying one of a few repeatable mapping data structures to turn raw input into analysis-ready data.
7 Best Practices for Flawless Data Mapping
A mapping job usually fails in ordinary places. The source sheet stores dates as text. A blank cell gets treated like zero. A lookup table changes, but the mapping logic stays frozen.
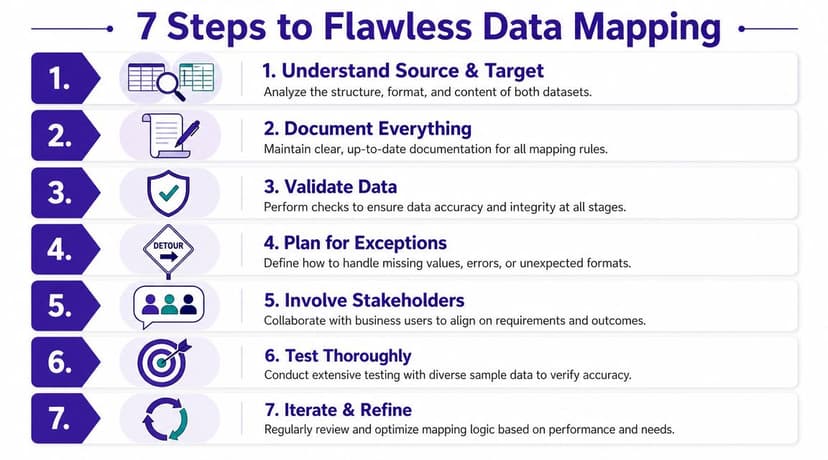
Good mapping is less about clever formulas and more about clear rules. If your source data needs cleanup before you map it, this guide to data preprocessing in Excel gives a practical foundation.
1 Know the source and the target
Start by putting the raw sheet and the finished layout side by side. You are matching two systems of meaning, not just two sets of column names.
Check headers, data types, and row grain. In plain terms, ask what one row stands for. One invoice? One customer? One monthly summary? If the source works at one level and the target works at another, the mapping will drift before you even write a formula.
Do this: confirm what one row represents.
Avoid this: assuming every row is a unique item because the table looks tidy.
2 Validate data types early
Excel can make bad data look believable. A date stored as text may still look like a date on the screen, but filters, sorting, and pivot tables will treat it differently.
A quick helper check saves time.
Example formula
=ISNUMBER([@[Transaction Date]])
How it works
[@[Transaction Date]]points to the value in the current rowISNUMBERreturns TRUE when Excel stores that date as a numeric serial value- FALSE usually means the cell contains text that only looks like a date
That small test is like checking whether a package has the right label before sending it through the warehouse.
3 Decide how blanks should behave
Blank cells need rules. Otherwise, Excel fills in the meaning for you, and it often picks the wrong one.
A blank amount might mean "not entered yet." A blank region code might mean "not applicable." A blank customer ID might mean the row should stop and be reviewed. Those are three different cases, even though they all look empty.
Set the behavior in advance:
- For lookups: choose whether a blank stays blank or returns a label
- For numeric fields: decide whether blank remains empty instead of becoming zero
- For joins: flag missing keys so they can be reviewed
4 Build a simple mapping dictionary
Create one worksheet that records the mapping decisions. This is your translation sheet between the source structure and the target structure.
| Source field | Target field | Rule |
|---|---|---|
| Txn Dt | Transaction Date | Convert to standard date |
| St | State | Lookup full state name |
| Cust Name | Customer Name | Trim spaces |
That table does two useful things. It makes the workbook easier to maintain, and it turns an abstract computer science idea, mapping between structures, into something an Excel user can inspect in seconds.
If you later hand the file to a teammate or ask ElyxAI to automate the workflow, the logic is already written down.
5 Check duplicates before the transformation
Duplicates change the meaning of a dataset. A repeated customer ID might be valid. A repeated order header might mean the source was exported twice.
Check the key columns before the transformation starts. In Excel, that might be a COUNTIF test, conditional formatting, or a pivot table that counts IDs. The point is simple. Find collisions early, while they are still easy to explain.
Do this: test duplicates on the natural key.
Avoid this: waiting until totals look wrong in the final report.
6 Test on a small batch first
Run the mapping on a handful of rows you can inspect line by line. Include awkward cases on purpose. Mixed date formats, missing lookup values, repeated keys, and extra spaces are all useful test rows.
AI can save real time for Excel users. Instead of rebuilding the same cleanup logic formula by formula, you can describe the mapping task in plain English and let ElyxAI apply it to a sample first. You still review the output, but the setup work gets much faster.
Small-batch testing catches rule mistakes before they spread across the whole workbook.
7 Plan for exceptions
Every real mapping process needs a place for rows that do not fit the rules.
Use a review sheet, a status column, or both. Labels such as Mapped, Missing Lookup, and Needs Review make the workbook easier to audit and fix later.
A few common examples:
- Unexpected code appears: send the row to an exceptions list
- Name split fails: keep the original full name instead of forcing a bad split
- Lookup returns nothing: flag the row instead of hiding the issue with a blank cell
Reliable mapping data structures do more than match columns. They protect your analysis from quiet errors before those errors reach a dashboard, pivot table, or monthly report.
1 Complete Walkthrough Mapping Data with ElyxAI
Suppose you receive a CRM export with these columns:
| Full Name | Transaction Date | State | Deal Value | Owner |
|---|---|---|---|---|
| Maya Chen | 01-03-2024 | CA | 1500 | J. Brown |
| Liam Patel | 2024/03/02 | TX | 980 | A. Singh |
Your goal is to produce a clean reporting table with:
| First Name | Last Name | Transaction Date | State Name | Revenue | Sales Owner |
|---|
That's a classic mixed mapping task. It includes field-to-field mapping, transformation, standardization, and lookup logic in one pass.

Step 1 Set up the workbook
Place the raw export on one sheet. Put a lookup table on another sheet named StateLookup with abbreviations in one column and full state names in another.
If you haven't added the tool yet, the setup guide for installing Excel AI shows how to get it into Excel.
Step 2 Give one natural language instruction
Instead of building the workflow formula by formula, you can describe the full mapping job in plain English.
A prompt might look like this:
Take the raw data on Sheet1. Split Full Name into First Name and Last Name. Convert Transaction Date to a standard Excel date. Map State abbreviations to full state names using the StateLookup sheet. Rename Deal Value to Revenue and Owner to Sales Owner. Create the final cleaned table on a new sheet and keep rows with missing state matches flagged for review.
That request contains the same logic a careful analyst would define manually. The difference is that the tool can execute the sequence for you inside the workbook.
Step 3 Review the result like an analyst
Even when AI performs the mechanics, your job is still important. You review whether the rules were applied correctly.
Check these points:
- Names split correctly: verify multi-part surnames and initials
- Dates converted properly: confirm that Excel recognizes them as dates, not text
- State mapping succeeded: inspect any flagged unmatched values
- Column names match the target model: this matters for pivots, formulas, and downstream links
Why AI helps especially with map choices
One underserved part of this topic is choosing the right map behavior for the task. Analysts and engineers often need to judge when a hash-based map is better than an ordered map, and how collision handling or update patterns affect performance at scale. That matters in Excel and BI workflows because users often need fast lookup, stable ordering, deduplication, and grouping in the same process. This is exactly the kind of complexity AI tools are well suited to manage automatically, as discussed in this overview of map tradeoffs for real workflows.
In practical Excel terms, that means you shouldn't have to think like a software engineer every time you clean a workbook. You still need to know what output you want. You just don't need to hand-build every intermediate step.
A manual fallback if you want to understand the mechanics
If you prefer to see the logic in traditional Excel terms, the workflow would usually involve steps like these:
Split the name
Use Text to Columns,TEXTSPLIT, or helper formulas.Standardize the date
Convert mixed text formats into a real Excel date value.Map the state
UseXLOOKUPagainst the lookup sheet.Rename and reorder fields
Match the target table exactly.Flag exceptions
Keep failed mappings visible for review.
That manual route is useful for learning. The AI route is useful when you want the workbook done without spending your afternoon on repetitive spreadsheet mechanics.
From Manual Mapping to AI-Powered Mastery
When people hear mapping data structures, they often expect a computer science lecture. In everyday Excel work, it's much more practical than that. It's the discipline of deciding how messy source data should become clean, usable, trustworthy tables.
That discipline shows up in simple column matching, in reshaping wide tables into long ones, and in separating one flat export into cleaner related tables. It also shows up in the habits that protect your results, like checking types, documenting rules, testing small samples, and planning for exceptions.
The bigger shift is operational. You still need to think clearly about source, target, and rules. But you no longer need to spend all your energy on the mechanics of execution. That's part of a broader move toward improving business operations by reducing repetitive manual work and keeping people focused on decisions instead of routine handling.
If you understand the patterns, you can spot them everywhere. If you pair that understanding with AI inside Excel, you can move from patching broken imports to running repeatable, reliable workflows.
If you want Excel to carry out full mapping workflows for you instead of just suggesting formulas, try Elyx AI. It works inside Excel as an autonomous agent, so you can describe a messy data transformation in plain language and let it execute the cleanup, restructuring, formatting, and reporting steps directly in your workbook.
Reading Excel tutorials to save time?
What if an AI did the work for you?
Describe what you need, Elyx executes it in Excel.
Sign up