Can AI Analyze Excel Data? 5 Smarter Ways to Get Results

Let's cut right to it. Yes, AI can absolutely analyze your Excel data, and it’s a lot less complicated than you might think. You no longer have to spend your day fighting with confusing formulas. With modern AI tools, you can get the answers you need just by describing what you want in plain English.
1. Yes, You Can Analyze Excel Data with AI

For years, being an "Excel wizard" meant having a massive library of functions like VLOOKUP, INDEX(MATCH), and pivot table tricks memorized. It was powerful, sure, but it also created a huge barrier. If you didn't know the exact right formula for the job, you were completely stuck.
Spending too much time on Excel?
Elyx AI generates your formulas and automates your tasks in seconds.
Sign up →But what if your spreadsheet could be an active partner in your analysis, instead of just a passive grid of cells waiting for commands? That’s exactly what happens when you bring AI into the picture. The big question—can AI analyze Excel data—now has a very clear and simple answer: yes.
From Formulas to Instructions: The New Workflow
This isn't just a small update; it's a completely different way of working. We're moving from manual execution to goal-oriented instruction.
Think of it this way: In the past, you were the mechanic. You had to know exactly which tool to grab, how to use it, and the precise order of operations to fix the engine. Now, you’re the one who simply describes the end goal—"I need the engine running smoothly"—and the AI assistant figures out which tools to use and gets it done.
This new workflow frees you up to think about the "what" and "why" behind your data instead of getting bogged down in the "how." For example, you can give a simple instruction like this:
"Analyze my sales data, get rid of any duplicates, add up the total revenue for each product category, and make me a bar chart showing the top five."
An AI can take that request, clean the data, build the summary, and generate the chart—all without you touching a single formula. It makes data analysis more intuitive and accessible for everyone, not just the data experts. If you're new to the idea, you can learn more about what an Excel AI is and how it works.
The difference in efficiency is striking. Let's compare how you'd handle common tasks the old way versus with an AI assistant.
A 4-Task Comparison: Traditional Excel vs. AI-Powered Excel
| Task | Traditional Excel Method | AI-Powered Method (e.g., with ElyxAI) | Time Saved |
|---|---|---|---|
| Data Cleaning | Manually find & remove duplicates; use TRIM or CLEAN formulas for formatting. |
"Clean this dataset by removing all duplicate rows and extra spaces." | Minutes to Hours |
| Creating a Summary | Build a PivotTable, manually drag-and-drop fields, and apply filters. | "Summarize sales by region and product category." | Minutes |
| Charting Data | Create a PivotTable, then select the data and use the Chart Wizard to configure the graph. | "Create a pie chart showing the sales distribution by country." | Minutes |
| Identifying Trends | Manually sort data, apply conditional formatting, and visually inspect for patterns. | "Identify the top 3 sales trends in the last quarter." | Hours |
As you can see, the time savings add up quickly. What once took a significant chunk of your afternoon can now be finished in the time it takes to type a single sentence. It’s a genuine shift in how we can all work with data.
5 Ways AI Automates Your Excel Data Analysis
So, how does AI actually change the way you work in Excel every day? It’s not about just replacing a few formulas here and there. AI assistants are designed to take over entire workflows, freeing you up to focus on what the data means, not the manual labor of getting it to talk.
Let's break down five key tasks that an AI can completely handle for you.
1. Automated Data Cleaning
Every good analysis is built on clean data, but getting it clean is usually the most mind-numbing part of the job. We've all been there—raw data exports filled with duplicate entries, extra spaces, inconsistent formatting, and blank rows that throw off your entire analysis.
Before AI, you’d spend hours wrestling with the "Remove Duplicates" tool, writing TRIM functions, and manually fixing typos. With an AI assistant, you just tell it what’s wrong.
- The Mess: Imagine a sales sheet with repeated orders, states listed as both "CA" and "California," and random characters messing up your product IDs.
- The AI Fix: You can simply type, "Clean this up. Get rid of all duplicate rows, make sure all state abbreviations are two letters, and strip any non-alphanumeric characters from the product ID column."
- The Result: In seconds, you have a perfectly clean, standardized dataset ready to go.
2. Intelligent Data Summarization
Once the data is clean, the next step is to make sense of it all. Creating summary reports with PivotTables is a classic Excel skill, but it still involves a lot of clicking and dragging fields, setting up filters, and choosing how to calculate everything.
An AI can build these summaries instantly from a single instruction. It has the context to understand your columns and can perform all the necessary aggregations for you, presenting a clear, final report. This kind of automation is becoming a core part of modern business efficiency, as you can see in many Business Process Automation Examples where AI helps simplify complex operations.
An AI assistant can take a request like, "Show me the total sales for each region, broken down by quarter," and generate the complete summary table for you. You don't even have to open the PivotTable menu.
3. Dynamic Chart and Graph Generation
A good chart can reveal trends and communicate insights far better than a table of numbers. But making one isn't always quick. You have to select the right data, pick the best chart type, and then spend time formatting all the labels, titles, and colors to make it look professional.
AI makes this whole process feel like magic. You just ask for the visual you need.
For example, you could ask, "Create a bar chart showing the top 5 performing products by revenue for Q4." The AI finds the right data, does the math to identify the top 5, builds a polished bar chart, and pops it right into your worksheet.
4. Advanced Trend and Pattern Detection
Often, the most valuable insights are buried deep in your data. Finding them the old-fashioned way means a lot of sorting, filtering, and using conditional formatting to hunt for patterns or oddities. It can feel like searching for a needle in a haystack.
Think of an AI as your personal data scientist. It actively scans your information for patterns that are statistically significant. It can answer questions that would otherwise take hours of painful, manual exploration.
You could ask something like, "Analyze the customer feedback from the last six months and find the most common complaints." The AI will read the text, categorize the comments, and surface the recurring themes for you. You can discover more about what else Excel AI can do in our dedicated guide.
5. Simple Predictive Analytics
While you'd typically need specialized software for complex forecasting, an AI in Excel can handle simple predictive tasks without breaking a sweat. It can run a basic linear regression or use your historical data to generate a quick forecast. This lets you ask forward-looking questions right inside your spreadsheet.
Let's say you have a column with your monthly sales data. You could ask the AI to perform a forecast using a formula like FORECAST.LINEAR.
- The AI Prompt: "Based on the sales trend over the last 12 months, forecast the next three months."
- The AI Action: The AI would apply the
FORECAST.LINEARformula to your data. The formula looks like this:FORECAST.LINEAR(x, known_y's, known_x's).x: The new data point you want to predict a value for (e.g., the next month).known_y's: The range of your existing historical sales values.known_x's: The range of your existing time periods (e.g., months 1 through 12).
- The Result: The AI will analyze the trend and give you a quick, data-driven estimate of what’s to come for the next three months.
2 Key AI Concepts: How AI Works Inside Your Spreadsheets
So, how does an AI actually get to work on your Excel data? The best way to picture an AI add-in like ElyxAI is to imagine having an expert analyst sitting next to you, ready to jump in. This isn't just a fancy new feature; it’s a completely different way to handle your data.
This "analyst" doesn't need you to write complex formulas. Instead, you just tell it what you want in plain English. It looks at your data, figures out what you mean, and then does all the heavy lifting for you. It's a huge step up from the basic formula generators we've seen in the past.
1. Formula Helpers vs. Autonomous Agents
It's important to understand the difference between a simple AI helper and a true autonomous agent. Many tools can glance at your data and suggest a formula. That's helpful, but you’re still the one doing the work—plugging it in, running the next step, and the next.
An autonomous agent, on the other hand, handles the entire workflow from start to finish. You give it the final goal, and it takes care of all the steps in between.
For example, you could just ask: "Clean this sheet, create a pivot table showing revenue by country, and then build a bar chart." The agent does all three things on its own, turning your simple request into a finished report without you needing to click another button.
This ability to connect different tasks is what makes the technology so practical.
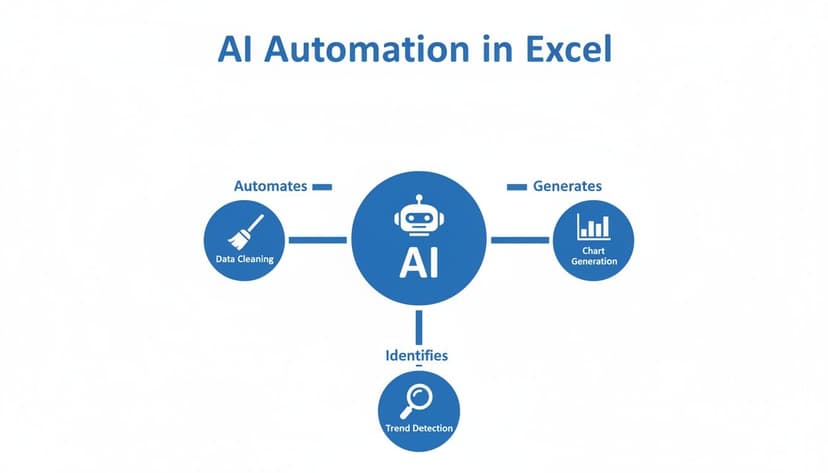
As you can see, a single AI can manage everything from data cleaning and charting to spotting trends, all from one central command.
2. The Brains Behind the Operation
What makes all this possible are advanced large language models (LLMs) like Anthropic’s Claude 3.5 Sonnet. These models are exceptionally good at understanding what we mean when we write, allowing them to break down a complex job into a series of logical steps. You can dive deeper into how this works by reading about what an Excel AI agent is and how it functions.
When you give it a command, the AI analyzes your request and your spreadsheet’s layout—the headers, the data types, everything. It then starts executing the necessary actions one by one. This process relies on a stack of technologies working together. For example, to even get data into a spreadsheet automatically, many systems first need to "read" it from a document; learning what is OCR technology and how it works gives you a good idea of how that foundational step happens.
Ultimately, these systems blend several key skills:
- Natural Language Understanding: To know what you want from your plain-text instructions.
- Contextual Awareness: To understand the specifics of your dataset and what you're trying to accomplish with it.
- Task Execution: To perform the actual work inside Excel, whether it's running calculations or designing charts.
This combination is what makes the AI a genuine partner in your analysis, not just another passive tool in your toolbox.
4 Real-World Examples of AI Analyzing Excel Data
It’s one thing to talk about AI analyzing spreadsheets in theory, but it’s another thing entirely to see it in action. Let's walk through four real-world scenarios where AI takes the grunt work out of Excel, giving professionals back their time.
These examples show how a simple instruction, written in plain English, can replace hours of tedious clicking and formula-building.
1. The Financial Analyst and the Variance Report
Picture a financial analyst staring at a messy data export from their accounting system. They need to build a quarterly variance report comparing actual spending to the budget, but the raw data is a jumble of inconsistent categories and extra columns.
- The Problem: Normally, this means an hour or more of painstaking work. They'd have to manually clean the data, create a summary table to calculate the variance for each department, and then fiddle with conditional formatting to highlight the big differences (over 10%).
- The AI Prompt: "Clean this data. Create a new table that compares 'Actual Spend' to 'Budgeted Spend' for each department. Add a 'Variance' column showing the percentage difference. Use conditional formatting to highlight any variance greater than 10% in red."
- The Result: In less than a minute, the AI produces a perfectly clean and formatted report. The analyst can now jump straight to investigating why certain departments went over budget instead of just trying to find the numbers. This also frees them up to think bigger, like how to improve forecast accuracy for the next quarter. You can learn more about improving forecast accuracy in our dedicated guide.
2. The Marketing Manager and Campaign ROI
A marketing manager has just wrapped up a major campaign and has all the results in a single spreadsheet. The catch? The data comes from Google Ads, Facebook, and their email platform, and none of it matches—the column names are different, and the date formats are all over the place.
- The Problem: Trying to calculate the overall Return on Investment (ROI) is a huge headache. It involves endless copy-pasting, manually reformatting dates, and trying to build complex formulas to stitch it all together.
- The AI Prompt: "Standardize the 'Date' columns into DD-MM-YYYY format. Consolidate the 'Cost' and 'Revenue' columns from all sources. Calculate the total ROI and create a pie chart showing the revenue contribution from each channel."
- The Result: The AI instantly merges the messy datasets into one clean view and generates a clear chart. The manager can see exactly how the campaign performed without wasting the afternoon on data janitor work.
3. The Operations Coordinator and Production Efficiency
An operations coordinator is responsible for monitoring a factory's daily production log. The spreadsheet tracks machine uptime, units produced, and the reasons for any downtime. Their goal is to spot recurring problems, but the raw data is just a wall of numbers.
With AI, the coordinator can move from simply collecting data to actively identifying opportunities for improvement. The focus shifts from data entry to strategic action, like scheduling preventative maintenance.
- The Problem: Building a useful dashboard from scratch is a repetitive task. Every week, they have to create multiple pivot tables and charts just to get a clear picture of what’s happening on the factory floor.
- The AI Prompt: "Analyze this production log. Create a dashboard with three charts: a line chart showing daily units produced, a bar chart of total downtime by machine, and a pie chart of the most common downtime reasons."
- The Result: The AI generates a complete visual dashboard in seconds. The coordinator can immediately see that "Machine 3" has the most downtime and that the main cause is "material jams," giving them a clear, actionable starting point for troubleshooting.
4. The Sales Manager and Regional Leaderboards
Every week, a sales manager wants to fire up their team with a performance leaderboard. They have a massive sales log with columns for salesperson, region, deal size, and the date of the sale.
- The Problem: This seems simple, but it’s a surprisingly repetitive chore. They have to manually filter by region, sort by sales totals, and format the data into a shareable leaderboard—for every single region, every single week.
- The AI Prompt: "Create a leaderboard ranking the top 3 salespeople by total deal size for each region. Display the results in separate tables for 'North,' 'South,' and 'East' regions, and add a trophy emoji next to the #1 salesperson in each table."
- The Result: The AI instantly generates perfectly formatted leaderboards, ready to be pasted into an email or Slack channel. What was once a weekly time-sink is now a task that takes just a few seconds.
2 Security Checks for Keeping Your Spreadsheet Data Private

Whenever I talk to people about using AI on their Excel files, the conversation almost always turns to one critical question: is it secure? It's a completely valid concern. You've got sensitive financial records, customer lists, and internal reports in those spreadsheets, and the thought of sending that data somewhere else is rightly nerve-wracking.
The truth is, security really boils down to how the AI tool is built. Some AI assistants need to upload your entire file to their cloud servers to work their magic. That's a potential weak link, introducing privacy risks if those servers aren't locked down tight.
The Privacy-First Approach: Local Data Processing
There’s a much safer way to do things. The best approach is to use a tool that keeps your data exactly where it is—on your own computer.
Privacy-first tools like ElyxAI are designed so your spreadsheet never actually leaves your machine. The only thing sent to the AI model is your plain-text request, like "clean up this column" or "create a pivot table." Your sensitive numbers and client details stay put, protected by your own security setup.
This is a non-negotiable for me: A trustworthy, business-ready AI tool will never store your data or use it to train its models. If a tool's privacy policy isn't crystal clear on this, walk away.
How to Choose a Secure AI Add-In in 2 Steps
When you're looking at AI add-ins for Excel, put on your security hat first. Before installing anything, I always recommend checking two things:
1. Verified by Microsoft AppSource: Stick to add-ins that are officially listed and vetted on the Microsoft AppSource. This means Microsoft has already checked them for security compliance and made sure they meet its standards. It’s a great first line of defense.
2. Enterprise-Grade Encryption: The tool should openly state that it uses strong encryption like AES-256 and secure protocols like TLS 1.3. This is the technical stuff that scrambles the communication between your computer and the AI, making sure your instructions can’t be intercepted.
For example, Elyx AI is a privacy-first add-in built on Claude 3.5 Sonnet that can handle complex, multi-step tasks right inside Excel—from cleaning duplicate entries to building regional sales reports with branded charts. All of this happens while your data remains local and your instructions are protected with AES-256 encryption. You can discover more about how AI data analysis tools are prioritizing privacy and what to look for.
By choosing a tool that processes your data locally and uses solid encryption, you can get all the benefits of AI analysis without having to worry about your data's safety.
Your First AI-Powered Analysis in 3 Simple Steps
It’s one thing to read about what AI can do in Excel, but it's another thing entirely to see it in action. Let's walk through a real-world task from start to finish. This quick tutorial will show you just how fast you can get results with a tool like ElyxAI.
First things first: a safe and simple setup. Any legitimate AI add-in should be downloaded from the official Microsoft AppSource. This is Microsoft's way of verifying that the tool is secure and works correctly with Excel. We cover this in more detail in our guide on how to install an Excel AI add-in.
With the tool installed, you're ready to go. Let’s fire it up with a typical sales log.
Step 1: Open the AI Chat Panel
To get started, you'll launch the AI assistant right inside your spreadsheet. With ElyxAI, this opens a simple chat panel on the side of your worksheet. This is your mission control.
Think of it as having an expert analyst sitting next to you, looking at your data. Your spreadsheet doesn't go anywhere—you're just telling the AI what you need done.
Step 2: Write a Clear, Multi-Step Prompt
This is where it gets interesting. Forget about memorizing formulas or navigating complex menus. All you have to do is describe what you want in plain English, just like you would to a coworker.
Let's imagine you've got a messy sales log that needs to be turned into a clean report. You could just type something like this:
"Clean this data by removing duplicates, create a pivot table showing total sales by region, and make a bar chart of the results."
That one sentence gives the AI three separate jobs: clean, summarize, and visualize. A good AI agent is designed to understand the entire sequence and execute it without you having to step in.
Step 3: Watch the AI Execute the Workflow
Once you hit send, the AI gets to work instantly. You’ll see the changes happen right on your screen. First, any duplicate rows will disappear. Then, a new sheet will pop up with a perfectly organized pivot table. Finally, a clean bar chart illustrating the regional sales will appear.
And just like that, it's done. A task that would have easily taken 15-20 minutes of manual work is finished in under a minute.
This is why integrating AI directly into Excel is such a game-changer. With over 1.2 billion people expected to use Microsoft Excel by 2026, it's the undisputed tool for daily data work. Bringing this kind of automation into a familiar environment saves a massive amount of time for marketing teams, financial analysts, and pretty much anyone who touches a spreadsheet. You can find more statistics about top data analysis tools on findanomaly.ai.
Your Top 4 Questions About AI in Excel, Answered
Thinking about letting AI take a crack at your spreadsheets? It's a smart move, but you probably have a few questions. Let's get right to them and clear things up.
1. Can AI Actually Create My Complex, Multi-Level Formulas?
You bet. This is one of the most immediate "wow" moments people have. Modern AI agents go way beyond a simple =SUM(). They can easily build out advanced logic, like nested IF statements, powerful lookups with VLOOKUP or XLOOKUP, and even sophisticated dynamic array formulas.
The best part? You don't need to know the syntax. You just describe the goal in plain English. For example, you could ask, "If a sale in column C is over 100, label it 'High,' otherwise call it 'Low.'" The AI will instantly translate that into the correct =IF(C2>100, "High", "Low") formula and apply it for you.
2. How Does AI Handle Really Large Datasets?
An AI add-in works right inside Excel, so it plays by Excel's rules. That means it’s bound by the application's built-in limit of 1,048,576 rows.
Honestly, for most business reports and tracking sheets, that's more than enough room. AI tools handle spreadsheets with hundreds of thousands of rows just fine. If your data happens to be even bigger than that, you're in the territory of dedicated databases or a business intelligence tool like Power BI.
3. Is an AI Like ElyxAI Difficult for Non-Experts to Use?
Not at all. In fact, these tools were built specifically for people who aren't data specialists. The entire point is to remove the technical headaches that get in the way of good analysis.
If you can describe what you want to achieve in a simple sentence, you can use the AI. It completely eliminates the need to memorize complex functions and multi-step procedures, making real data analysis accessible to everyone.
4. What’s the Difference Between Microsoft Copilot and a Specialized Add-In?
Think of it this way: Microsoft Copilot is a great general assistant for the whole Microsoft 365 world. It can help you draft an email in Outlook, create a presentation in PowerPoint, or perform basic tasks in Excel. It's broad and helpful everywhere.
A specialized add-in like ElyxAI, on the other hand, is a deep specialist built for one job: autonomous data analysis inside Excel. It’s designed to handle more sophisticated, multi-step workflows from a single prompt, offering a level of depth that a general-purpose tool might not.
Ready to stop wrestling with formulas and let an autonomous agent do the heavy lifting? With Elyx AI, you can turn hours of repetitive Excel work into seconds. Get your free trial and see for yourself.
Reading Excel tutorials to save time?
What if an AI did the work for you?
Describe what you need, Elyx executes it in Excel.
Sign up