How to Master Financial Reporting with AI in Excel

Think of your company's financial reporting process. Are you still manually building maps in Excel, spending hours plotting data points and hoping you don't make a wrong turn? Automated financial reporting software acts like a high-tech GPS for your finances. More specifically, AI-powered tools within Excel can automate how you gather, sort, and present financial data, turning raw numbers into clean, compliant reports with minimal manual work. This technology is a direct fix for the classic headaches of manual reporting: costly mistakes, wasted time, and a frustrating lack of real-time insight.
What is Automated Financial Reporting in Excel?
At its heart, automating financial reporting means using technology to eliminate the repetitive, soul-crushing work of creating financial statements. Instead of dumping data into Excel and spending hours copying, pasting, and checking formulas, modern tools—especially AI assistants that live directly inside your spreadsheet—can connect to your data sources and streamline the entire workflow. It’s a specialized form of intelligent process automation software designed for finance teams who live in Excel.
Picture this: your AI assistant acts as a central hub for your financial information. With simple commands, it can pull data from various sources, clean it, and structure it for you, all within your trusted spreadsheet environment. This direct connection is what makes powerful automation possible, guaranteeing that every report is built on correct, current information. The immediate payoff is a massive reduction in the time it takes to close the books each month.
Spending too much time on Excel?
Elyx AI generates your formulas and automates your tasks in seconds.
Sign up →How AI Moves Teams Beyond Manual Spreadsheets
Working in Excel isn't just slow when done manually; it's risky. A single broken formula or a wrong cell reference can wreck an entire report, causing leaders to make bad decisions based on bad data. AI-driven automation within Excel solves this problem by creating structured, repeatable processes you can rely on.
This change is huge for finance teams. It frees them up from being data entry clerks and lets them become strategic advisors. The old way had them spending 80% of their time just collecting and formatting data and only 20% analyzing it. Automation flips that ratio on its head.
By taking away the chore of manual data wrangling, AI tools give finance pros the time to actually interpret what the numbers mean, spot trends, and help steer the business—all without leaving the familiar Excel interface. It’s a shift from just recording history to actively shaping the future.
This move toward automation is why the market is booming. The global financial reporting software market was valued at $8.96 billion in 2021 and is expected to hit $23.16 billion by 2033, growing at a CAGR of 8.24%. This isn't just a fad; it shows a real demand for tools that deliver financial clarity and efficiency. You can dig deeper into these trends on cognitivemarketresearch.com.
Ultimately, these tools offer a scalable, secure, and smart alternative to being chained to manual spreadsheet tasks. They don't just give you faster reports—they give you reports you can trust, so leaders can make big decisions without having to second-guess the numbers.
A Look at the Core Features That Power Automation
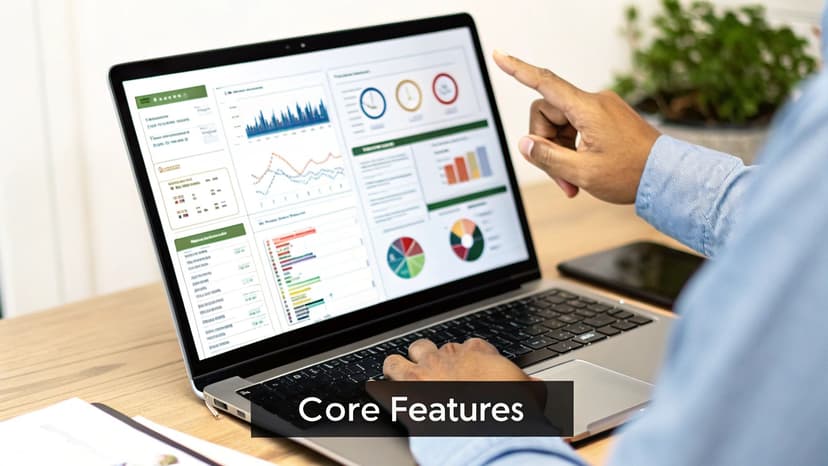
To really get why automated financial reporting software is such a game-changer, especially when integrated with Excel, you have to look under the hood. These aren't just abstract functions; they are direct solutions to the biggest headaches finance teams have been dealing with for years. Each feature is designed to knock out a specific manual bottleneck, turning a tedious, error-prone workflow into something efficient and reliable.
The demand for these tools is exploding for a reason. The global financial reporting software market was valued at around $14.60 billion in 2024 and is expected to hit $40.83 billion by 2032. This incredible growth is fueled by AI and cloud technology, which are giving CFOs the power to embrace automation and self-service analytics. You can dig deeper into these market trends in a report on 360iresearch.com.
So, let's break down the essential features that make this possible.
Unified Data Integration
The biggest source of pain in manual reporting is siloed data. You've got crucial information stuck in your ERP, accounting software, CRM, and a dozen different spreadsheets. Data integration acts like a universal adapter, automatically pulling data from all those disconnected systems into one central, trustworthy place.
This creates a "single source of truth." No more chaotic copy-pasting, cleaning, and trying to mash different datasets together. For example, instead of manually exporting sales figures from a CRM into Excel, an AI tool can fetch and place that data for you, ensuring it's always up-to-date and correct.
Automated Report Generation
This feature is the hero that saves you from the mind-numbing task of building reports from scratch every single time. Once your data is all in one place, the software uses smart templates to automatically generate standard financial statements—balance sheets, income statements, cash flow statements, you name it.
You can schedule these reports to run daily, weekly, or monthly, delivering perfectly consistent results without anyone having to lift a finger. For teams still living in spreadsheets, learning how to automate Excel reports is a fantastic starting point. With dedicated AI tools, a month-end close that used to take a full week can be wrapped up in just a few hours.
By automating report creation, you virtually eliminate the risk of human error from typos or broken formulas. It's not just about speed; it's about creating reports that your leadership team can actually trust for making critical decisions.
Robust Compliance Management
Staying compliant with standards like GAAP or IFRS isn't optional, but it's a huge source of stress. Compliance management features are built to take that weight off your shoulders. The software can use pre-configured templates that meet major regulatory requirements, ensuring your reports are structured correctly right from the start.
On top of that, these systems can help create a clear audit trail by logging changes and calculations. This makes both internal and external audits so much smoother because you can trace every number back to its source with just a couple of clicks.
Interactive Dashboards and Visualization
Let's be honest: static reports filled with dense tables are hard for anyone to digest. Interactive dashboards turn that raw data into a dynamic, visual story that makes sense to everyone, from the CFO to a department head.
With AI in Excel, you can ask a question in plain English like, "Create a bar chart showing quarterly revenue for the last two years," and get an instant visualization. A CFO in a board meeting could then ask a follow-up question to drill down into the performance of a specific product line. This ability to answer questions on the spot turns financial reporting from a backward-looking chore into a strategic, forward-looking conversation.
To make this crystal clear, let's connect these features to the real-world value they provide. Each one solves a specific problem that ultimately impacts the business's bottom line.
Core Features and Their Business Impact
| Core Feature | Problem Solved | Primary Business Impact |
|---|---|---|
| Unified Data Integration | Data silos and manual data consolidation | Creates a single source of truth, eliminating inconsistencies and saving countless hours of manual work. |
| Automated Report Generation | Repetitive, time-consuming report building | Frees up the finance team from routine tasks to focus on strategic analysis and accelerates the financial close cycle. |
| Robust Compliance Management | Risk of non-compliance and difficult audit prep | Reduces audit risk with built-in controls and clear audit trails, ensuring reports meet regulatory standards like GAAP or IFRS. |
| Interactive Dashboards | Static, hard-to-interpret reports | Empowers leaders with real-time, visual data, enabling them to make faster, more informed strategic decisions on the fly. |
Ultimately, these aren't just isolated tools. They work together to create a cohesive system that not only saves time but also elevates the role of the finance department from number-crunching to strategic advising.
The Real-World Benefits of Automated Reporting
It’s one thing to talk about features, but what really matters is the impact automated financial reporting software has on your business. When you move past the technical jargon, you see how automation helps the finance department evolve from a group of historical record-keepers into genuine strategic partners. Let's look at the "why" behind this shift and explore the tangible benefits.
The most obvious win is the sheer amount of time you get back. For too many finance teams, the month-end close is a frantic, week-long marathon of pulling data and building reports by hand. Automation shrinks that timeline from weeks to just a few days—sometimes even hours.
By cutting out tedious tasks like data entry and reconciliation, finance pros are freed up to focus on work that actually moves the needle, like deep analysis and strategic planning. They can add far more value when they aren't buried in spreadsheets.
Greater Accuracy and Trust in Your Numbers
Manual data entry is just asking for trouble. A single typo, a misplaced decimal, or a busted formula can throw off an entire financial statement, leading to bad decisions based on bad data. Automated systems pull information directly from your other tools, which virtually eliminates the risk of these human errors.
This builds a rock-solid foundation of trust in your financial data. When the leadership team knows the reports are accurate and dependable, they can make crucial decisions with confidence.
The result is a more resilient and trustworthy financial operation. Instead of spending time hunting for errors and double-checking figures, teams can trust their data and focus on what it means for the business's future.
Top-tier financial reporting tools have the stats to back this up. Some platforms help teams achieve 100% error-free financial reporting through real-time integration. This can slash report prep time by up to 95%, delivering 80% faster financial reporting cycles and speeding up decision-making by 70%. You can dig into these AI-driven efficiency findings on highradius.com.
From Reactive Reporting to Proactive Decisions
Traditional reporting often feels like driving while looking in the rearview mirror—you’re only analyzing what’s already happened. Automated reporting, on the other hand, gives you access to real-time data, letting your leaders get ahead of the curve. With up-to-the-minute dashboards and insights, they can spot trends as they develop and act on opportunities before they're gone.
This completely changes the game for strategic planning. For instance, a company can immediately see that a product line is underperforming and adjust its strategy on the fly, instead of waiting until the quarter ends to find out there was a problem. That kind of agility is a massive competitive advantage.
Seamless Scalability for a Growing Business
As a business grows, financial reporting gets exponentially more complex. More transactions, new business entities, and bigger teams can quickly overwhelm a manual, Excel-based workflow. This often forces companies to hire more finance staff just to keep pace with the workload.
Automated financial reporting software is designed to scale with you. It can handle massive data volumes and complex multi-entity consolidations without demanding more manual effort. This means your business can grow without your finance team becoming a bottleneck. This is especially true in complex fields like Venture Capital, where automation is key to learning how to improve LP reporting in Venture Capital and keeping investors happy as a fund expands.
Ultimately, these benefits all work together to elevate the entire finance function. By automating the routine work, you empower your team to provide the strategic insights that drive the business forward. Your finance operation becomes a powerful engine for growth, not just an administrative cost center.
Dedicated Software Versus AI Tools in Excel
It's the classic "build vs. buy" dilemma, but for finance teams. Should you invest in a completely separate, standalone reporting platform, or should you supercharge the tool you already live in every day—Excel? This is a huge question, and the right answer depends entirely on your team's size, the complexity of your business, and where you're headed.
Let's break it down with an analogy.
Think of dedicated software as a professional chef's kitchen. Everything is purpose-built: specialized ovens for specific tasks, integrated safety features like audit trails, and the capacity to handle a massive dinner rush. It’s designed for scale, airtight security, and perfect repeatability, making it the go-to for large companies with serious compliance demands.
On the other hand, AI-powered Excel tools like Elyx.AI are more like a high-end, versatile multi-cooker. You're still in your familiar home kitchen (Excel), but now you have this incredibly powerful gadget that makes everything faster and smarter. It’s flexible, easy to start using, and perfect for teams who need to be nimble without the cost and headache of a massive new system.
Understanding The Tipping Point
For a startup or a small business, an AI tool inside Excel delivers value almost instantly. You can whip up a quick dashboard summary, clean up a messy data export with a simple command, or automate tedious report formatting without a six-month implementation project. The learning curve is practically zero because everyone already knows their way around a spreadsheet.
But as a business grows, its needs evolve. An expanding company will eventually hit a tipping point where that trusty multi-cooker just can't keep up. The demand for rock-solid security protocols, complex financial consolidations across multiple business units, and strict user permissions becomes non-negotiable. That's when you need the full professional kitchen—the dedicated software.
The decision tree below helps visualize why teams move toward automation in the first place, whether it’s with an add-in or a full platform.
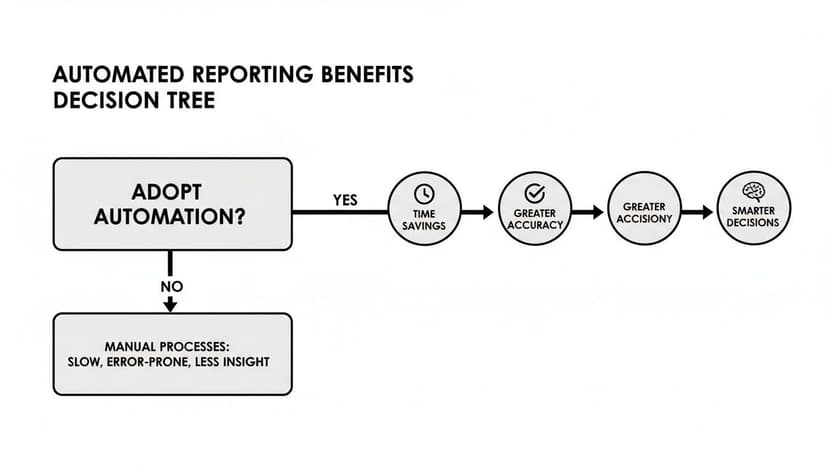
As you can see, the drive to automate is all about saving time, eliminating errors, and freeing up your team to make smarter decisions—goals that any good reporting solution should help you achieve.
A Head-to-Head Comparison
To make the right call, you have to get real about where each option truly shines. While both approaches lead to more automation, they are built for very different scales and priorities.
To help you see the practical differences, here’s a head-to-head comparison. This table breaks down how dedicated platforms and AI-powered Excel tools stack up against the criteria that matter most to finance and operations teams.
Dedicated Software vs. AI in Excel: A Feature Comparison
| Criteria | Dedicated Reporting Software | AI-Powered Excel (e.g., Elyx.AI) |
|---|---|---|
| Implementation | A longer process, often needing IT support and significant team training. | Quick and simple. Usually a fast add-in installation with almost no training needed. |
| Cost | Higher initial investment with subscription fees, setup costs, and support contracts. | Lower cost. Typically a straightforward subscription with a much lower entry price. |
| Scalability | Built to handle huge data volumes and complex multi-company consolidations with ease. | Best for small to mid-sized datasets and reporting within a single company structure. |
| Security | Offers advanced, enterprise-grade security with granular user controls and full audit trails. | Relies on Excel's security, enhanced by the AI tool's secure data handling protocols. |
| User Experience | Involves learning a completely new interface and set of workflows from scratch. | Operates within the familiar and universally understood Excel environment. |
| Flexibility | More structured and process-driven, which ensures consistency but can feel rigid. | Highly flexible. Perfect for ad-hoc analysis and building custom reports on the fly. |
Ultimately, this comparison shows there's no single "best" answer—only what's best for you.
The best choice is all about context. A global corporation with dozens of subsidiaries simply can't operate without the heavy-duty consolidation and compliance features of dedicated software. But a nimble marketing team that just needs to analyze campaign data in Excel would get a massive productivity boost from an AI add-in.
The goal is to match the tool to the job. If your main challenge is wrestling with immense complexity and satisfying regulators across a large organization, dedicated automated financial reporting software is the obvious choice. But if you want to empower your team to work smarter and faster inside the tools they already use, AI in Excel is a powerful, practical, and cost-effective solution.
For a deeper look at the options out there, our detailed business reporting tools comparison can help you weigh the pros and cons for your specific situation.
How to Choose the Right Reporting Solution
Picking the right automated financial reporting software is a huge decision, one that ripples through your entire finance team. This isn't just about buying another tool; it’s an investment in a solution that needs to fit your team like a glove, grow with your business, and actually fix the things that are broken. To get it right, you need a game plan—a practical guide to cut through the noise.
Think of it like buying a car for a growing family. You wouldn’t just grab the flashiest sports car on the lot. You'd think about a car seat, storage space, gas mileage, and safety ratings. The best reporting software isn't necessarily the one with a million features; it's the one that perfectly matches your company's real-world needs.
Assess Your Current Pain Points
First things first: you have to know what hurts. Where are the biggest headaches in your reporting process right now? Be honest and get specific. "Reporting is slow" isn't enough—pinpoint the exact bottlenecks.
- Data Consolidation: Are your analysts burning hours just trying to stitch together data from a dozen different spreadsheets and systems?
- Month-End Close: Is your close process consistently spilling into the first week of the next month, leaving everyone stressed and behind schedule?
- Error Correction: How much time gets sucked into the black hole of finding and fixing manual entry mistakes or a single broken formula?
- Manual Reporting: Is your team basically a report factory, stuck building the same weekly and monthly decks from scratch, over and over again?
Laying out these pain points gives you a clear checklist. Any software you look at must solve these specific problems. If it doesn't, it’s not the right fit.
Plan for Future Growth
The software that’s a perfect fit today could become a serious bottleneck in three to five years. You have to think ahead and choose a solution that can scale with you. A tool built for a small startup with one bank account is going to crumble under the weight of a global company with multiple subsidiaries.
Ask yourself these forward-looking questions:
- If we go international, can this software handle multi-currency conversions and different reporting standards without a ton of manual work?
- Can it manage complex consolidations across multiple business entities automatically?
- Is the pricing going to kill us as we add more users or our data grows?
Choosing a scalable solution now saves you from the massive headache of ripping out and replacing your software in just a few years. It's about making sure your tech can keep up with your ambition.
Verify Integration Capabilities
Your reporting software can't live on an island. It has to play nice with the tools you already use—especially your ERP, accounting system, and CRM. If it doesn't integrate smoothly, you'll just create new data silos and send your team right back to the manual export-and-import loop you were trying to escape.
When you're watching a demo, make them show you exactly how the tool connects to your key systems. A seamless, automated flow of data isn't a "nice-to-have"; it's a dealbreaker.
Calculate the Total Cost of Ownership
Finally, look past the price tag. The monthly subscription is just the beginning. To understand the real cost, you need to calculate the Total Cost of Ownership (TCO), which gives you a much clearer picture of your long-term investment.
Be sure to factor in these costs:
- Implementation Fees: What are the one-time charges to get everything set up and configured?
- Training Costs: How much will it cost to get your team truly comfortable and efficient with the new platform?
- Support and Maintenance: Is ongoing support included, or is that an extra line item on the invoice?
By weighing all these factors, you can make a smart decision that pays off for years and turns your finance team into the strategic powerhouse it's meant to be.
Your Guide to a Smooth Implementation

Switching to a new automated financial reporting software can feel like a huge project, but with the right game plan, it doesn't have to be overwhelming. The secret is breaking the rollout into clear, manageable phases. This turns a complex task into a straightforward journey, minimizing headaches and getting your team on board from day one.
Good communication is everything here. People need to understand the "why" behind the change—how this new tool will genuinely make their jobs easier, not just add another piece of software to learn. A solid plan lets you guide your team confidently toward a much more efficient way of working.
Phase 1: Planning and Discovery
Think of this first phase as building the foundation for your house. Get this right, and everything else stands on solid ground. Before you touch any software, you need to define what success actually looks like for your team.
Start by pinpointing your biggest reporting headaches. What problems are you trying to solve? From there, you can set clear, measurable goals for the new system. Then, assemble your project team, pulling in key people from finance, IT, and any other department that will rely on the reports. Getting them involved early is the best way to secure buy-in and make sure the final setup works for everyone.
Phase 2: Configuration and Data Migration
With your blueprint complete, it’s time to start building. This phase is all about the technical heavy lifting—setting up the software to fit your company's specific financial processes. It's also when you'll move all your historical and current financial data from the old systems into the new one.
A word of caution: data hygiene is non-negotiable. You have to clean up and standardize your data before moving it. Otherwise, you're just carrying old problems into a shiny new system. This is also where you'll connect the software to your ERP and other data sources to get that smooth, automated flow of information going.
Phase 3: Training and Go-Live
The system is built, and now it's time to hand over the keys to your team. This phase is all about great training, making sure everyone feels confident and ready to use the new software. A quick demo won't cut it. Your training needs to be hands-on and designed for the different ways people will use the tool.
Before you flip the switch for good, run parallel tests. This means you keep your old system running alongside the new one for a short time. It’s the perfect way to compare results and catch any small issues before they become big ones. Once everything checks out, you’re ready to go live.
Phase 4: Optimization and Feedback
Launching the software isn't the end of the project—it's just the beginning. The final phase is all about fine-tuning and continuous improvement. Make it a point to gather feedback from your team. What’s working well? What could be better? This is how you smooth out any rough edges in the new workflow.
This is also the perfect time to start exploring the software’s more advanced features. You probably didn't need everything on day one, but as your team gets comfortable, you can start introducing new capabilities to make your processes even better. To dive deeper into the benefits that make these projects worthwhile, you can learn more about financial reporting automation in our detailed guide.
Your Top Questions, Answered
Thinking about making the switch to automated financial reporting software? It's a big step, and you probably have a few practical questions. Let's tackle some of the most common ones we hear from finance teams.
How Is This Software Priced?
Most of these tools work on a subscription model, usually billed monthly or annually. The price tag really depends on a few things: how many people on your team need to use it, how many different data sources you need to connect (like your ERP or CRM), and which specific features you can't live without.
While it’s an investment, think about it this way: the cost is almost always balanced out by the sheer amount of time you get back and the costly errors you'll avoid.
What’s the Learning Curve for Excel Power Users?
If your team lives and breathes Excel, a new system can feel like a big leap. But honestly, the transition is usually much smoother than people expect.
The point isn't to throw away your team's hard-earned Excel skills—it's to supercharge them. You’ll find that the software takes over the mind-numbing data gathering and grunt work, freeing up your experts to do what they do best: analyze the numbers and find strategic insights.
Can It Handle International Reporting Standards?
Absolutely. A good platform is built for global business from the ground up. They come with built-in features to handle tricky multi-currency consolidations and keep you compliant with international standards like IFRS and GAAP.
This is a game-changer for companies with a global footprint, ensuring your reports are consistent and accurate across the board without all the manual gymnastics.
How Should We Calculate the Return on Investment?
To figure out the real ROI, you have to look beyond the subscription cost. It's about quantifying the value you're getting back.
Here’s a simple way to break it down:
- Time Saved: Add up the hours your team currently spends on manual reporting, data entry, and corrections each month.
- Errors Avoided: What’s the potential cost of one significant reporting mistake? Automation dramatically cuts down that risk.
- Strategic Value: How much is it worth to get real-time insights that lead to smarter, faster business decisions?
Ready to bring powerful, yet simple, automation directly into the tool your team already loves? Elyx.AI integrates advanced AI capabilities into Excel, helping you clean data, generate insights, and build reports with natural language. Learn more about Elyx.AI today.
Reading Excel tutorials to save time?
What if an AI did the work for you?
Describe what you need, Elyx executes it in Excel.
Sign up