Business Reporting Tools Comparison: An In-Depth Guide for Excel Users

Picking the right business reporting tool can be the difference between getting stuck in data paralysis and truly driving growth. When you find the right fit—especially tools that bring AI into familiar spaces like Excel—raw numbers start telling a clear story you can act on. This guide puts three top contenders head-to-head: Elyx.AI, Microsoft Power BI, and Tableau, with a special focus on solving real-world problems for teams who live in Excel.
Why Choosing the Right Business Reporting Tool Matters

In today's market, wrestling with data manually in Excel just doesn't cut it anymore. You need tools that can turn massive datasets into real strategic advantages. But if you choose the wrong one, you end up with wasted money, a frustrated team, and opportunities that slip right through your fingers. The trick is finding a solution that fits your current workflow, your team's skills, and your company's goals.
Spending too much time on Excel?
Elyx AI generates your formulas and automates your tasks in seconds.
Sign up →There's no denying how much we all rely on data now. The global business analytics market hit a value of $96.6 billion in 2024 and is expected to soar to $196.5 billion by 2033. This trend points to one simple truth: companies that can effectively interpret their data are the ones that get ahead. You can read the full research on business analytics market growth to see just how fast things are moving.
Understanding the Core Problem
The biggest hurdle for most teams is closing the gap between having a ton of data and actually getting useful insights from it. So many of us live in Excel, but pulling out complex trends often means you either need to be a spreadsheet wizard or spend hours on manual work. This is exactly where modern reporting tools step in, but they each tackle the problem from a different angle.
A good business reporting tools comparison isn't just about listing features. It's about seeing how each platform solves your specific problems. For example, some tools make you export your data out of Excel into their own world. Others, like Elyx.AI, are built to bring advanced AI analysis right into the spreadsheets you already use every day, solving the exact pain points of Excel users.
The goal isn't just to find the tool with the longest feature list. It's to find the one that removes the most friction from your team's day-to-day reporting.
Comparing Key Philosophies
This guide breaks down three very different ways of approaching business reporting. Understanding their core philosophies is the best first step you can take to see how they align with your needs.
| Tool | Core Philosophy | Best Suited For |
|---|---|---|
| Elyx.AI | AI-native reporting and analysis directly within Microsoft Excel. | Excel users who need to automate reports, generate insights, and visualize data without leaving their spreadsheet. |
| Microsoft Power BI | Integrated business analytics within the broader Microsoft ecosystem. | Organizations heavily invested in Microsoft products seeking a dedicated, user-friendly BI platform. |
| Tableau | Best-in-class data visualization and deep exploratory analysis. | Data analysts and scientists who require granular control over complex data visualizations and dashboards. |
Getting to Know the Top Business Reporting Tools

Before we jump into a side-by-side comparison, it’s important to get a feel for what makes each of these tools tick. They aren't just different flavors of the same thing; each was built with a specific kind of user and a particular workflow in mind. Understanding their core philosophies is the first step in figuring out which one actually fits your team.
We’re going to focus on three major players that define the market today. First, there's Elyx.AI, which works as an AI-native add-in right inside Microsoft Excel. Then you have Tableau, long considered the gold standard for complex data visualization. And finally, there's Microsoft Power BI, the go-to for powerful, integrated analytics, especially for businesses already deep in the Microsoft ecosystem. Each tool tackles business reporting from a completely different angle.
Elyx.AI: Your AI Assistant Inside Excel
The real magic of Elyx.AI is how deeply it embeds itself into Microsoft Excel. Instead of forcing you to learn a whole new piece of software, it brings the power of AI directly into the spreadsheets you already use every day. This design is perfect for professionals who practically live in Excel and want to speed up their work without a painful data migration process.
You can create complex reports, build charts, and get data summaries just by typing in plain English. For example, asking Elyx.AI to "summarize Q4 sales by region and create a bar chart" gets the job done instantly, right in your worksheet. This makes sophisticated analysis incredibly accessible, lowering the technical hurdle for anyone who knows their way around a spreadsheet.
Power BI and Tableau: The Dedicated BI Giants
On the other side of the spectrum, you have Microsoft Power BI and Tableau. These are the heavyweights—standalone platforms built from the ground up to connect to all sorts of data sources, pull everything together, and create stunning, interactive dashboards. They dominate the market for a reason. As of 2021, Power BI held over 30% of the market share, with Tableau following at around 17%.
Tableau is famous for its incredible visualization flexibility, giving data scientists the fine-grained control they crave. Power BI, however, shines with its seamless connection to other Microsoft tools like Azure and Microsoft 365, making it a natural choice for a wider business audience.
To get a broader look at the leading solutions out there, this guide on Top Business Intelligence Tools offers a great breakdown of features and pricing. Grasping these fundamental differences is the key to understanding the detailed comparison ahead.
A Practical Comparison of Business Reporting Tools
When you’re comparing business reporting tools, the right choice really comes down to one thing: how well does it actually fit into your team’s day-to-day work? Instead of just rattling off features, let’s look at how Elyx.AI, Microsoft Power BI, and Tableau really stack up in the areas that matter most for getting work done.
We'll start with the most fundamental piece of the puzzle—connecting to your data.
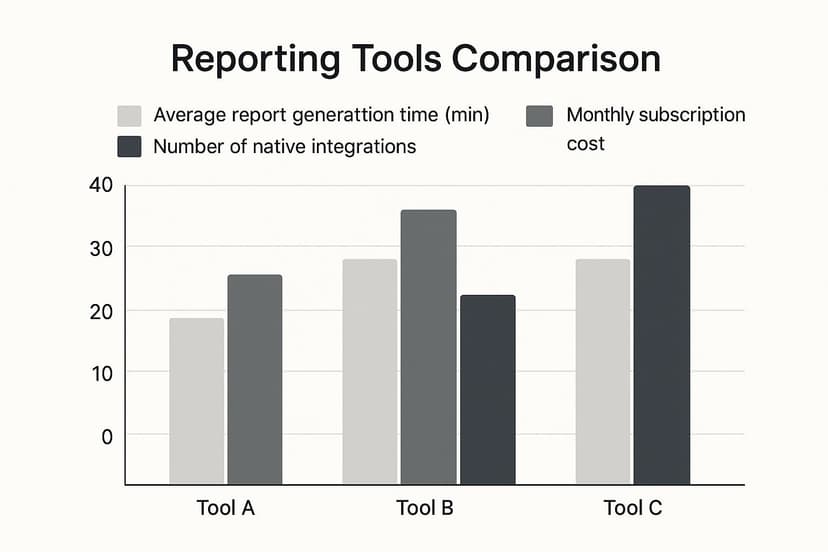
This quick overview highlights a key trade-off: while platforms like Power BI boast a vast number of native integrations, Elyx.AI focuses on drastically cutting down the time it takes to build reports, especially for teams living in Excel.
At-a-Glance Feature Comparison
To get a clearer picture, this table breaks down the core differences between these three powerful tools. It’s a quick way to see where each one shines, particularly for those familiar with Excel.
| Feature | Elyx.AI | Microsoft Power BI | Tableau |
|---|---|---|---|
| Primary Environment | Inside Microsoft Excel | Standalone Application & Cloud | Standalone Application & Cloud |
| Core Interaction | Natural Language Prompts (Typing) | Drag-and-Drop Interface | Drag-and-Drop Interface |
| Learning Curve | Very Low (Uses existing Excel skills) | Moderate to High (Requires DAX) | Moderate to High (Requires learning the tool) |
| Best For | Fast analysis & automation in Excel | Enterprise-level, cross-platform BI | Deep, interactive data visualization |
| AI Focus | Task automation & report generation | Augmented analytics & trend spotting | Data storytelling & insights |
| Sharing Method | Standard Excel files (.xlsx) | Published, interactive dashboards | Published, interactive dashboards |
As you can see, the choice isn't about which tool is "best," but which one aligns with your team's existing skills and reporting needs.
Data Connectivity and Integration
A reporting tool is useless if it can’t get to your data. Power BI and Tableau are the heavyweights here, built to connect to just about everything. They can pull from SQL databases, cloud warehouses like Snowflake, and hundreds of other apps right out of the box. For large enterprises with data scattered everywhere, this is a must-have.
Elyx.AI plays a different game. It lives and breathes inside Excel, so its philosophy is simple: if you can get your data into a spreadsheet, Elyx.AI can work with it. Whether that’s a direct database query, a CSV download, or just copying and pasting, it piggybacks on Excel's own data capabilities. This is a perfect fit for teams whose world revolves around spreadsheets.
Ease of Use and Learning Curve
Here’s where you’ll find the biggest philosophical divide. Both Power BI and Tableau use a drag-and-drop system for building reports. It's a visual way to work, but it hides a lot of complexity. To get truly good, you have to learn their specific languages and concepts—like DAX in Power BI or calculated fields in Tableau. For someone who just needs a quick chart, that’s a steep hill to climb.
Elyx.AI throws that entire model out the window. It works with natural language. You just type what you want.
The real magic of Elyx.AI is its conversational interface. You can literally ask it, "Show me the top 5 products by sales in Q3 and create a pie chart," and it builds it for you right there in the spreadsheet. It completely removes the "how-to" barrier of learning a new piece of software.
AI and Automation Capabilities
All three tools use AI, but for very different purposes. In Power BI and Tableau, the AI is mostly for "augmented analytics." It's great at finding outliers in your data, spotting trends you might have missed, or answering typed questions within its own dashboard environment.
Elyx.AI, on the other hand, focuses its AI on automating the tedious tasks analysts do inside Excel every single day. Here are some actionable examples:
- Automated Data Cleaning: Tell Elyx.AI to "standardize all date formats in Column C to MM/DD/YYYY" or "remove extra spaces from Column A," and it just does it. This is the kind of stuff that usually means writing formulas or wrestling with Power Query.
- Instant Summaries: You can highlight a block of data and simply ask for "a written summary of the key takeaways from this sales data." It’s a massive time-saver for drafting report commentary.
- Formula Generation: Instead of Googling a complex VLOOKUP or INDEX(MATCH) formula, you can just describe the logic you need, and Elyx.AI will write the correct Excel formula for you. For example, "Write a formula to find the price for the product ID in cell A2 from the table in Sheet2."
This laser focus on speeding up the work you’re already doing in Excel is a huge advantage for anyone who feels like they spend half their day cleaning and prepping data.
Data Visualization and Reporting
When it comes to creating beautiful, highly interactive dashboards, Tableau is widely seen as the gold standard. It gives you incredible control over every tiny visual detail. Power BI is also a powerhouse, with a huge library of visuals that work perfectly within the Microsoft ecosystem.
Elyx.AI doesn’t try to compete on that level. Its goal is to create clean, professional Excel charts and tables with maximum speed and minimum fuss. For many people, the objective isn't to build a museum-quality dashboard; it's to get a clear chart for a weekly report or a PowerPoint slide. Elyx.AI is optimized for exactly that—going from raw numbers to a finished chart in seconds.
If you are looking to build more advanced visuals, our guide on how to create a KPI dashboard offers some great practical advice.
Collaboration and Sharing Features
Power BI and Tableau are built for sharing reports across an entire organization. You publish your dashboards to their cloud services, where colleagues can view, comment on, and interact with the data—all managed with enterprise-grade security and user permissions.
Elyx.AI’s approach is far simpler because it’s based on a tool everyone already has: Excel. Since the reports are just standard .xlsx files, you share them the same way you share everything else—via email, Microsoft Teams, OneDrive, or Google Drive. It uses the collaboration systems your team already relies on, so there’s no need to introduce yet another platform.
For a closer look at tools designed specifically for finance departments, this guide to the best financial reporting software provides some excellent alternative perspectives.
Putting Usability to the Test in the Real World

A feature list on a website is one thing, but the real test of a reporting tool is how it actually performs when your team is up against a deadline. How does it feel to use it day-to-day? To find out, let's walk through three common business scenarios and see how each tool stacks up.
This isn't just about technical specs. It’s about the user’s journey—which platform helps them get answers quickly and which one adds frustrating friction to their workflow.
Scenario 1: The Marketing Manager's Last-Minute Campaign Report
We’ve all been there. A marketing manager just dumped campaign data into an Excel file. She has 30 minutes before a meeting and needs to know which channels drove the most conversions and slap a chart into her presentation.
How it Plays Out:
- With Elyx.AI: She stays right inside her Excel sheet. She types a simple request into the Elyx.AI chat: "Summarize conversions by marketing channel and create a bar chart showing the top 5." In just a few seconds, a sharp-looking summary table and a presentation-ready chart appear directly in her workbook. Done.
- With Power BI: The workflow is more involved. She’d have to open Power BI Desktop, import the Excel file, set up a basic data model, and then drag and drop fields to build the bar chart. It’s a powerful tool, but it forces her to leave Excel and jump through several hoops for a quick turnaround.
- With Tableau: The process mirrors Power BI. She'd connect to the Excel file as a data source, drag her dimensions and measures onto the canvas, and then format the chart. While the final visual can be stunning, it’s a multi-step process for what should be a straightforward task.
When you need answers from data that’s already in Excel, Elyx.AI’s native, AI-powered approach is undeniably faster. It eliminates the time-consuming steps of importing data and switching apps, giving you insights almost instantly.
Scenario 2: The Financial Analyst's Quarterly Earnings Dashboard
Now for a heavier lift. A financial analyst needs to build an interactive quarterly earnings dashboard. This isn't just one spreadsheet; it's a consolidation of data from the company's ERP, various sales CRMs, and a folder of historical Excel files.
How it Plays Out:
- With Power BI and Tableau: This is where these platforms truly shine. The analyst can connect directly to all those different data sources, build relationships between them, and construct a detailed, interactive dashboard. Features like drill-downs and cross-filtering are built-in, letting executives slice and dice the data themselves during the meeting.
- With Elyx.AI: Elyx.AI is a powerhouse for analyzing data within a spreadsheet, but it wasn't designed to be a complex data consolidation engine. The analyst would first need to get all the data into Excel—maybe using a tool like Power Query—before Elyx.AI could work its magic. It's a workable solution but adds a manual layer to the process.
This scenario really highlights the sweet spot for dedicated BI platforms. Their ability to connect and model data from multiple systems is essential for creating comprehensive, high-level financial reports. You can dig deeper into this by learning how to master Excel report automation to handle some of these data prep challenges.
Scenario 3: The Small Business Owner Tracking Sales
Let's think about a small business owner who doesn't have a data analyst on payroll. They just have a simple Excel sheet for tracking daily sales. All they want is to spot weekly trends and see which products are selling best, without having to go back to school to learn a new piece of software.
How it Plays Out:
- With Elyx.AI: The owner never has to leave their comfort zone: the spreadsheet. They can ask plain-English questions like, "What was my total sales revenue last week?" or "Show me my top 10 products by quantity sold this month." Elyx.AI delivers clear, immediate answers, no formulas or data modeling degree required.
- With Power BI and Tableau: The learning curve is a huge hurdle here. Even with free versions available, the time needed to understand how to connect data, create measures, and build a simple visual is often too much for a busy owner. For a non-technical user, the interfaces can feel overwhelming.
In this business reporting tools comparison, ease of use is everything. Elyx.AI’s conversational style makes data analysis truly accessible, empowering anyone who works in Excel to get real insights from their own data without needing specialized training.
What's the Real Price Tag on These Reporting Tools?
When you’re comparing business reporting tools, the monthly subscription fee is just the starting point. The real number you need to look at is the Total Cost of Ownership (TCO), which covers everything from setup and training to ongoing maintenance. A tool that looks like a bargain at first can easily become a budget drain once you account for all the extras.
Understanding the full investment is crucial. Companies are pouring serious money into these platforms—global spending on business intelligence software is expected to blow past $70 billion soon. U.S. companies are a huge part of that, spending nearly $27.3 billion themselves. This kind of investment makes it clear why looking beyond the sticker price is so important. For a deeper dive into these spending trends, check out this comprehensive market report.
Decoding the Pricing Models
Each tool has its own approach to pricing, and that’s often where you’ll find the hidden costs.
- Elyx.AI: Keeps things simple with a user-based subscription. Since it lives inside Excel, you don't have to worry about separate hosting or infrastructure fees, which makes its TCO very easy to predict.
- Microsoft Power BI: Microsoft Power BI uses a tiered model. There's a free desktop version, a per-user Pro plan, and a capacity-based Premium plan for larger organizations. The costs start climbing as you need more firepower, like dedicated servers or the ability to handle massive datasets.
- Tableau: Tableau also has role-based tiers (Creator, Explorer, Viewer). The total cost can add up fast as you license different user types across your company.
Sure, the free versions of Power BI and Tableau are great for a single user tinkering with data. But they don't have the sharing and collaboration features that teams actually need, which inevitably pushes you into their paid subscriptions.
The Hidden Costs: Getting Your Team Up to Speed
This is where the real expenses often hide—the time and money it takes to get your people using the tool effectively. The learning curve is a direct cost.
Tools like Power BI and Tableau are incredibly powerful, but they aren't simple. Getting good at them requires specialized skills. For example, you don't just casually pick up Power BI's DAX language or master advanced data modeling in Tableau. This reality often leads to a few "hidden" expenses:
- Hiring BI specialists or data scientists just to run the software.
- Shelling out for expensive training courses to get your team certified.
- Losing productivity as employees spend countless hours on trial-and-error instead of their actual jobs.
The game changes completely with tools that feel familiar from day one. Because Elyx.AI works inside Excel and understands plain English, the need for specialized training basically disappears. That directly slashes your TCO.
Think about it: an employee who already knows their way around a spreadsheet can start building AI-driven reports right away. This means you get value from the tool much faster, without having to rely on a small handful of data experts. It makes sophisticated reporting affordable and accessible for everyone on the team.
So, How Do You Actually Pick the Right Reporting Tool?
Choosing the right platform from a sea of options really boils down to your specific situation. There's no magic bullet or single "best" tool for every business. The right choice is the one that slots perfectly into your team's existing skills, daily habits, and what you’re trying to achieve with your reports. Let's cut through the noise and turn our comparison into some practical advice.
The real question isn't "which tool has the most bells and whistles?" It's "which tool solves our biggest headaches with the least amount of fuss?" A platform that's powerful on paper but takes weeks of training to do a simple task is a bad fit, plain and simple.
Finding the Best Fit for Your Team
To make this easier, let's match each tool to the people who will get the most out of it. Thinking this way helps you ignore the marketing hype and focus on how it'll actually work for you.
-
For the Power Excel User: If your team's world revolves around spreadsheets, Elyx.AI is a no-brainer. It injects smart AI reporting and automation right into the Excel interface they already know and love. This means no steep learning curve and no painful data migration. Anyone can ask complex questions in plain English and get answers, without needing to be a data guru.
-
For the All-In Microsoft Shop: For bigger companies that are heavily invested in the Microsoft 365 ecosystem, Power BI is the logical choice. It connects effortlessly with tools like Azure, SharePoint, and Teams, creating a unified analytics environment. It's built for enterprise-grade data management and security.
-
For the Data Visualization Artist: When your primary goal is to build beautiful, highly interactive dashboards for deep-dive analysis, Tableau is still the king. Data scientists and analysts who need absolute control over every chart, color, and filter will find its creative power is second to none.
The best reporting tool is one that plays to your team's strengths. Shoving a complex BI platform onto a team that lives in Excel just creates friction. But giving them AI inside the tool they use every day? That's an immediate productivity boost.
Picking your tool is a strategic move that will either supercharge your team's ability to use data or slow them down. By matching the platform to your people and your goals, you're not just buying software—you're making a smart investment.
Frequently Asked Questions
Jumping into the world of business reporting tools can definitely stir up some questions. Here are some straightforward answers to the things we hear most often from teams trying to pick the right tool for their business reporting tools comparison.
Can AI Tools Like Elyx AI Replace Traditional BI Platforms?
This comes up a lot, and the short answer is no—they're really built for different jobs. AI-native tools like Elyx.AI are designed to augment and accelerate the work you're already doing inside your spreadsheets. They handle the tedious stuff, find insights in your data, and let you run complex analyses with simple text commands. It's like giving Excel a superpower.
On the other hand, traditional BI platforms like Power BI and Tableau are meant to be the central data hub for a whole company. They pull information from dozens of different sources to create a single source of truth. Their main goal is to consolidate data for the entire organization, which is a much different mission than making an individual analyst faster and smarter in Excel.
The best way to think about it is that they work together. Elyx.AI gives the individual analyst a boost, while a big BI platform serves the company's high-level data strategy.
How Difficult Is Power BI for an Experienced Excel User?
If you're a seasoned Excel pro, Power BI will look familiar when you first open it. The ribbons, formulas, and general feel can trick you into thinking it's an easy transition. But that's where the similarities end. The real learning curve—and the source of its power—is mastering the Data Analysis Expressions (DAX) language.
DAX is a whole different beast compared to Excel formulas and takes a serious time investment to get right. You can make some basic charts with the drag-and-drop features, but to build the kind of dynamic, insightful dashboards that businesses need, you have to know DAX well. By contrast, Elyx.AI uses a natural language model, letting an experienced Excel user get sophisticated results almost instantly without having to learn a new coding language.
Do I Need a Data Warehouse for These Tools?
Not at all. This is a huge misconception that often stops smaller teams from even trying these powerful tools. While Power BI and Tableau are more than capable of connecting to massive data warehouses, all three tools we've looked at work perfectly fine with much simpler data sources.
You can easily connect any of them to basic files you already have, like:
- Microsoft Excel workbooks (.xlsx)
- Comma-separated value files (.csv)
- Text files (.txt)
This means any business can start building better reports, no matter how sophisticated its data setup is. You don’t need a team of data engineers to start pulling real value from the information you already have on hand.
Ready to bring the power of AI right into your spreadsheets? With Elyx.AI, you can stop wrestling with complex formulas and start getting answers in seconds. Try Elyx.AI for free and transform your Excel workflow today.
Reading Excel tutorials to save time?
What if an AI did the work for you?
Describe what you need, Elyx executes it in Excel.
Sign up