How to Insert an Excel Spreadsheet into PowerPoint: A Practical Guide

You can bring your Excel data into a PowerPoint slide in two main ways: linking it or embedding it. Think of linking as creating a live, dynamic connection to your original spreadsheet—perfect for automatic updates. Embedding, on the other hand, tucks a standalone, static copy of your data right into the presentation, which is ideal for sharing a final, self-contained document. Both methods are far more robust and professional than a simple copy and paste.
Why Connecting Excel and PowerPoint Is a Game Changer
We’ve all been there. You manually copy and paste a table or chart from Excel into your PowerPoint deck, only for the source data to change minutes later. Now you have to go back, find the right slide, and repeat the entire process, hoping you don't introduce a new error.
This isn't just a hassle; it’s a recipe for disaster in a professional setting. Relying on manual updates is how outdated figures end up in front of the board or how embarrassing typos slip through. The risk skyrockets when you're working on tight deadlines with last-minute data changes.
Spending too much time on Excel?
Elyx AI generates your formulas and automates your tasks in seconds.
Sign up →Imagine a finance team scrambling to update a dozen slides because a single variable in their forecast model was adjusted. This is where creating a direct, reliable connection between your spreadsheet and your presentation becomes an absolute necessity, not just a time-saving trick. It ensures accuracy and integrity in your reporting.
Linking vs. Embedding: Choosing Your Approach
So, how do you make this connection? You have two powerful options, and the one you choose depends entirely on the purpose of your presentation and how the data will be used.
-
Linking: This creates a dynamic bridge from your PowerPoint slide straight back to your Excel file. Change a number in the spreadsheet, and the table or chart in your presentation updates automatically the next time you open the file (after you approve the refresh). This is the ideal method for live dashboards and recurring reports where the data is always in flux.
-
Embedding: This approach is different. It essentially packages a fully functional, self-contained copy of the Excel workbook inside your PowerPoint file. This is perfect for when you need to send the presentation to someone who doesn't have access to the original Excel file. The data is static, but the recipient can still double-click the object to open and explore the full spreadsheet right there.
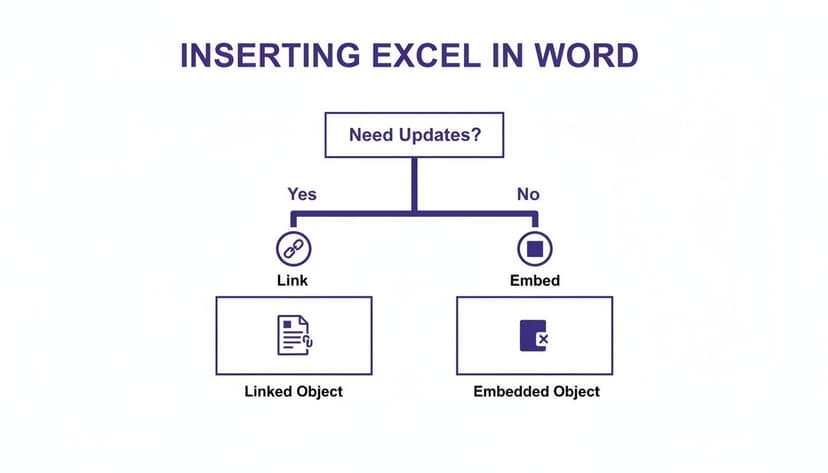
This simple flowchart lays out the decision perfectly. If you need your data to stay current, link it. If the presentation needs to be a self-contained package, embed it.
Here's a quick comparison to help you decide which technique is best for your presentation scenario.
Choosing Your Method: Linking vs. Embedding
| Feature | Linking | Embedding |
|---|---|---|
| Data Updates | Automatically reflects changes from the source file. | Stays static unless manually edited inside PowerPoint. |
| File Size | Keeps PowerPoint file size smaller. | Increases PowerPoint file size significantly. |
| Sharing | Requires recipients to have access to the source Excel file. | Creates a self-contained file; no external files needed. |
| Best For | Live reports, dashboards, and frequently updated data. | Final reports, archives, and sharing with external audiences. |
Ultimately, choosing the right method comes down to how your presentation will be used and who needs to see it.
With Microsoft 365 now the go-to productivity suite for an estimated 345 million paid users, knowing how to properly connect these two powerhouse applications is a fundamental skill. For the millions of us who crunch numbers in Excel but tell stories in PowerPoint, this integration is key to working smarter, not just harder.
Keep Your Slides Fresh with Live Excel Data
Nothing undermines a presentation faster than outdated numbers. When you're dealing with data that changes frequently—like sales figures, project tracking, or financial reports—a simple copy and paste just creates more work and introduces risk. You need a living connection between your spreadsheet and your slides.
This is where PowerPoint's Paste Special feature becomes your best friend. Instead of just dropping a static image of your data onto a slide, you’re creating a live window into your Excel file. When the numbers change in Excel, they automatically update in your presentation. It’s a game-changer for accuracy and efficiency.
How to Create the Live Link
First, open your Excel workbook. Highlight the exact cells you want to feature in your presentation, whether it's a summary table or a specific chart, and copy them (Ctrl+C).
Now, switch to PowerPoint. This is the crucial step: don't just hit paste.
- On the Home tab, find the Paste button. Click the small arrow underneath it to reveal more options.
- From the dropdown menu that appears, choose Paste Special.
A dialog box will pop up. To create the live connection, you must select the Paste link radio button on the left side. Then, from the list of formats, make sure Microsoft Excel Worksheet Object is selected.
Click "OK," and your Excel data will appear on the slide, not as a dead copy, but as a live, linked object.
Should You Link a Table or a Chart?
This method works perfectly for both data tables and charts, but knowing which one to use depends on the story you're trying to tell.
-
Link a Table when your audience needs to see the specific details. This is your go-to for budget reviews, detailed financial statements, or any scenario where the exact numbers are crucial. For example, a table of monthly expenses allows for a line-by-line review.
-
Link a Chart when you want to communicate the big picture instantly. A bar chart showing sales trends or a pie chart breaking down market share tells a story much faster than a grid of numbers. For instance, linking a line chart that tracks quarterly revenue provides an immediate visual summary of performance, which will update automatically with new data.
Pro Tip: This linking method is a lifesaver for recurring reports. Imagine you have a monthly business review deck. You just update your master Excel file, open PowerPoint, and let it refresh the links. Your entire presentation is ready in seconds, with zero risk of copy-paste errors.
Getting comfortable with linking your data is a core skill for anyone who presents numbers. To explore this technique and others in more detail, check out our complete guide on how to link Excel to PowerPoint. Mastering this will make your presentations more accurate, dynamic, and a whole lot easier to manage.
Embedding an Excel File to Create a Self-Contained Presentation

While linking creates a live connection, sometimes you need the exact opposite. Imagine sending a final proposal to a client or submitting a report to your boss. In those moments, you can't risk broken links or require the recipient to have access to your source files. You need the presentation to be a complete, self-contained package that works perfectly on its own.
This is where embedding an Excel file is the perfect solution. Instead of just creating a reference to your workbook, this method places a fully functional copy of the entire file right inside your PowerPoint slide.
What's the benefit? The recipient doesn't need access to the original source file on a shared drive or your local machine. Everything they need is right there, completely eliminating access issues and ensuring the data they see is exactly what you intended.
Using Insert Object for a Complete Package
The secret to embedding is found on PowerPoint's Insert tab. You'll want to skip the usual paste options and head straight for the Object command, which is typically tucked away in the "Text" group. Clicking this opens a dialog box that gives you a couple of ways to embed your Excel data.
The most straightforward choice here is Create from File. This lets you browse your computer for the exact Excel spreadsheet you want to insert. Once you've picked your file, you have another key decision to make: how it should appear on the slide.
Display as an Object or an Icon
How you choose to display the embedded file really depends on its purpose in your presentation.
-
Display as an Object: This option places a visual snapshot of your spreadsheet directly onto the slide. It looks like a static table at first glance, but it's much more powerful. Anyone can double-click it to open the full Excel interface right inside PowerPoint. They can scroll through rows, view formulas, and explore the data without ever leaving your presentation. This is great for showing a summary table that invites a closer look.
-
Display as an Icon: This is an excellent choice for supplementary data or detailed models that don't need to clutter the main slide. It places a clean Excel icon on your slide, and viewers can just double-click it to open the workbook. For example, you could place an icon on an appendix slide that contains the complex financial model behind your summary charts, keeping your primary slides clean while still offering full transparency.
By embedding your workbook, you create a robust, portable presentation. Your audience can interact with the full dataset, sort columns, or check formulas—all from within your slide deck. This builds trust and gives stakeholders the confidence to dig into the details if they choose.
Whether you're presenting a final budget or a detailed project plan, learning to embed ensures your message and your data arrive together, intact and accessible. For a deeper look into the specifics of this method, you can find more examples by exploring our other guides on embedding Excel into PowerPoint.
Let Your Charts Do the Talking: Linking Live Excel Data
Let's be honest, nobody likes a stale chart. Taking a screenshot of your Excel data and pasting it into PowerPoint is a recipe for outdated information. The real magic happens when your visuals update automatically as your numbers change. By linking an Excel chart directly into your presentation, you create a dynamic, living document that always tells the most current story.
This is a game-changer for anyone who delivers recurring reports, like monthly sales figures or quarterly performance reviews. Imagine never having to manually remake your charts again—you just update the spreadsheet, and your slides follow suit.

How to Create a Live Link for Your Chart
First, open your Excel file. Find the chart you want to bring into your presentation and click on the chart itself—not the data cells—to select it. A simple Ctrl+C will copy it to your clipboard.
Now, jump back into PowerPoint. Instead of just pasting with Ctrl+V, go to the Home tab and click the small arrow on the Paste button. This opens up a menu of paste options, and two of them are exactly what we need for linking.
- Use Destination Theme & Link Data: This is my go-to choice most of the time. It cleverly applies your PowerPoint presentation’s existing color scheme and fonts to the chart, making it look like it belongs there, all while keeping that crucial data link active.
- Keep Source Formatting & Link Data: Pick this one if you’ve already spent time styling your chart in Excel with specific brand colors or a unique look you want to keep. It preserves the original formatting and creates the live link.
Once you choose one of these, you’ve built a bridge between your spreadsheet and your slide. Any time you update the source data in Excel, a quick refresh in PowerPoint will pull in the latest version of your chart. If you want to build more sophisticated visuals before linking, take a look at our guide on making 3-D charts in Excel.
Why This is More Than Just a Timesaver
This method perfectly blends the strengths of two powerhouse tools. Analysts and number-crunchers live in Excel, but executives and stakeholders understand stories told through slides. Given that 54% of businesses still rely on Excel as their primary tool for business intelligence, connecting it seamlessly to PowerPoint is a must-have skill.
Static images just don't cut it anymore when audiences expect real-time, interactive data.
When you link a chart, you're doing more than just pasting an image—you're embedding a single source of truth. This keeps your data consistent and completely eliminates the panic of last-minute updates, making your entire process faster and more reliable.
To really make your charts pop, remember that consistent visuals are key. Taking a moment for mastering color management ensures your brand stays sharp and professional, whether viewed on a laptop or a projector screen.
How to Manage and Refresh Your Linked Data
You've created a live link between your Excel sheet and your PowerPoint slide. That’s a great start, but the real power comes from knowing how to manage that connection effectively. This is what separates a dynamic, always-accurate presentation from one riddled with broken links and old numbers.
Your mission control for all linked files is the Edit Links to Files dialog box. To access it, navigate to File > Info. On the right-hand side, look under the "Related Documents" section, and you'll find the link to open it. This window is a lifesaver—it shows you every single external file your presentation is connected to, where it lives, and its current status.

Keeping Your Data Current
Once you're in the "Edit Links to Files" window, you'll see a few commands that give you total control. Getting familiar with these is the key to keeping your presentation's data trustworthy.
- Update Now: Think of this as your manual refresh button. Made a last-minute change to the Excel numbers while your PowerPoint was open? Hit this, and PowerPoint will instantly pull in the latest data. It's perfect for those real-time tweaks right before you present.
- Open Source: This one is a simple but incredibly handy shortcut. It opens the linked Excel file directly, so you don't have to go digging through folders just to double-check a figure or make a quick edit.
- Change Source: This is your go-to tool for fixing a broken link. If you move or rename the source Excel file, PowerPoint loses track of it. "Change Source" lets you quickly point PowerPoint to the file's new location and re-establish the connection.
Troubleshooting and Finalizing Your Presentation
We’ve all seen it: the dreaded "linked file is unavailable" error. Nine times out of ten, it just means the source file was moved, renamed, or deleted. The "Change Source" button is your first line of defense. A pro tip to avoid this mess altogether is to keep your presentation and its linked Excel files in a stable, shared folder, especially if you're working with a team.
Key Takeaway: When you're ready to send the final presentation to someone outside your organization, you might want to break the links for good. The "Break Link" option converts your live chart or table into a static picture. This locks in the data and prevents the recipient from getting any annoying update prompts or errors.
With your data linked and your refresh process sorted, you might be thinking about how to make the reporting itself more efficient. If you want to dive deeper, our guide on how to automate Excel reports has some fantastic tips for building smarter workflows.
Pro Tips and Common Mistakes to Avoid
Once you've mastered the basics, a few professional habits can make your presentations far more reliable. One of the most powerful tricks is to use Named Ranges in Excel before you link.
Instead of grabbing a generic range like A1:D10, give that area a clear name, such as "Q3_Sales_Data". When you link to this named range, the connection is incredibly resilient. You can add rows or columns outside that area, and the link won't break—a common headache when working with dynamic spreadsheets. For instance, you could summarize monthly sales with a formula like =SUM(Sales_Jan) and link the result, ensuring your presentation always pulls the correct total even if the underlying data shifts.
Keep Your Files Together When Collaborating
File paths are the number one cause of broken links when working on a team. A link to a file on your local C: drive works perfectly for you, but the second a colleague opens the presentation, it's broken.
The solution is simple: always store your PowerPoint and the Excel file it links to in the same shared folder. This could be a shared network drive, a SharePoint site, or a cloud folder in OneDrive. This single discipline ensures anyone on the team can open the presentation and refresh the data without a problem.
Key Takeaway: Think of your presentation and its source file as a matched set. If you move one, move the other to the same relative location. This simple mindset prevents the vast majority of broken link errors.
Sidestepping Common Pitfalls
Even experienced users can slip up under pressure. Here are a few common traps to watch out for.
-
Forgetting to Refresh: This is the most critical one. Always refresh your data right before you present. Navigate to File > Info > Edit Links to Files and click "Update Now" to ensure you are showing the absolute latest numbers.
-
Sending Orphaned Files: If you email a presentation with linked data, you must also send the Excel file. If you don't, your recipient will see errors. If you cannot share the source data, either embed the objects or break the links before sending.
-
Using the Wrong Tool for the Job: Think about your goal. Don't embed a massive, multi-megabyte spreadsheet when a simple, lightweight link will suffice. Conversely, don't use a link if you need to send a self-contained, static report that will never change.
Ultimately, a solid presentation starts with solid data. To get your source files in top shape, check out our guide on data cleaning best practices.
Got Questions? I've Got Answers
Let's tackle some of the most common questions that pop up when you're getting Excel and PowerPoint to play nicely together. These are the small snags that can slow you down, so let's get them sorted.
Will My Linked Excel Data Automatically Update in PowerPoint?
Not exactly in real-time, which is intentional. When you link data, PowerPoint won't change your content without permission.
Instead, when you open the presentation, you will typically get a security prompt asking if you want to update the links. You can also manually refresh the connection by going to File > Info > Edit Links to Files and clicking "Update Now." This system gives you control, preventing your presentation from slowing down or showing unwanted changes.
What's the Real Difference Between Linking and Embedding?
This is a crucial distinction, and choosing the right one can save you a lot of headaches.
-
Linking creates a live connection to your external Excel file. Your PowerPoint file stays small, and whenever you update the Excel sheet, the changes can be pulled right into your slides. The source file must be accessible.
-
Embedding places a full copy of the Excel data into your presentation. The file gets bigger, but it becomes a self-contained package. The downside? It's now completely disconnected from the original spreadsheet.
My rule of thumb: Use linking for dashboards and reports that need to stay current. Go with embedding for final, one-off presentations you're sending out, especially if the recipients won't have access to the original Excel file.
How Do I Fix a Broken Link in My Presentation?
It happens to the best of us. You move or rename the source Excel file, and suddenly PowerPoint can't find it. The fix is straightforward.
Navigate to File > Info > Edit Links to Files. You'll see the broken link listed there. Just select it, click Change Source, and point PowerPoint to the new location of your Excel file. Click Open, then Update Now, and you should be back in business. To prevent this, always try to keep your presentation and its source Excel file in the same folder.
Ready to stop wasting time on manual Excel tasks? Elyx.AI acts as your autonomous data expert directly within your spreadsheet. Describe what you need—from data cleaning to full report generation—and watch it get the job done in seconds. Start your free trial and save hours of work at https://getelyxai.com.
Reading Excel tutorials to save time?
What if an AI did the work for you?
Describe what you need, Elyx executes it in Excel.
Sign up