Count Blank Cells Excel: 4 Essential Methods & AI Tips

You open a workbook from a colleague, scroll a few rows, and the problem shows up fast. Sales dates are missing, status fields are half-filled, and some cells look empty but contain formulas. If you start building pivots or KPI summaries before checking those gaps, your analysis can drift off course without any obvious warning.
That’s why count blank cells Excel work is never just about finding a formula. It’s a data quality check. It tells you whether the sheet is ready for reporting, whether a team skipped inputs, and whether “blank” really means missing or just hidden behind a formula.
If your data came from exported forms or scanned documents, this problem often starts before Excel. In those cases, good PDF to Excel converter tools can reduce the cleanup burden before the file even reaches your workbook. And if you want the broader framework behind this kind of cleanup work, this guide on data preprocessing in Excel workflows is a useful companion.
Spending too much time on Excel?
Elyx AI generates your formulas and automates your tasks in seconds.
Sign up →Why Counting Blank Cells is a Critical First Step
A blank cell can mean several different things. Sometimes the value is missing. Sometimes a formula returns "", so the worksheet looks complete until you audit it. Sometimes a user entered a space, which looks blank to the eye but isn't blank to Excel.
That difference matters because downstream formulas treat those cases differently. A pivot table, dashboard, or reconciliation sheet can give a clean-looking result while still hiding incomplete records.
What blank counts tell you early
When I audit a new workbook, I usually want three answers before anything else:
- Which columns are incomplete
- Whether the blanks are real blanks or formula blanks
- Whether the gaps are isolated or spread across the whole dataset
Those answers shape the rest of the cleanup process. If one field is mostly complete and only a few rows are missing data, manual review may be enough. If gaps are scattered across key columns, the workbook needs a stronger validation pass before reporting.
Practical rule: count blanks before you sort, filter, merge, or summarize anything. It’s the fastest way to see whether the sheet is analysis-ready.
Why this check prevents bad reporting
Missing values don't always trigger an error. Excel often keeps calculating. That’s what makes blank-cell issues expensive in practice. The file still opens, formulas still run, and charts still render. But the result may be incomplete.
This is especially common in operational sheets. You’ll see order dates missing from a shipping tracker, review scores missing from a feedback table, or contact fields missing in CRM exports. Counting blanks gives you a fast signal that something needs attention before those omissions affect totals, trends, or exception lists.
Using the COUNTBLANK Function for Quick Counts
When I need a fast answer, COUNTBLANK is the first formula I reach for. It does one job cleanly. It counts empty cells in a selected range.

The basic formula
The syntax is simple:
=COUNTBLANK(range)
Example:
=COUNTBLANK(A2:D100)
That formula checks every cell from A2 to D100 and returns one number. If you're doing count blank cells Excel checks for a raw total, this is usually the right starting point.
Microsoft documents that COUNTBLANK has been part of Excel’s statistical functions since at least Excel 2007, and in Microsoft’s example, =COUNTBLANK(A2:B4) returns 2 when the range contains two blank cells (Microsoft COUNTBLANK documentation).
What COUNTBLANK counts and what it ignores
Users often get tripped up because COUNTBLANK doesn't just count visibly empty cells. It also counts cells where a formula returns an empty string, like this:
=IF(B2>10,"OK","")
If the result is "", COUNTBLANK treats that cell as blank.
It does not count:
- Zeros
- Text values
- Error values
- Cells that contain only spaces
That last one causes a lot of confusion. A cell with a single space looks empty on screen, but Excel sees content there. So if your count looks lower than expected, inspect suspicious cells with the formula bar or use LEN() to test for hidden characters.
Cells that “look blank” and cells that Excel considers blank are not always the same thing.
When COUNTBLANK works best
Use COUNTBLANK when the question is straightforward:
- You want a total gap count in one range.
- You’re checking one table or one block of data.
- You need a quick audit number before deeper cleanup.
A few practical examples:
=COUNTBLANK(E:E)to see how many entries are missing in one column=COUNTBLANK(B2:G2)to check how many fields are missing in a single record=COUNTBLANK(Table1[Email])if you're working inside a structured table and just need a whole-column count
Where COUNTBLANK falls short
COUNTBLANK is excellent for simple totals. It is not the best tool when you need logic layered on top, such as counting blanks only for one team, one region, or only in visible rows after filtering. It also accepts only one range argument, so scattered form sections need a workaround.
If your question is “how many blanks exist here,” use COUNTBLANK. If your question is “how many blanks exist here under these conditions,” move to the next group of formulas.
3 Alternative Formulas for Conditional Blank Counting
Once you move beyond a basic total, COUNTBLANK starts to feel too limited. Most real spreadsheets need context. You don't just want to know how many cells are empty. You want to know which blanks matter.
That’s where alternative formulas earn their place. Some are cleaner, some are more flexible, and some are best kept for specific edge cases.
Comparison of Blank Counting Methods
| Method | Best For | Handles Conditions? | Ease of Use |
|---|---|---|---|
COUNTIFS |
Counting blanks that match one or more criteria | Yes | High |
SUMPRODUCT |
Complex logic across multiple conditions | Yes | Medium |
ROWS()-COUNTA() |
Quick completeness check for a whole column | No | High |
Method 1 with COUNTIFS
If your dataset has categories, teams, regions, or statuses, COUNTIFS is usually the cleanest choice.
Example:
=COUNTIFS(C2:C100,"",B2:B100,"East")
This reads as: count blank cells in column C, but only where column B equals East.
It’s practical because it lets you audit missing data by business segment instead of just getting one global total. A commonly used pattern is counting blanks inside a subset, such as COUNTIFS(A5:A16,"A",C5:C16,"") returning 2 blanks for Group A, which is highlighted in the referenced example on this Excel COUNTIFS and blank-counting walkthrough.
That kind of conditional check matters because a dataset can look healthy overall while one segment is incomplete. The same source notes, in a 2026-contextualized Forrester reference, that blank cells comprise 25% of data quality errors in financial models.
For more formula patterns built around this function, this guide to COUNTIFS in Excel is worth keeping handy.
Why I use COUNTIFS first for conditional work
COUNTIFS is readable. If someone else opens your workbook later, they can usually understand the logic without decoding an array formula. That makes it the best default for shared files.
Use it when:
- The rule is clear and based on standard criteria
- You want maintainable formulas that teammates can edit
- Your conditions line up row by row across normal ranges or table columns
Method 2 with SUMPRODUCT
SUMPRODUCT is the formula I keep for messier logic.
Example:
=SUMPRODUCT(--(B2:B100="East"),--(C2:C100=""))
This produces the same kind of result as the COUNTIFS example above, but it gives you more flexibility if you start layering conditions that don't fit nicely into standard criteria syntax.
It’s powerful, but there’s a trade-off. The formula is harder to read, easier to break, and less friendly for casual Excel users. In team files, that matters.
Working rule: use
SUMPRODUCTwhen Excel’s simpler counting functions stop fitting the question, not before.
A few situations where SUMPRODUCT helps:
- Mixed logical tests across several ranges
- Custom blank definitions, such as treating trimmed empty strings as blank
- Advanced models where you’re already using array-style logic elsewhere
Method 3 with ROWS minus COUNTA
For a quick completeness estimate, this method is still useful:
=ROWS(A2:A100)-COUNTA(A2:A100)
The idea is simple. ROWS gives the number of cells in the range. COUNTA gives the number of non-empty cells. The difference is the count of blanks.
This is good for rough audits, especially when you’re checking one input column and want a quick answer without introducing another dedicated function. But it has limits.
It can mislead you if your definition of “blank” is more nuanced. Depending on the content, COUNTA may not behave the way you expect with formulas returning empty strings or cells containing invisible characters. That’s why I treat this as a high-level check, not the final word in a data audit.
Which one should you choose
If you want a practical decision rule, use this:
- Pick
COUNTIFSwhen the business question includes words like “for region,” “for team,” or “for status.” - Use
SUMPRODUCTwhen you need custom logic and don't mind a more technical formula. - Keep
ROWS()-COUNTA()for quick overview checks, not detailed validation.
The best formula isn't the most advanced one. It’s the one that stays accurate when someone filters the sheet, adds new rows, or comes back to the file next month.
How to Count Blanks in Filtered Rows and Multiple Ranges
Counting blank cells in Excel can become annoying. A formula can be technically correct and still answer the wrong question.
If you filter a list to show only one product line or one manager, COUNTBLANK still counts blanks in hidden rows. And if your sheet has separate form sections, COUNTBLANK won't let you pass multiple ranges at once.
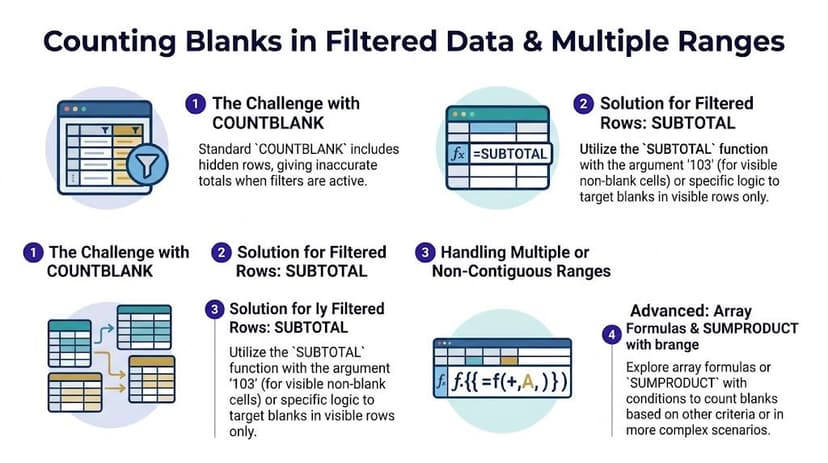
Counting blanks in filtered rows
When a filter is active, the usual blank count often stops being useful because it ignores visibility. In those cases, SUBTOTAL is the formula family to look at.
A common visible-rows pattern is built from two subtotal calculations:
=SUBTOTAL(3,A2:A100)-SUBTOTAL(103,A2:A100)
The exact setup depends on what you’re counting and how your data is structured, but the key idea is the same. SUBTOTAL can respect filters, which makes it better suited for visible-only analysis than COUNTBLANK.
If you want a refresher on the function itself, this reference on Excel SUBTOTAL formulas is a good shortcut.
Here’s a short visual walkthrough before the next edge case:
Counting blanks across multiple ranges
The second trap is non-contiguous data. You might have values in A1:A50, C1:C50, and E1:E50, and want one combined blank count. Many people try this:
=COUNTBLANK(A1:A50,C1:C50,E1:E50)
Excel rejects it. As documented in the referenced discussion, users commonly hit a “too many arguments” error when trying this pattern with COUNTBLANK across non-contiguous ranges (Ablebits discussion of COUNTBLANK limitations).
The clean workaround is often the simplest one:
=COUNTBLANK(A1:A50)+COUNTBLANK(C1:C50)+COUNTBLANK(E1:E50)
That approach is easier to audit than forcing a complex array formula into the sheet.
What works and what doesn't
- Works well: summing separate
COUNTBLANKformulas for separate blocks - Works well: using
SUBTOTALlogic when filters matter - Usually doesn't work well: trying to force one
COUNTBLANKcall to accept multiple ranges - Needs caution: dynamic tables with filters, especially when formula blanks and visible rows mix together
If your workbook has filters, ask “visible blanks or all blanks?” before you write the formula. That one choice changes the method.
The 1-Prompt Method to Count Blanks with ElyxAI
Formula knowledge matters, but there's a point where the overhead becomes problematic. You stop spending time on analysis and start spending time remembering syntax, checking hidden rows, and debugging edge cases.

When prompting is faster than building formulas
In a modern Excel workflow, a plain-language request can be more practical than composing three different formulas for three different situations. Instead of deciding between COUNTBLANK, COUNTIFS, and SUBTOTAL, you can ask for the result directly.
Examples of useful prompts:
- Count the blank cells in the Shipping Date column
- Count visible blanks in the filtered Sales Amount column
- How many rows are missing either Email or Phone Number
- Check all form sections and count empty fields
That matters most when the workbook is messy. Scattered input blocks, filtered tables, and formula-generated blanks are exactly the cases where manual formulas become slow to maintain.
Why this approach changes the workflow
The benefit isn't just convenience. It removes the need to map each problem to a specific Excel function before you can even begin. That's especially helpful for teams who know what they need from the sheet but don't want to spend time translating that need into formula logic.
If you want to try that inside Excel, the setup guide for installing the ElyxAI Excel add-in shows how to get the chat panel running.
A good AI workflow also reduces a common failure point in blank analysis. People often use the right formula in the wrong context. They count all rows when they meant visible rows, or they count visual blanks without noticing hidden spaces. Natural-language automation can reduce that mismatch because the request starts from intent, not syntax.
The fastest blank count is often the one you never have to debug.
Moving From Counting Blanks to Taking Action
Counting blanks is the diagnosis. Cleaning them is the actual work.
Once you know where the gaps are, the next decision is operational. Do you remove incomplete rows, fill them with a placeholder like N/A, send them back for correction, or keep them blank and flag them in reporting logic? The right choice depends on the field. A missing comment might be tolerable. A missing invoice date usually isn't.
A simple action framework
- Fill with a standard value: useful for non-critical descriptive fields
- Flag for review: better for compliance, finance, and client-facing records
- Exclude from analysis: appropriate when incomplete rows would distort a metric
- Correct at source: the best option when the same blanks keep reappearing in recurring files
The harder cases are dynamic ones. Filtered tables, formula-generated blanks, and changing datasets create more room for mistakes, and the referenced note points out that handling blanks in dynamic contexts is a persistent challenge for BI work, especially when professionals spend meaningful time debugging data quality issues in Excel workflows (dynamic blank-counting context and BI debugging discussion).
If your next step is cleanup rather than just diagnosis, this article on Excel AI data cleaning workflows is a practical follow-up.
The best process is simple. Count first. Classify the blank type. Decide the business rule. Then apply the fix consistently.
If you want to skip the formula juggling and let an AI agent handle blank counts, filtered rows, cleanup, formatting, and follow-up actions directly inside your workbook, try Elyx AI. It works as an Excel add-in, accepts plain-English requests, and carries out the spreadsheet work for you instead of only suggesting formulas.
Reading Excel tutorials to save time?
What if an AI did the work for you?
Describe what you need, Elyx executes it in Excel.
Sign up