5 Actionable Ways to Convert an Image to a Table in Excel (2026 Guide)

Let's be honest: manually typing data into Excel from an image is a soul-crushing task. Thankfully, it's also completely obsolete.
If you’ve ever found yourself squinting at a screenshot, a grainy photo of a report, or a PDF, painstakingly re-entering numbers one cell at a time, you know the pain. It’s slow, boring, and a surefire way to introduce typos. The good news is that with the power of artificial intelligence, you can get that time back.
Why You Should Never Manually Type Data Again
The technology that makes this all possible is Optical Character Recognition (OCR). It’s a term for AI that can read text from an image. Excel now has this built right in with its Data from Picture feature, turning what used to be hours of manual work into a process that takes just a few clicks. This isn't some far-off futuristic idea—it's a practical, AI-powered tool you can use today to solve a real problem.
Spending too much time on Excel?
Elyx AI generates your formulas and automates your tasks in seconds.
Sign up →Think about the real cost of doing this by hand. A 2023 McKinsey report found that repetitive tasks can eat up 28% of a professional's week. That's over 11 hours you could be spending on work that actually matters. For the 89% of Fortune 500 companies relying on Excel, automating a simple task like grabbing data from a tax form photo or a campaign ROI screenshot is a massive productivity win.

When you use the Data from Picture tool, Excel even shows you the data it extracted and flags any cells it's unsure about. This lets you quickly review and correct any mistakes before dropping the final table into your spreadsheet, giving you a new and immediately applicable skill.
Work Smarter, Not Harder with AI in Excel
Moving away from manual data entry is the first step toward a much more efficient workflow. Instead of just converting one-off images, you can start to think about building automated processes around your data. This is where artificial intelligence really begins to shine within Excel.
By eliminating manual data entry, you reclaim valuable time for what really matters: analyzing data, finding insights, and making informed decisions.
The benefits are immediate and obvious:
- Blazing Speed: A 50-row table that might take an hour to type can be converted in under 10 seconds.
- Fewer Errors: AI is far more consistent than the human eye, drastically cutting down on typos.
- More Meaningful Work: Free up your time to focus on strategy and analysis instead of mind-numbing transcription.
Once you get the hang of this, you'll start seeing opportunities for automation everywhere. If you want to go deeper, our guide on what workflow automation is can show you how to completely change the way you work.
1. Use Excel's Built-In "Data from Picture" Feature
Believe it or not, one of the best tools for pulling a table from an image is already built right into Excel. Before you go hunting for third-party apps, your first stop should always be the native Data from Picture feature. It's surprisingly capable for most day-to-day tasks, especially if you're dealing with clean screenshots or well-lit photos.
Microsoft packed this feature into the Microsoft 365 suite, and it uses AI-powered Optical Character Recognition (OCR) to figure out where your rows and columns are. It then does its best to transcribe everything into an editable format. The best part is that it works two different ways, depending on where your image is.

Starting from Your Desktop
This is my go-to method for grabbing tables from things I already have on my computer, like a PDF report, a slide from a webinar, or a data table on a website. It’s incredibly fast.
Just head over to the Data tab in Excel. Look for the Get & Transform Data section, click From Picture, and you’ll see two options:
- Picture From File: This one’s straightforward. It opens a window so you can find a saved image file (.JPG, .PNG, etc.) on your hard drive.
- Picture From Clipboard: This is perfect for screenshots. Just use your favorite snipping tool (I use the built-in Windows shortcut, Win + Shift + S), copy the table, and select this option. No need to save a file first.
Once you’ve fed it the image, Excel takes a moment to analyze it. A "Data from Picture" pane will pop up on the right. Now, this next part is crucial.
The review pane is your quality control step. Excel is smart, but not perfect. It highlights any cells in red where it's not confident about the data it read. This is your chance to be the human in the loop and fix things before they mess up your spreadsheet.
Don't just blindly click "Insert." Take a minute to click on each red-highlighted cell. Excel will show you a close-up of that spot on the original image, so you can easily type in the correct value. I even recommend spot-checking a few of the non-highlighted cells, just to be safe. Once you're happy with it, hit Insert Data, and the table will appear in your worksheet.
Capturing Data on the Go
The Excel mobile app makes this whole process even more immediate. Think about this scenario: you're at a conference, and a speaker flashes a slide with some juicy industry stats. Instead of trying to scribble it all down, you can just snap a picture.
Here's how simple it is on your phone:
- Open the Excel app and tap the Insert icon at the bottom.
- Choose Data from Picture.
- Your camera will open. Line up the shot so the entire table fits inside the red border. A good, flat angle with plenty of light makes a huge difference here.
- Snap the picture. The app processes it and gives you the same review screen you see on the desktop.
This is a game-changer for anyone who deals with physical documents—invoices, printed reports, price lists, you name it. You can digitize that information on the spot and have it waiting for you in an editable spreadsheet by the time you get back to your computer. Mastering this one built-in feature can save you a surprising amount of time.
2. When to Use a Dedicated Online OCR Tool
Excel's "Data from Picture" feature is a great first-line defense, but let's be honest—it's not a silver bullet. I’ve seen it stumble on more than a few real-world documents. Think blurry screenshots, photos of pages with weird shadows, or tables that have handwritten notes scribbled in the margins.
When you run into those kinds of roadblocks, it's time to bring in a specialist.
That's where dedicated Optical Character Recognition (OCR) tools come into play. These are web-based platforms built for one thing and one thing only: pulling text and data from images with extreme accuracy. They tend to have more powerful AI models that have been trained on a massive variety of documents, which gives them a real edge on the tricky stuff.
The process is usually dead simple. You just upload your image, the tool works its magic, and you get a downloadable file—often with a direct-to-Excel (.xlsx) option. This is my go-to move when I need to convert an image to a table in Excel and the built-in feature just isn't getting the job done cleanly.
Don't Skip the Post-Conversion Cleanup: 2 Essential Excel Formulas
Even with the best tools, you’re not always going to get a perfect-out-of-the-box result. A quick cleanup in Excel is almost always necessary to make sure your data is actually usable. You'll often find sneaky little errors, like extra spaces or invisible non-printable characters, that can completely wreck your formulas and sorting.
Thankfully, Excel has two perfect little functions to handle this mess: TRIM and CLEAN.
- The
TRIMFunction: This is your best friend for getting rid of extra spaces. It zaps any leading or trailing spaces and ensures there’s only a single space between words. - The
CLEANFunction: This one is for the stuff you can't see. It removes all non-printable characters that OCR software sometimes adds by mistake.
I almost always use them together. If your messy data starts in cell A2, you can create a new column and pop in this formula:
=TRIM(CLEAN(A2))
How It Works: This formula provides a practical solution by tackling the problem from the inside out.
CLEAN(A2)runs first, stripping out any bizarre, non-printing characters. Then,TRIMtakes that result and tidies up all the extra spaces. What you're left with is clean, uniform data that’s ready for real work.
Once you’ve applied the formula down your entire column, just copy the clean data and use Paste Special > Values to overwrite the original, messy cells. It's a two-minute trick that can save you hours of headaches.
If you're looking for solutions that can automate this cleanup process for you, it's worth seeing how an image to Excel AI tool can handle both the conversion and the cleaning in one step.
3. Go Beyond Conversion: Automate Your Entire Workflow with an AI Assistant
Getting data from an image into Excel is a solid win, but let's be honest—it's usually just the beginning. The real work starts after the data is in the spreadsheet. What if you could skip all the tedious steps that follow? I'm talking about cleaning the data, creating charts, and even formatting a report, all from a single, simple instruction.
This is where AI assistants like ElyxAI are changing the game. They treat the image-to-table task not as the end goal, but as the first domino in a much larger analytical process. It’s the difference between using a simple data scraper and having a savvy AI colleague who just gets the project done for you.
From Simple Command to Complete Report
Think about a real-world scenario. You have a screenshot of regional sales figures from a PDF report. The old way involves converting the image, then manually building out your analysis.
With an AI assistant, your workflow could look like this. You give it one command:
"Take this screenshot of regional sales data, clean it up, create a pivot table summarizing sales by region, and build a bar chart from it."
The AI agent then gets to work, executing each step on its own. This doesn't just save you the five minutes of typing in data; it saves you the next hour of cleaning, pivoting, and visualizing. This is a fundamental change in how we can interact with Excel, turning it from a hands-on tool into a partner that responds to your needs. This is possible through advanced AI concepts like Agentic Engineering, which allows the tool to handle complex, multi-step tasks.
The Real Cost of Manual Data Work
The need for this kind of automation is crystal clear when you look at the time we all waste. A Forrester study from a few years back found that data analysts can spend up to 80% of their time just on data preparation—which includes tedious jobs like retyping information from scanned documents. That’s a massive productivity drain on any business.
How an AI Assistant is Different
So, what makes an AI assistant more powerful than the standard OCR or built-in Excel features? It boils down to a few key advantages:
- It Understands Context: An AI agent doesn't just "see" a table. It understands that "Q2 Sales" is a header, not just text, and that "€1,234.56" is a currency value that should be a number, not a string of characters.
- It Executes Multi-Step Instructions: You can give it a complex request, and it will break it down into a logical sequence of actions—convert, clean, pivot, chart—and run them in the right order.
- It Handles the Data Cleaning for You: The assistant can automatically fix common messes like extra spaces, inconsistent date formats, or numbers that were accidentally imported as text.
For instance, after converting a product list, you could just say, "Separate the product code and name into two columns, then sort by price." The AI does it right there in your sheet. No formulas, no manual splitting.
This integrated, AI-driven approach is a huge time-saver. Instead of juggling different tools and performing a dozen manual steps, you can have a single, smart assistant manage everything inside Excel. If that sounds like the upgrade your workflow needs, it’s worth checking out what an Excel AI assistant can do for your projects.
4. Use Power Query and PDF Tools for Complex Documents
When you're dealing with a massive, multi-page PDF report, the simple "Data from Picture" feature just won't cut it. Trying to screenshot dozens of pages is a nightmare. For these complex jobs, you need a more serious, automated approach.
This is where we combine a dedicated PDF-to-Excel tool with Excel's own data-wrangling powerhouse, Power Query. The idea isn't just to pull data once; it's to build a hands-off, repeatable system for those recurring reports that land on your desk every month. Think month-end closing or budget consolidation.
The 2-Stage Approach: Extract, Then Transform
I like to think of this as a two-stage process: first extraction, then transformation.
You start by using a specialized PDF converter to rip all the tables out of the document and dump them into a single Excel file. Don't worry about the output; it's going to be a mess. You’ll likely end up with a workbook full of separate sheets, each containing a raw table, complete with funky formatting and extra junk. This is actually what we want.
Once you have that raw data dump, you fire up Power Query. This is where the AI-assisted automation happens. Power Query connects to your messy Excel file, cleans up the data according to rules you set, and loads a perfectly structured table into a new, clean worksheet. You can dive deeper into this concept in our guide on how to convert a PDF to Excel with AI, which covers similar automation principles.
This method turns a chaotic data dump into a clean, unified table. You build the cleaning logic once in Power Query, and for every subsequent report, you simply drop the new raw file in and hit "Refresh."
Building a Repeatable Data Pipeline in 4 Steps
The real beauty here is that Power Query remembers everything you do. Every step—from removing blank rows and splitting columns to un-pivoting data—is recorded as a query. You build this workflow once, and you can run it forever.
Here’s what that looks like in practice inside Power Query:
- Connect to the Source: First, point Power Query to the folder where you save the raw Excel files from your PDF tool.
- Combine and Stack: Tell it to grab all the data from every sheet and file in that folder and stack it into one giant table.
- Clean and Reshape: This is where you apply all your cleaning rules to standardize the data. You might filter out useless rows, set the first row as headers, or fix data types (like turning "text" numbers into actual numbers).
- Load the Final Table: Finally, you load the pristine data into a new Excel sheet, ready for your pivot tables and charts.
This is an incredibly useful skill. For example, learning to convert bank statements to Excel is a perfect real-world use case for this exact process. Once you build this automated pipeline, you’ll save yourself hours of tedious work and ensure your reports are always consistent.
5. Choose the Right Conversion Method for Your Task
So, you have a picture of a table and you need it in Excel. What's the best way to get it there? The truth is, there’s no single "best" method. The right choice really depends on what you’re trying to accomplish.
Think of it like this: you wouldn't use a sledgehammer to hang a picture. The same idea applies here. Picking the right tool from the start saves a ton of time and avoids a lot of headaches down the road.
If you just have a clean screenshot and need the data now, Excel's built-in Data from Picture feature is your best friend. It’s quick, it’s already there, and it does a decent job on simple tables. But for anything more complex or repetitive, you'll want to look at other options.
To make it easier, here’s a decision tree to guide you. It'll help you pick a path based on your image quality, how often you do the task, and whether you need to automate the whole process.
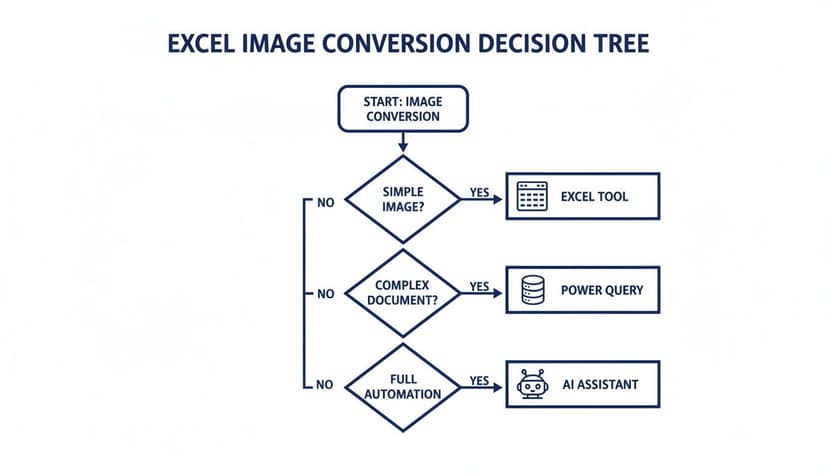
As you can see, the path is pretty clear. Simple, one-off jobs are perfect for Excel’s tool. When you're dealing with messy, multi-page documents, Power Query is the way to go. And if you need to go beyond just grabbing data to actually analyzing it, a dedicated AI assistant is the most powerful choice.
To figure out which tool is right for you, it helps to weigh your options across a few key areas. I've put together this table to quickly compare the methods we've covered.
Which Image-to-Table Conversion Method Is Best for You?
| Method | Best For | Speed | Typical Accuracy | Post-Conversion Effort |
|---|---|---|---|---|
| Excel's Data from Picture | Quick, one-off conversions of simple, clear images. | Very Fast | High (for clean images) | Low to Medium |
| Online OCR Tools | Low-quality or distorted images; when you're not on your primary computer. | Fast | Varies; often better than Excel for messy images. | Medium |
| Power Query (Get & Transform) | Recurring tasks with consistent layouts (e.g., monthly PDF reports). | Slow (initial setup); Instant (refresh) | Very High | High (initial setup); None (afterward) |
| ElyxAI Automation | Complex, end-to-end workflows that include analysis and reporting. | Fast | Highest | Minimal |
This table should give you a good starting point. The goal isn't just to convert the data, but to get it into a clean, usable format with the least amount of fuss.
Matching the Method to the Mission
Ultimately, your decision comes down to a few practical questions about the task at hand. Think about:
- Data Volume: Are you converting a single small table or hundreds of pages?
- Complexity: Is it a clean, simple grid or a messy photo with merged cells and weird formatting?
- Frequency: Is this a one-time task or a report you'll be running every week?
- End Goal: Do you just need the raw data, or do you need to clean, analyze, and visualize it?
For instance, if you have a single, blurry photo of a receipt, a dedicated online OCR tool might actually outperform Excel's feature because they are often trained on a wider variety of low-quality images.
The most powerful method isn’t always the best one. The goal is to choose the most appropriate tool that gets you to a clean, usable dataset with the least amount of effort.
On the other hand, if you get the same financial statement as a PDF every month, it’s a no-brainer. The upfront work to set up a Power Query workflow will save you countless hours over the year. It creates a refreshable pipeline that does the work for you.
And if your real objective is to turn that data into insights—not just get it into a spreadsheet—then you've outgrown simple conversion tools. This is where an AI assistant shines, automating everything from data extraction to final analysis. To see how that works, you might want to read our guide on which AI can handle complex Excel tasks.
3 Common Questions & Quick Fixes
Even with the best tools, you can run into a few snags when turning an image into an Excel table. Here are some of the most common questions I get, along with a few hard-won tips to get you back on track.
1. Can't Find Excel's "Data from Picture" Feature?
It happens all the time. You’re ready to import your data, but the "Data from Picture" button is nowhere to be found under the Data tab. There are usually two culprits.
First, this is a premium feature. It's only available for Microsoft 365 subscribers. If you're running an older version of Excel, like 2019 or 2016, you simply won't have it.
The other possibility? You're a Microsoft 365 user, but your company's IT department has locked down certain cloud-based features. If you suspect this is the case, you'll need to reach out to your IT team and ask them to enable it.
2. How Do I Get More Accurate Results?
Getting jumbled text or misplaced columns? The problem almost always comes down to the quality of your source image. Garbage in, garbage out. A little prep work beforehand makes a world of difference.
Here’s what to focus on:
- Go High-Res: A crisp, clear screenshot will always give you better results than a blurry photo snapped with your phone.
- Light It Right: If you have to take a picture, make sure the lighting is bright and even. Shadows and glare are the biggest enemies of accurate text recognition.
- Crop Out the Noise: Trim the image so that only the table is visible. Extra text, logos, or other graphics on the page can easily confuse the conversion tool.
3. What Should I Do When Text Is Recognized as a Number (or Vice Versa)?
This is a classic OCR problem. Sometimes a "0" looks like an "O", or a part number like "12-E" gets imported as a date. You can fix these during the review step in Excel's Data from Picture tool. But if you're using another method, you may need to fix it in the sheet itself. The easiest way is to use the TEXT formula.
Let's say a numeric ZIP code like "07740" was imported into cell B2, but Excel dropped the leading zero, leaving you with "7740". You can fix it with this formula:
=TEXT(B2, "00000")
How it Works: The
TEXTfunction converts a value to text in a specific number format. The format "00000" tells Excel to display the number with at least five digits, adding leading zeros if necessary. It's a quick, practical way to restore lost formatting and ensure your data is correct.
Ready to stop wrestling with data and start getting answers? Try Elyx AI and automate your entire Excel workflow with a single command. Get your free trial of Elyx AI today!
Reading Excel tutorials to save time?
What if an AI did the work for you?
Describe what you need, Elyx executes it in Excel.
Sign up