What Is Data Standardization Explained Simply

At its core, data standardization is about getting all your data to speak the same language. It's the process of taking information from different sources—each with its own quirks and formats—and transforming it into a single, consistent structure. This is the crucial step that makes everything from analytics and reporting to AI and machine learning not just possible, but reliable.
What Is Data Standardization, Really?
Think about it this way: you wouldn't try to build a house with measurements in meters, feet, and cubits all mixed together. The result would be chaos. The same is true for your business data. When information comes from different systems, apps, or even manual entry, inconsistencies are guaranteed.
Spending too much time on Excel?
Elyx AI generates your formulas and automates your tasks in seconds.
Sign up →Data standardization is the practice of fixing those inconsistencies. It's about taking all that varied data and enforcing a uniform structure.
The goal here is simple: eliminate ambiguity. When your data is unambiguous, it becomes trustworthy, and that makes it infinitely easier to work with. While the term sounds modern and technical, the idea has deep roots in statistics, going back to the 18th and 19th centuries. For instance, it was way back in 1894 that Karl Pearson introduced standard deviation—a foundational concept for measuring variance that's still central to how we standardize data today.
Why It’s More Than Just Cleanup
It's easy to mistake standardization for simple data cleaning, like fixing a few typos. But it's so much more than that. It’s about creating a single, authoritative version of the truth for your entire organization.
This process is fundamental for several reasons:
- Accurate Analytics and Reporting: It ensures that when you compare sales figures, you’re actually comparing apples to apples. No more confusion between "USA," "U.S.A.," and "United States."
- Reliable AI and Machine Learning: The old saying "garbage in, garbage out" is the absolute rule for AI. Standardization provides the clean, high-quality fuel that machine learning models need to produce accurate results.
- Operational Efficiency: When data is consistent, your teams spend less time wrestling with spreadsheets and more time uncovering valuable insights. For anyone working heavily in Excel, learning to master data management is a game-changer.
Key Takeaway: The whole point of data standardization is to build a uniform, reliable dataset. This removes all the guesswork and allows for clear, accurate analysis across every part of the business.
To really see the difference it makes, let's look at how messy, raw data becomes a powerful asset. The table below gives a simple "before and after" snapshot of what standardization looks like in practice.
Data Standardization Before and After
This comparison shows common data inconsistencies and how they appear after applying standardization rules.
| Data Type | Inconsistent Data (Before) | Standardized Data (After) |
|---|---|---|
| Dates | 01-Jan-2024, 1/1/24, 2024.01.01 | 2024-01-01 |
| Country Names | USA, U.S., United States | US |
| Phone Numbers | (555) 123-4567, 555.123.4567 | 555-123-4567 |
| Boolean Values | Yes, 1, TRUE, Y | TRUE |
| Measurements | 5 ft, 60 in, 1.52 m | 152 cm |
As you can see, these small fixes bring immense clarity.
Ultimately, standardization is the bedrock of any successful data strategy. It’s what turns a chaotic jumble of information into a structured, dependable resource that you can confidently use to make critical business decisions.
Why Your Business Can't Ignore Data Standardization

It's tempting to see data standardization as just another technical chore on a long to-do list. But thinking that way is a costly mistake. In reality, it's a strategic move that directly impacts your bottom line. Without it, even the simplest business report can create more confusion than clarity, paving the way for bad decisions and lost opportunities.
Imagine a large retail company with stores all over North America. Their sales reports were a complete mess because of one simple problem: inconsistent data entry. One regional team logged sales under ‘USA,’ another used ‘U.S.,’ and a third entered ‘United States.’ This tiny inconsistency made it impossible to get a clear, consolidated picture of national performance.
Their inventory planners, forced to rely on this messy data, made some terrible calls. They ended up overstocking products in some regions while understocking in others, which directly led to lost sales and inflated carrying costs. This is a perfect, real-world example of how a lack of standardization creates very real financial headaches.
The Foundation for Trustworthy Decisions
Inconsistent data kills trust. Plain and simple. When your teams can't rely on the numbers they’re looking at, decision-making becomes a high-stakes gamble based on guesswork instead of solid facts. Standardizing your data clears away that uncertainty and builds a single source of truth everyone in the organization can stand behind.
This consistency is the bedrock for several critical business functions:
- Accurate Business Intelligence: Your dashboards and reports finally become reliable tools you can use to track performance, spot genuine trends, and truly understand customer behavior.
- Effective AI and Machine Learning: AI models are only as smart as the data they learn from. Standardized data ensures your models are trained on clean, consistent inputs, which leads to much sharper predictions and insights.
- Streamlined Operations: When data is consistent, your teams spend less time manually cleaning and reconciling information, freeing them up to focus on what really matters: analysis and strategy.
Key Insight: Ignoring data standardization is like building a skyscraper on a foundation of sand. Sooner or later, the structural flaws will cause serious problems, undermining everything from your daily analytics to your long-term strategic plans.
The time spent fixing these kinds of issues is staggering. Some studies show that data analysts can spend up to 80% of their time just cleaning and preparing data before they can even begin to analyze it. In a field like healthcare, inconsistent data standards have led to classification errors in up to 15% of patient records. It’s a problem with serious consequences.
Unlocking True Business Value
Ultimately, getting a handle on data standardization is about connecting clean data to real, measurable business outcomes. The benefits go way beyond tidy spreadsheets; they touch every part of your enterprise.
A well-planned standardization strategy empowers your organization by:
- Improving Customer Insights: By unifying customer data from all touchpoints—sales, marketing, support—you can build a complete 360-degree view. This lets you deliver better personalization and a far better customer experience.
- Enhancing Operational Efficiency: When data flows seamlessly between systems without needing manual fixes, processes like supply chain management, financial reporting, and compliance run faster and with fewer errors.
- Boosting Confidence in Strategy: With a data foundation you can trust, your leadership team can make bold, data-driven decisions with a much higher degree of confidence, knowing the information they have reflects reality.
On top of all that, having well-standardized data makes achieving robust data security compliance much more straightforward. You can ensure sensitive information is protected according to the rules. By investing in this process, you aren't just cleaning up data; you're building a more resilient, intelligent, and competitive organization.
Exploring Common Data Standardization Methods
So, you're sold on the importance of consistent data. The natural next question is, how do you actually do it? Standardization isn't a one-size-fits-all magic button. Think of it more like a specialized toolkit—you need to pick the right tool for the right job.
Choosing the best method comes down to your data and what you hope to achieve with it. Let's walk through the most common techniques you'll find in the wild, complete with real-world examples to make sense of the theory.
Min-Max Scaling
One of the most straightforward and widely used techniques is Min-Max scaling. The core idea is to take all your numeric data and squeeze it into a fixed range, most often between 0 and 1.
Why bother? Imagine you have customer ages from 18 to 70. An algorithm might mistakenly think the 70-year-old is more significant just because 70 is a bigger number than 18. Min-Max scaling levels the playing field by putting every age on the same relative scale.
The process is simple: take a data point, subtract the minimum value from the entire dataset, and divide the result by the dataset's range (max value minus min value).
Example: Let's standardize an age of 35 from a dataset where the minimum age is 18 and the maximum is 70.
- (35 – 18) / (70 – 18) = 17 / 52 = 0.327
An age of 35 now becomes 0.327 on our new 0-to-1 scale.
This method is fantastic for algorithms like neural networks or k-nearest neighbors that need inputs on a similar scale to function properly. The main drawback? It’s very sensitive to outliers. A single extreme value can throw off the entire scale for every other data point.
Z-Score Standardization
Another go-to technique is Z-score standardization. Unlike Min-Max, this method doesn't cram your data into a strict 0-to-1 box. Instead, it transforms the data so that it has a mean (average) of 0 and a standard deviation of 1.
Essentially, the Z-score tells you how many standard deviations a data point is from the dataset's average. A Z-score of 0 means it's perfectly average. A score of 1.5 means it's one-and-a-half standard deviations above the average.
Example: Say our customer age data has an average of 40 and a standard deviation of 12. Let's find the Z-score for a 58-year-old.
- (58 – 40) / 12 = 18 / 12 = 1.5
So, a 58-year-old is 1.5 standard deviations above the average age in this group.
Z-score is a lifesaver for algorithms like linear and logistic regression that perform best when the data follows a bell curve (a normal distribution). It also handles outliers much more gracefully than Min-Max scaling because it doesn't have a fixed boundary. These techniques are cornerstones among the proven strategies for improving data quality.
This image helps visualize how these different approaches reshape your data.
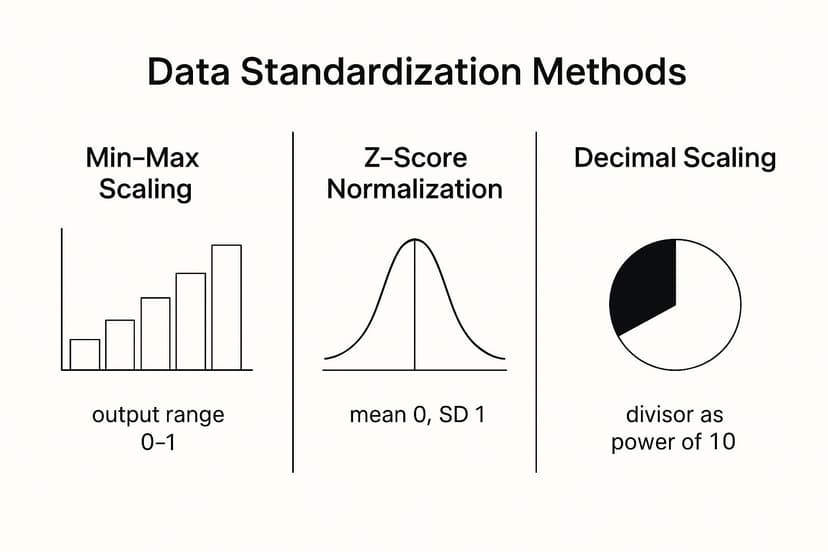
As you can see, each method centers and scales the data differently, which is why picking the right one is so crucial for your analysis.
Decimal Scaling
Decimal scaling is an intuitive method that standardizes data simply by moving the decimal point. How many places you move it depends on the largest absolute value in your dataset.
You find the smallest power of 10 (10^k) that, when you divide your dataset’s largest absolute value by it, the result is less than 1. Then you just divide every single data point by that same power of 10.
Example: Your transaction data ranges from -$950 to $1,200. The largest absolute value is 1,200.
- To get 1,200 under 1, we need to divide by at least 1,000 (which is 10³). So, our k is 3.
- We divide every value by 1,000.
- A transaction of $1,200 becomes 1.2.
- A transaction of -$950 becomes -0.95.
This method is super easy to understand and implement. It’s a solid choice when you need a quick standardization that preserves the relative differences between your values.
The table below breaks down these techniques side-by-side to help you decide which one fits your needs.
Comparison of Standardization Techniques
| Method | Best For | Output Range | Key Consideration |
|---|---|---|---|
| Min-Max Scaling | Algorithms sensitive to feature scale (e.g., neural networks, KNN). | Typically 0 to 1. | Highly sensitive to outliers. |
| Z-Score Standardization | Data with a normal distribution; algorithms like linear regression. | No fixed range; centered at 0. | Handles outliers better than Min-Max. |
| Decimal Scaling | Simple, fast standardization where relative value differences matter. | Values between -1 and 1. | Easy to implement and understand. |
Getting a grip on these common methods takes data standardization from an abstract concept to a practical tool. It's not just about cleaning data; it's about reshaping it to uncover its true potential. The right technique always circles back to your goals, your data’s personality, and the models you intend to use.
Here is the rewritten section, designed to sound like an experienced human expert.
Standardization vs. Normalization: Which One Do You Actually Need?
In the world of data prep, two terms get tossed around and confused all the time: standardization and normalization. They both involve rescaling your data, but they do very different things. Picking the wrong one can quietly sabotage your entire analysis or hamstring your machine learning model before it even gets started.
Let's clear this up with a simple analogy. Imagine you have two sets of test scores. One is from a test graded out of 100 points, and the other is from a quiz graded out of 20. How do you fairly compare a student who got an 85 on the test to one who got a 17 on the quiz?
Standardization is like calculating a Z-score for each student. You'd figure out how many standard deviations away from the class average each score is. This tells you how each student performed relative to their peers on a common scale, centering everything around an average of zero.
Normalization, on the other hand, is like converting both scores into a percentage. The 85/100 becomes 85%, and the 17/20 also becomes 85%. You've squeezed both scores into a fixed range of 0 to 100. This method cares more about putting data into a strict boundary than comparing it to a central point.
When to Reach for Standardization
Standardization is your workhorse when your data roughly follows a bell curve (a normal distribution). By transforming your data to have a mean of 0 and a standard deviation of 1, you’re meeting a core assumption for a lot of classical statistical models.
It’s the best choice for algorithms that are sensitive to the scale of your features and assume your data is centered around zero. This includes some heavy hitters:
- Principal Component Analysis (PCA): This technique finds the most important signals (directions of variance) in your data. Without standardization, a feature with a huge scale—like annual income—would completely dominate a feature with a small scale, like years of experience, giving you a distorted picture.
- Linear Discriminant Analysis (LDA): Much like PCA, LDA works best when all features are on a level playing field.
- Clustering Algorithms (like K-Means): These methods group data based on distance. Standardization ensures that no single feature disproportionately influences how "far apart" two data points are.
The Bottom Line: Use standardization when your algorithm cares about the data's distribution (like being centered at zero) or when the raw scale of your features could throw off the results. It's also much more robust against outliers than normalization.
Think about it: if you're analyzing customer data with both age (ranging from 18 to 80) and annual income (ranging from $30,000 to $250,000), the massive numbers in the income column would completely wash out any patterns in the age column. Standardization fixes this instantly.
When to Opt for Normalization
Normalization is what you need when your data doesn't follow a normal distribution or when your algorithm couldn't care less about the distribution but absolutely needs values to be within a specific, bounded range.
This is non-negotiable for certain models, especially:
- Neural Networks: These models rely on activation functions (like Sigmoid or Tanh) that expect inputs within a tight range, typically 0 to 1. Feeding them large, unscaled numbers can cause their learning process to grind to a halt. Normalization is standard practice here.
- K-Nearest Neighbors (KNN): Just like with clustering, KNN is all about distance. Normalization guarantees every feature gets an equal vote.
- Image Processing: When working with images, pixel values are almost always normalized to a range like 0 to 1 or 0 to 255 to prepare them for processing by a neural network.
Getting this choice right isn't just a technical detail—it's a foundational step that separates frustrating projects from successful ones. Knowing when you need a common scale (standardization) versus a strict boundary (normalization) will help you build far more accurate and reliable models.
Navigating the Hurdles of Data Standardization

It’s one thing to talk about data standardization in theory, but it's a whole different ballgame when you're in the trenches. Moving from a neat, tidy example to a messy, real-world dataset is where the real work begins, and it’s where most initiatives get bogged down. If you know what's coming, you can prepare for it.
One of the first brick walls you'll hit is unstructured data. We're talking about the goldmine of information hiding in social media posts, customer support chats, and open-ended survey answers. This data doesn't play by the rules of rows and columns, making it a serious headache to standardize without sophisticated text analysis.
Then there's the human element, which is often the toughest nut to crack. Getting everyone to agree on what a "customer" or a "lead" actually is can feel like a diplomatic mission. Marketing’s definition might be worlds away from sales, and without a shared dictionary, you're stuck. This isn't a tech problem; it's a people problem that demands clear communication and strong leadership.
The Problem of Scale and Variety
Today’s data doesn’t just trickle in; it floods. When you're dealing with terabytes or even petabytes of information, the sheer scale is a massive technical hurdle. The computing power needed to process and standardize these enormous datasets can be staggering, making the whole process slow and incredibly expensive.
This challenge is magnified by the wild variety of data formats. One system might spit out dates as YYYY-MM-DD, another uses DD/MM/YY, and a third might track everything with a Unix timestamp. Trying to reconcile these tiny differences across millions of records is a monumental task that requires a seriously robust and scalable approach.
Key Hurdle: The most persistent challenges in data standardization are often not technical, but organizational. Overcoming resistance to change and establishing clear, company-wide data governance rules are foundational to any successful project.
Even the "easy" stuff isn't always easy. For instance, making all text lowercase seems simple. But what about brand names like "iPhone" or acronyms like "USA"? You have to create rules that handle these exceptions intelligently, or you risk losing valuable context.
Common Standardization Roadblocks
To get this right, you have to know what you're up against. Here are the most common snags that teams run into:
- Varying Naming Conventions: One database calls it
customer_first_name, another usesFirstName. Aligning these field names is step one. - Mismatched Units of Measurement: Your European sales data is in Euros (€), but your US data is in Dollars ($). You have to convert everything to a single currency for your analysis to make sense. The same goes for kilograms versus pounds.
- Inconsistent Categories: A product is filed under "Electronics" in one system and "Tech Gadgets" in another. These need to be mapped to a single, master list.
- Resistance to New Processes: Let's be honest—people are creatures of habit. If a team is used to doing things a certain way, getting them to adopt new standards requires training, good documentation, and consistent follow-through.
The only way to successfully navigate these issues is by establishing clear data governance right from the start. This involves putting a team in charge of setting the rules, writing them down, and making sure everyone sticks to them. A solid framework of data quality best practices isn’t just a nice-to-have; it's essential for making this work long-term.
How to Automate Your Data Standardization
If you've ever manually cleaned a dataset, you know the drill. It's a slow, painstaking process that's incredibly prone to error. In fact, most studies show that data teams spend a staggering 80% of their time just preparing data, not analyzing it. The only way to win back that time is to stop doing it by hand and let modern tools handle the heavy lifting.
This is where intelligent platforms like Elyx.AI really shine. Instead of having a person manually hunt for mistakes, these tools use smart algorithms to scan your data, flag inconsistencies, and even suggest the right standardization rules. It’s a game-changer that turns hours of tedious work into a few automated steps.
The Power of Automated Consistency
Automation isn’t just about speed; it's about enforcing consistency at a scale that humans simply can't match. Once you set your standards—say, a single date format or a master list of country codes—the platform can apply them flawlessly across millions of rows in minutes. This virtually eliminates the human errors that always find their way into manual work.
Think about it: an automated system can instantly spot every variation like "USA," "U.S.", and "United States" and convert them all to a standard "US" without anyone ever opening a spreadsheet. For a closer look at these principles in action, you can learn more about how to automate tasks in Excel. It’s how you move from data chaos to operational clarity.
The image below gives you an idea of how simple this can look with the right interface.
You can see how a complex task is boiled down to a few clicks, letting the user apply powerful rules without writing a single line of code.
Benefits of an Automated Approach
Bringing automation into your standardization workflow creates a ripple effect of benefits across the entire organization. This isn't just about tidying up datasets; it's about giving your business the confidence to move faster and make decisions based on data you can actually trust.
Here are a few of the key wins:
- Drastic Time Savings: Your data analysts and other team members are freed from the soul-crushing work of data prep. They can finally focus on what they were hired for: analysis and strategy.
- Reduced Human Error: Automated rules are applied the same way, every single time. This gets rid of the typos, inconsistent entries, and simple mistakes that come with manual processing.
- Enforced Data Governance: You can finally ensure that all data flowing into your systems meets your company’s standards, creating that elusive single source of truth.
Expert Insight: Automation flips the script on data standardization. It turns it from a reactive, one-off cleanup project into a proactive, continuous process that ensures your data is always ready for analysis. That’s a huge competitive edge.
Understanding who implements these solutions, like those in Data Engineer roles, helps clarify how this all works in practice. At the end of the day, tools with intuitive interfaces and flexible workflows put this power in everyone's hands, not just the technical experts. This shift allows you to maintain high-quality data effortlessly, guaranteeing your reports and analytics are always built on a solid foundation.
Still Have Questions About Data Standardization?
Even after you've got the basics down, putting data standardization into practice can bring up some new questions. Let's tackle a few of the most common ones that pop up when teams start getting their hands dirty.
What’s the Very First Thing I Should Do?
Before you can standardize anything, you have to know what you're dealing with. The first, non-negotiable step is always a data audit.
Think of it like a home renovation—you wouldn't start knocking down walls without knowing where the plumbing and electrical lines are. A data audit means mapping out all your data sources, from your CRM and marketing tools right down to that one ancient spreadsheet everyone uses. This process quickly reveals all the inconsistencies and messy spots.
Once you have that clear picture, you can create your rulebook. This is where you define the one "right way" for everything—be it date formats (YYYY-MM-DD), country codes (ISO standard), or customer naming conventions. This document becomes your organization's single source of truth.
How Much Does This Actually Matter for Machine Learning?
For machine learning, standardization isn't just a "nice-to-have"—it's often a necessity. Its impact is huge and shows up in a few critical ways:
- Better Model Performance: Many algorithms, like logistic regression or support vector machines, can get thrown off by features on wildly different scales. If one feature is measured in millions and another in single digits, the bigger one can unfairly dominate the model's logic. Standardization levels the playing field, leading to much more accurate results.
- Quicker Training: When you're training a model using gradient descent (think neural networks), standardized data helps the algorithm find the best solution much, much faster. It's like giving it a clear, straight road to the destination instead of a winding, bumpy one.
- Honest Feature Importance: Once all your features are on the same scale, you can finally get a true sense of which ones are actually the most influential for making predictions.
Simply put, standardized data is the high-octane fuel that powers high-performance models. Without it, you're running on fumes and hoping for the best.
Is It Possible to Overdo It and "Over-Standardize" Data?
Absolutely. It's a real risk you need to watch out for. While the goal is consistency, getting too aggressive with your rules can sometimes erase important nuance from your data.
For instance, a common rule is to convert all text to lowercase. That seems simple enough, right? But in doing so, you might lose the ability to tell the difference between "us" (the pronoun) and "US" (the United States). For text analysis, that's a huge loss of context. The trick is to apply your rules with care, always asking yourself if you're sacrificing valuable information for the sake of perfect uniformity.
Ready to stop fighting with messy, inconsistent data and start getting insights you can actually trust? Elyx.AI plugs directly into your Excel workflow, using AI to automatically clean, format, and standardize your spreadsheets in seconds. Ditch the manual cleanup and discover a smarter way to handle your data.
Learn more and get started with Elyx.AI for free.
Reading Excel tutorials to save time?
What if an AI did the work for you?
Describe what you need, Elyx executes it in Excel.
Sign up