What is a DCF Model? A 5-Step Practical Guide to Valuation

Ever tried to figure out what an apple tree is really worth? You wouldn't just value the wood. You'd be thinking about all the apples it's going to produce for years to come. A Discounted Cash Flow (DCF) model applies that exact same logic to a business.
It’s a powerful valuation method that calculates a company's worth today based on the cash it’s expected to generate in the future. It's a common problem that can be solved effectively within Excel, especially when augmented with AI.
What Is a DCF Model and Why Does It Matter?
At its core, a DCF model is a financial tool built in Excel designed to find the intrinsic value of a company or an investment. It’s all built on a simple, yet profound, concept: the time value of money.
Spending too much time on Excel?
Elyx AI generates your formulas and automates your tasks in seconds.
Sign up →The idea is that a dollar in your hand today is worth more than a dollar you’ll get next year. Why? Because you can invest that dollar today and start earning a return on it.

A DCF model essentially bridges the gap between the future and the present. It takes all the cash a business is projected to make over, say, the next decade, and "discounts" it back to a single number representing its value today. This helps investors answer the big question: Is this company’s future potential worth its current price tag?
While it became a staple in finance after the 1929 stock market crash, the idea of discounting future earnings isn't new. The concept was used in the UK coal industry as far back as 1801, proving that smart business has always been about valuing future potential.
The 3 Pillars of a DCF Model
Every DCF analysis, no matter how detailed, is built on three fundamental pillars. Getting these right is the key to building a solid model. It's also one of the most common Excel use cases in the world of finance.
Here’s a quick breakdown of what they are and the core questions they help us answer.
The 3 Core Pillars of a DCF Model
| Pillar | Core Question It Answers | Key Inputs Required |
|---|---|---|
| Forecasting Cash Flows | How much cash will the business generate in the future? | Historical financial statements, growth assumptions, and industry trends. |
| Calculating a Discount Rate | What is the risk involved in receiving those future cash flows? | Risk-free rate, market risk premium, and company-specific risk factors. |
| Estimating the Terminal Value | What is the business worth beyond the initial forecast period? | Long-term growth rate and the final year's projected cash flow. |
Master these three components, and you're well on your way to building a meaningful valuation.
A DCF analysis finds the intrinsic value of a business, which is the present value of the free cash flow the company is expected to pay its shareholders in the future. If the intrinsic value is higher than the current price, it could be a good investment opportunity.
By weaving these three elements together, you get a clear picture of a company’s financial worth. It’s a valuation based not on market hype or past glory, but on its fundamental ability to generate cold, hard cash.
We'll dive into each of these pillars in the sections to come.
The 3 Essential Components of a DCF Analysis
A Discounted Cash Flow (DCF) model is like a high-performance engine; its power comes from three critical parts working in perfect harmony. Getting a handle on how each one functions is the key to building a valuation in Excel that isn't just a guess, but a calculated estimate of what a company is truly worth.
Think of these components as the three main levers you can pull to adjust your valuation. Each one answers a fundamental question about the business's future, and getting them right is what separates a flimsy analysis from a credible one. Let's break them down.
1. Forecasting Free Cash Flow
First up, and arguably the most important, is Forecasting Free Cash Flow (FCF). This isn't the same as revenue or profit you see on an income statement. FCF is the actual cash a company has left over after paying for everything it needs to run and grow the business—the money that could, in theory, be handed back to its investors.
Imagine a local bakery. Its revenue is all the money from selling bread and pastries. But it has to pay for flour, electricity, and maybe a new oven. Free cash flow is the cash left in the register after all those essential costs are covered. It’s the purest indicator of a company's financial health.
We typically project these cash flows over a specific period, usually five to ten years. The integrity of your entire DCF model really hinges on how realistic these projections are. They are the foundation upon which everything else is built.
2. The Discount Rate
Once you have an idea of the cash a company will generate in the future, you hit the next big question: what is that future cash worth today? A dollar tomorrow is not worth the same as a dollar in your hand right now. This is where the Discount Rate comes in. It’s the "risk translator" that converts uncertain future cash into its present-day equivalent.
The most common way to figure this out is by calculating the Weighted Average Cost of Capital (WACC). This rate represents the blended cost of a company's financing from both its lenders and shareholders. A higher WACC means the company is seen as riskier, so its future cash flows are "discounted" more heavily, making them worth less today.
In Excel, you can calculate the present value of a future cash flow. For example, a projected cash flow of $1 million in five years with a 10% discount rate is worth $620,921 today. The formula would be:=1000000 / (1 + 0.10)^5
1000000is the future cash flow (Future Value).0.10is the annual discount rate (10%).5is the number of years.
This sensitivity makes choosing the right rate one of the most critical judgment calls in the process.
3. Estimating the Terminal Value
A business, hopefully, will operate long beyond our 5- or 10-year forecast. So, how do we account for all the cash it will generate for the rest of its life? That's the job of the Terminal Value.
This component is an estimate of the company's value at the very end of our forecast period. It represents the combined value of all cash flows from that point into perpetuity, assuming the business settles into a stable, constant growth rate.
There are two main ways to calculate this:
- Gordon Growth Model: This is the most popular method. It assumes the company will grow at a steady, sustainable rate forever (think something close to the long-term rate of economic growth). You can find plenty of helpful Excel formulas for financial modeling to assist with this calculation.
- Exit Multiple Method: This approach assumes the business is sold at the end of the forecast period. It estimates the terminal value by applying a market multiple, like EV/EBITDA, to the final year's projected earnings.
The Terminal Value often accounts for a surprisingly huge chunk of the total DCF valuation—sometimes over 75% of it. This makes it an incredibly powerful yet sensitive part of the model, one that hangs heavily on the long-term growth assumption you decide to use. Together, these three parts—projected cash flows, the discount rate, and terminal value—form the complete engine of a DCF analysis, allowing you to turn future potential into a tangible, present-day number.
A 5-Step Practical Guide to Building a DCF Model in Excel
Alright, we've covered the theory. Now it’s time to roll up our sleeves and actually build something. A Discounted Cash Flow (DCF) model might seem complex from the outside, but it's really just a logical, step-by-step process.
Let's walk through how to build a powerful valuation tool from scratch using nothing more than a blank Excel spreadsheet. This simplified five-step approach will turn your financial assumptions into a clear estimate of what a company is truly worth.
Step 1: Project Future Cash Flows
The entire DCF model is built on one thing: a solid forecast of future free cash flows (FCF). This is where you'll project how much cash the business is likely to generate, usually over the next five or ten years. Before you even start, it's worth getting good at creating strong financial projections, as this is the bedrock of your valuation.
First, you'll want to grab the company's historical financial statements. Look at past income statements and balance sheets to get a feel for its performance. From there, you'll need to make some educated guesses—based on company guidance, industry trends, and the general economic climate—about future revenue growth, operating margins, and capital spending.
In Excel, you’ll set up a timeline with columns for each year. Your rows will break down the components of FCF:
- Revenue Growth %: Your best guess for top-line growth each year.
- EBIT (Earnings Before Interest & Taxes): Calculated from your revenue and margin assumptions.
- Taxes: An estimate of what the company will pay on its earnings.
- Capital Expenditures (CapEx): Money reinvested into the business to keep it running and growing.
- Change in Working Capital: The cash needed to fund short-term operations.
Add and subtract these pieces, and you'll have your Unlevered Free Cash Flow for every year in your forecast.
Step 2: Calculate the Discount Rate
Once you have your cash flow projections laid out, the next move is to figure out the Discount Rate. Think of this as the "interest rate" for risk. It’s the number we'll use to translate all those future dollars into what they’re worth today. The go-to method here is calculating the Weighted Average Cost of Capital (WACC).
WACC is just a fancy term for the blended cost a company pays for its financing, combining both its debt and equity. A higher WACC means more risk, which in turn means those future cash flows are worth less today.
The WACC formula can look a little hairy, but it’s manageable if you break it down in Excel. You'll need to find inputs like the risk-free rate (the yield on a government bond is a good proxy), the market risk premium, and the company's beta, which measures how its stock moves compared to the overall market.
Expert Tip: If you're building a quick, back-of-the-napkin model, you can often use an industry-average WACC or just plug in a standard required rate of return, like 10% or 12%. It’s less precise, but it’s a perfectly fine starting point.
Step 3: Estimate the Terminal Value
A business doesn't just stop existing after your 5- or 10-year forecast. The Terminal Value (TV) is your best guess at what the company is worth for all the years after your detailed projection ends, stretching out into perpetuity. Don’t underestimate this step—the TV can easily account for over 75% of the company's total estimated value.
The most common way to calculate this is with the Gordon Growth Model. It assumes the company’s cash flows will grow at a slow and steady rate forever. This perpetual growth rate (g) should be conservative, usually somewhere around the long-term rate of economic growth (think 2-3%).
In Excel, the formula looks like this:=(B10*(1+B12))/(B11-B12)
B10is the cell containing the Final Year's FCF.B12is the cell containing the perpetual growth rate (g).B11is the cell containing the WACC.- Detailed Explanation: This formula calculates the Terminal Value. It takes the free cash flow of the final forecast year (
B10), grows it by one period using the perpetual growth rate (*(1+B12)), and then divides the result by the discount rate (WACC) minus the perpetual growth rate (/(B11-B12)). This gives you the present value of all cash flows beyond the forecast period.
This diagram shows how these three core inputs flow together.
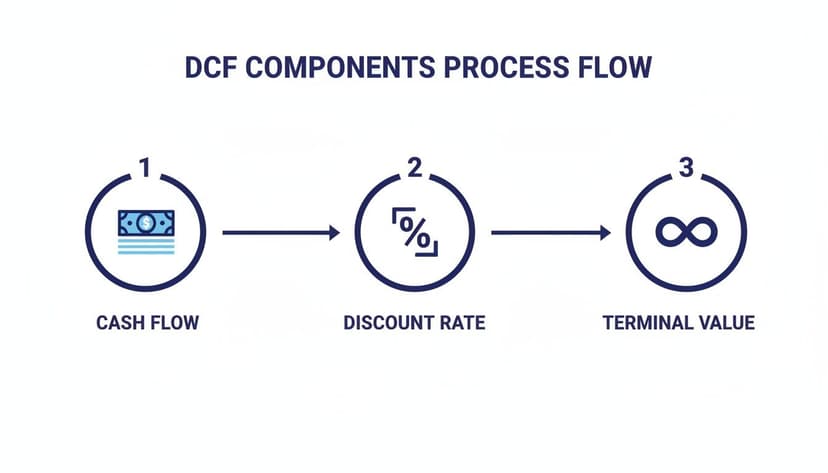
As you can see, it's a logical progression: project the cash, determine the risk with a discount rate, and then capture all the long-term value.
Step 4: Discount All Cash Flows to Present Value
Now for the magic. It's time to pull all those future values back to the present day. You'll "discount" each year's projected FCF, plus the terminal value, using the WACC you calculated earlier. The whole point is to figure out what that future stream of cash is worth in today's dollars.
Excel’s NPV (Net Present Value) function is handy here, but be careful. A common rookie mistake is to include the first year's cash flow in the NPV formula, which discounts it when it shouldn't be. You should only use the NPV function on cash flows from Year 2 onward.
An even more direct method is to calculate the Present Value (PV) of each individual cash flow with this simple formula in an Excel cell for a specific year:=C5/((1+$B$11)^C1)
C5is the cell with the Future Cash Flow for that year.$B$11is the absolute cell reference for the WACC (so it doesn't change when you drag the formula).C1is the cell containing the Year Number (e.g., 1, 2, 3…).- Detailed Explanation: This formula calculates the Present Value of a single future cash flow. It takes the cash flow (
C5) and divides it by one plus the discount rate (1+$B$11) raised to the power of the corresponding year number (^C1). This systematically reduces the value of future earnings to reflect the time value of money.
Apply this to each year of your forecast and to the Terminal Value.
Step 5: Add It All Up for the Enterprise Value
You're at the finish line! This last step is the easiest. Just sum up all the present values you calculated in the previous step using Excel's SUM function.
Take the present value of each forecasted FCF and add the present value of the Terminal Value. That final number is the company's Total Enterprise Value (TEV)—the total worth of its core business operations to everyone, including shareholders and lenders. If you want to find the Equity Value (what's left for just the shareholders), simply subtract the company's net debt from the TEV.
Following these five steps will give you a functional, insightful DCF model. And for those looking to speed up the process, an AI formula generator can be a huge help in automating some of the more complex calculations in Excel.
How 3 AI Features Can Make Your DCF Modeling So Much Easier
Anyone who’s built a Discounted Cash Flow (DCF) model from scratch in Excel knows the grind. It's a slow, meticulous process of hunting down historical data, forecasting the future, and stress-testing every assumption. This isn't just tedious—it’s a minefield for simple human errors.
But now, artificial intelligence built into tools like Excel is completely changing how we approach this. Think of AI as an expert assistant who handles the most repetitive, time-sucking parts of building a DCF model. This frees you up to focus on what actually matters: thinking critically and deriving real strategic insights.
Let's break down three specific ways AI can make your DCF modeling faster, smarter, and more reliable.
1. Automating Data Collection and Cleanup
The first, and often most frustrating, step in any DCF analysis is getting all the historical financial data into your spreadsheet. This usually means manually copying and pasting numbers from annual reports or financial databases. It's boring, and one misplaced decimal point can wreck your entire valuation.
AI tools that plug directly into Excel can make this painful step disappear. With a simple text prompt, an AI can instantly pull years of financial data for any company—revenue, operating income, capital expenditures, you name it.
But it doesn't just dump the raw numbers. The AI organizes everything neatly into a structured table right inside your worksheet. A task that could easily burn an hour of your time is now done in seconds. You get to start with a clean, accurate dataset and jump straight into the fun part.
2. Generating Smart, Defensible Assumptions
Making credible assumptions about the future is arguably the hardest part of DCF modeling. What should you use for the revenue growth rate? How will operating margins evolve? These can't be random guesses; they have to be anchored in reality.
This is where AI becomes a true analytical partner. After pulling the historical data, an AI can analyze it to spot important trends and patterns. Based on that analysis, it can suggest a set of "smart assumptions" to build your forecast around.
For example, after looking at the last five years of financials, an AI might suggest a revenue growth rate that starts at 15% in the first year and tapers down to a more stable 5% by the fifth year. This reflects the natural lifecycle of a maturing business. It can do the same for margins and other key drivers.
These AI-generated numbers give you a solid, data-driven foundation. You can always tweak them based on your own knowledge of the company or industry, but you're no longer staring at a blank cell and pulling numbers out of thin air. It speeds up the process and adds a layer of objectivity to your model. If you're curious about this, you might want to learn more about how Elyx brings the power of AI to your Excel workflows.
3. Running Instant Scenarios and Sensitivity Analysis
A single DCF valuation is just one point of view. A truly solid analysis involves testing different scenarios to see how sensitive your valuation is to key variables. This sensitivity analysis is essential for understanding the real risks involved.
Traditionally, this meant painstakingly creating multiple versions of your model in Excel—a "best case," a "worst case," and so on. AI delivers a massive productivity boost here. Instead of manually rebuilding everything, you can use simple text commands to test new assumptions on the fly.
You could just ask the AI:
- "What's the company's valuation if the discount rate is 12% instead of 10%?"
- "Recalculate the model assuming revenue grows 2% slower each year."
- "Show me the impact on enterprise value if the terminal growth rate is 2.5%."
The AI re-runs the entire DCF in moments and gives you the new valuation. This turns sensitivity analysis from a chore into an interactive exploration, allowing you to test a much wider range of outcomes and develop a far deeper understanding of the investment's risk profile.
The 4 Common Pitfalls to Avoid in DCF Valuation
A Discounted Cash Flow (DCF) model is an incredible tool, but it's also incredibly sensitive to the assumptions you feed it in Excel. Think of it like a high-performance race car; in the right hands, it’s brilliant, but one tiny miscalculation can send it flying off the track. At the end of the day, a model is only as good as its inputs.
To get from a purely academic exercise to a defensible, real-world valuation, you have to sidestep a few common traps. These mistakes can easily lead to wildly inaccurate conclusions, so just knowing what to look for is half the battle.

1. The 'Hockey Stick' Problem
This is one of the oldest and most classic mistakes in forecasting. The "hockey stick" projection shows a company's performance suddenly shooting up after years of just plodding along. While everyone loves an optimist, a good valuation has to be rooted in reality.
These overly aggressive forecasts often show revenue accelerating and margins expanding with no clear, justifiable reason for the sudden change.
How do you avoid this? Anchor your projections in the company's historical performance and solid industry benchmarks. If you're going to forecast explosive growth, you better have a convincing story to back it up—a new product, a huge market expansion, or a killer competitive advantage.
2. Using the Wrong Discount Rate
The discount rate is the real engine of your valuation. It’s what turns future cash into today's dollars, and getting it wrong can throw off your entire result. A rate that’s too low will make the company look more valuable than it is, while a rate that’s too high will do the opposite.
A common mistake is grabbing a generic discount rate and applying it to every company. The reality is that this rate must reflect the specific risk profile of the business you're looking at.
Here are a few things to keep in mind:
- Company Size: Smaller companies are almost always riskier and should have a higher discount rate.
- Industry Volatility: A stable utility company is far less risky than a biotech startup swinging for the fences.
- Geographic Risk: Doing business in emerging markets can introduce risks that warrant a higher premium.
Taking the time to properly calculate the Weighted Average Cost of Capital (WACC) is non-negotiable. This process forces you to tailor the discount rate to the company's unique situation. And if you're working with messy data to build your model, you might find our guide on AI-powered data cleaning helpful for other Excel tasks.
3. Miscalculating the Terminal Value
Here’s a startling fact: the terminal value often makes up over 75% of a company's total DCF valuation. That makes it a huge point of sensitivity. The single biggest mistake people make here is assuming an unrealistic perpetual growth rate. It's an economic impossibility for a company to grow faster than the overall economy forever.
Setting your terminal growth rate higher than the long-term GDP growth rate (typically in the 2-3% range) is a massive red flag. It implies that, eventually, the company would become larger than the entire global economy—which simply defies logic.
4. Ignoring Qualitative Factors
At the end of the day, a DCF model is just a bunch of numbers in a spreadsheet. It has no way of understanding the real-world, qualitative factors that can make or break a business. Relying solely on historical data without considering the bigger picture can lead to disaster. Just look at Kodak. It was valued at $30 billion in 1997 based on its film cash flows, only to go bankrupt when digital imaging completely changed the game.
A truly strong DCF analysis always looks beyond the spreadsheet. You have to ask yourself about things like:
- The quality and vision of the management team.
- The company's competitive moat and advantages.
- The looming threat of disruptive technology or changing consumer habits.
When you pair quantitative rigor with smart, qualitative judgment, you end up with a valuation that isn’t just mathematically sound—it’s strategically intelligent.
Answering Your Top 3 DCF Questions
Even after you've built a few models, some questions about DCF analysis always seem to come up. It's totally normal. Getting a handle on these nuances is what separates a good analyst from a great one.
Let's walk through three of the most common sticking points and give you some practical, real-world advice.
1. When Should I Actually Use a DCF Model?
Think of a DCF model as your tool for figuring out what a company is truly worth based on the cash it’s expected to generate, not just what the market thinks it's worth today. It's all about finding that intrinsic value. This approach is most powerful when you're looking at stable, predictable businesses where you can forecast with some confidence.
A DCF analysis really shines in a few key scenarios:
- Long-Term Investing: If you’re a "buy and hold" investor, DCF is your best friend. It helps you decide if a stock's current price is a fair deal for its future potential.
- Valuing Private Companies: With no stock price to go by, a DCF model gives you a solid valuation grounded in the company's actual business operations.
- Big Strategic Moves: For things like mergers, acquisitions, or major new projects, a DCF is crucial. It tells you whether a decision is likely to create real, long-term value.
Simpler methods, like comparing P/E ratios, are faster but assume the market is always right. A DCF lets you ignore the market noise and focus purely on the fundamentals.
2. How Many Years Should I Forecast?
This is where art meets science. While the standard answer you'll often hear is five years, the right forecast period really depends on the company. Your goal is to project cash flows until the business hits a mature, steady growth phase—what we call its "steady state."
A good rule of thumb is to align the forecast period with the company's business cycle. For a boring, stable company, five years is probably fine. But for a high-growth startup or a business in a fast-moving industry, you might need to stretch it to seven or even ten years to fully capture its growth story before things level off.
Just remember, the further out you forecast, the murkier your crystal ball gets. Your assumptions become less reliable with each passing year, so stick to a timeframe where you can build a projection you can actually defend.
3. Can I Use a DCF for a Startup?
You can, but you have to be extremely careful. Building a DCF for a startup in Excel is a different beast altogether. These companies usually burn cash and have zero historical data, making the whole exercise feel like guesswork. The valuation ends up being driven entirely by your assumptions.
If you're going to do it, you'll need to adapt your approach:
- Look at the Market, Not History: Forget past growth rates. Base your revenue forecast on the total addressable market (TAM) and what percentage of that pie the startup can realistically win.
- Crank Up the Discount Rate: Startups are risky. Very risky. Your discount rate needs to reflect that, so don't be surprised to see rates of 25% or higher to account for the high chance of failure.
- Build Multiple Scenarios: Since everything is an assumption, create best-case, base-case, and worst-case models in Excel. This gives you a realistic range of what could happen, rather than betting on a single outcome.
It's a challenge, for sure. But the real value of running a DCF on a startup is that it forces you to think critically about its path to one day becoming a profitable, cash-generating business.
Ready to stop wrestling with manual data prep and complex formulas in Excel? Elyx AI acts as your autonomous data analyst, handling everything from data cleaning and report generation to building charts and running scenario analyses from a single command. Save hours each week and focus on strategic insights, not spreadsheet mechanics.
Discover how Elyx AI can transform your Excel workflow today.
Reading Excel tutorials to save time?
What if an AI did the work for you?
Describe what you need, Elyx executes it in Excel.
Sign up