5 Proven Methods for Mastering What If Analysis in Excel

At its core, what-if analysis is simply the process of experimenting with numbers in your spreadsheet to see how changes ripple through your formulas and affect the final outcome. It’s a way to move beyond just looking at historical data and start forecasting what the future might hold.
What Is What If Analysis in Excel? 3 Key Benefits
Think of traditional data analysis like driving while looking only in the rearview mirror. You know exactly where you've been, but you have no idea what’s coming up. What-if analysis is like your car's GPS—it lets you explore different routes and see what happens if you take a detour, hit traffic, or find a shortcut.
Instead of manually plugging in different numbers again and again, Excel's what-if tools automate this exploration. They’re built to answer all those critical business questions that start with "What if…?"
Spending too much time on Excel?
Elyx AI generates your formulas and automates your tasks in seconds.
Sign up →- What if our material costs jump by 10% next quarter?
- What if we manage to sell 500 more units than we projected?
- What if interest rates dip by 0.25%?
This powerful feature shifts your focus from just reporting on what happened to strategically planning for what could happen.
From Manual Guesswork to Strategic Forecasting
Not too long ago, exploring different outcomes meant duplicating spreadsheets, changing one number at a time, and trying to keep track of everything. A single budget forecast could explode into a dozen different files—a nightmare to manage and compare. You were stuck being a data processor, not a strategist.
What-if analysis changes the game. It gives you a structured way to test your assumptions, pinpoint the variables that truly drive your results, and make decisions with a much clearer picture of the potential risks and rewards. It’s the difference between reacting to the future and actively preparing for it.
Modern Excel, especially when boosted with AI, turns this once-tedious task into a genuinely insightful one. You can model best-case, worst-case, and most-likely scenarios side-by-side to build more resilient business plans.
Mastering this technique means you spend less time on grunt work and more time on high-level thinking. To get the most out of it, having a solid handle on your data structure is crucial. You can learn more about this in our guide on essential Excel formulas, as that knowledge is the bedrock of any reliable financial model.
A Look at 3 Core What-If Analysis Tools in Excel
Excel comes with a powerful set of built-in tools for what-if analysis, saving you from the headache of creating endless versions of the same spreadsheet. The big three—Scenario Manager, Goal Seek, and Data Tables—each solve a different kind of problem, turning your "what if" questions into real numbers.
Once you get a feel for how each one works, you can pick the right tool for the job. It's the difference between comparing complex business plans and just trying to find a simple break-even point.
1. Scenario Manager: Comparing Multiple Futures
Let's say you're a marketing manager trying to nail down next quarter's budget. You've got a few different ideas: an 'Aggressive Growth' plan with a huge ad spend, a 'Conservative' plan to save cash, and a more balanced 'Expected' option.
This is exactly what Scenario Manager was built for. It lets you save and compare different sets of input values, all in one place. No more saving three separate files. You just store each budget version as a named scenario inside the same worksheet.
Here's how it makes strategic planning so much easier:
- Define Changing Cells: First, you tell Excel which cells are going to change with each plan (like the budget for social media, content, and events).
- Create Scenarios: Next, you create and name each scenario—'Aggressive', 'Conservative', 'Expected'—and plug in the right budget numbers for each one.
- Generate a Summary: With just one click, Excel spits out a summary report that lays out every scenario side-by-side, showing how each one affects your bottom line, like the projected ROI.
It’s an incredibly useful tool for showing options to stakeholders because it clearly lays out the potential consequences of each decision.
2. Goal Seek: Finding the Right Input
Okay, new scenario. You're a product manager launching a new gadget, and your non-negotiable goal is to hit $500,000 in profit this year. You've got your costs and sales forecasts figured out, but you need to find that one magic number: the perfect unit price to make it all happen.
This is a job for Goal Seek. It’s brilliant because it works backward. You give it the result you want, and it finds the single input needed to get you there.
Instead of plugging in random prices and hoping for the best, Goal Seek does the grunt work for you. You just point it to your profit formula, tell it the target value is $500,000, and specify which cell (the unit price) it can change.
Excel then runs a ton of quick calculations to find the exact price that makes the math work out. It’s a beautifully simple and effective tool for things like break-even analysis and setting targets. This approach is a lifesaver for many common business problems, as we cover in our guide to practical Excel use cases.
The chart below shows how we've moved from gut-feel forecasting to the kind of structured, automated analysis that powers these tools.
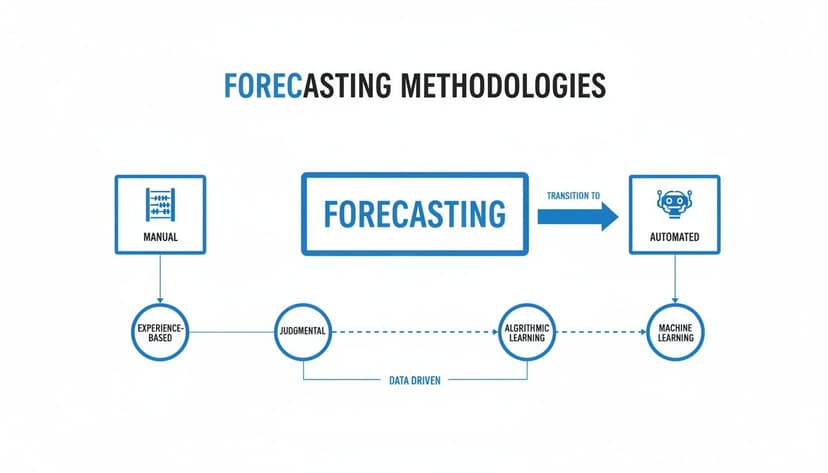
This visual really drives home the shift from slow, intuition-based guesses to the fast, tool-driven analysis that is at the heart of what-if thinking.
3. Data Tables: Seeing How 2 Variables Change the Game
Last one. Picture a real estate investor analyzing a property. They need to understand how two big variables—the mortgage interest rate and the size of their down payment—will affect their monthly payment.
Data Tables are perfect for this. They let you see how a whole range of inputs for one or two variables will change a final number, and they lay it all out in a simple grid. In this case, a two-variable data table is the way to go.
- Set Up Your Model: You’d start with a small calculator section on your sheet with cells for the interest rate, loan term, and down payment, all feeding into the
=PMT()formula for the monthly payment. - Structure the Table: Then, you’d list a range of possible interest rates down a column and different down payment amounts across a row.
- Run the Analysis: Using the Data Table tool, Excel instantly fills in the grid, calculating the monthly payment for every single combination of interest rate and down payment you listed.
What you get is an instant sensitivity matrix. The investor can see at a glance exactly how their monthly costs will change if rates go up or if they put more money down. It gives you a complete picture of all the possibilities in one clean view.
2 Advanced Forecasting Methods with Sensitivity Analysis
While Scenario Manager and Data Tables are great for comparing a handful of specific outcomes, sometimes you need to look beyond just a few possibilities. To truly understand risk and opportunity, you have to explore the full spectrum of what could happen. This is where more advanced techniques, like sensitivity analysis, come into the picture.
Sensitivity analysis is all about pinpointing which variables have the most muscle in your financial model. Think of it as a stress test. Instead of just asking what happens if a number changes, it tells you how much your results will change in response. It reveals the critical factors you absolutely need to keep an eye on.
For instance, what would hurt your net profit more: a 10% drop in sales volume or a 10% jump in the cost of raw materials? A quick sensitivity analysis will give you the answer, showing you exactly where to focus your attention.
1. Identifying Your Most Critical Variables
The whole point is to isolate one variable at a time and see what happens. You systematically tweak your key inputs—things like unit price, customer acquisition cost, or production volume—and watch the effect on your main output, like profit or ROI. This lets you rank all your variables by their impact.
This process helps you answer some pretty important business questions:
- Which costs do we need to manage most carefully?
- Where could a small improvement give us the biggest bang for our buck?
- What are the most serious threats to our financial forecasts?
Getting a handle on these relationships is key to building a business strategy that can withstand a few surprises. To learn more, our guide on AI-powered data analysis covers how modern tools can speed up these kinds of complex evaluations.
2. Introducing Monte Carlo Simulations
If you want to take your analysis to the next level, you can run a Monte Carlo simulation. The name might sound intimidating, but the concept is straightforward. It runs your what-if analysis thousands of times, plugging in random values for your uncertain variables in each run.
The result isn't a single, static number. Instead, you get a full probability distribution showing all the potential outcomes. This changes the question from "Will we hit our target?" to "What's the probability we'll hit our target?" For highly sophisticated forecasting, methods like Monte Carlo backtesting can be used to test how well a financial strategy holds up under countless different market conditions.
By mapping out thousands of potential futures, a Monte Carlo simulation gives you a far more realistic picture of risk. It shows you the likelihood of the best-case, worst-case, and all the scenarios in between, so you can make decisions with a much clearer view of the odds.
Running simulations this detailed used to be a massive project. Not anymore. The global intelligent automation market is expected to hit US$25.8 billion by 2033, largely because AI can now handle these complex spreadsheet analyses effortlessly. With 54.2% of finance teams still bogged down in partially automated workflows, smart tools are changing the game, freeing up countless hours that used to be spent wrestling with Excel.
How to Automate Your Analysis in 2 Steps with an AI Agent
While Excel's built-in tools are incredibly useful, they have a learning curve. You still need to know exactly where to click and what commands to use. But what if you could skip all that manual work? That’s where AI agents like ElyxAI are changing the game, letting you perform a complex what if analysis just by asking for it.
Instead of hunting through menus for the Scenario Manager or trying to remember how to set up a Data Table, you can simply describe what you want to achieve in plain English. The AI acts like an expert assistant, instantly understanding your request and running all the necessary steps right inside your spreadsheet.

1. From Instruction to Insight in Seconds
Let’s say you need to figure out how rising logistics costs will hit your bottom line. Normally, that’s a multi-step process. With an AI agent, you could just type a single prompt:
"Run a what if analysis to see how a 5%, 10%, and 15% increase in shipping costs affects our profit margin for each product category. Then, visualize the results in a bar chart."
An advanced AI agent doesn't just give you instructions—it does the work for you. It reads your request and immediately gets started.
Here’s a quick look at what’s happening behind the scenes:
- It understands your goal: The AI pinpoints the key variables (shipping costs), the changes you want to test (5%, 10%, 15%), the metric you care about (profit margin), and the final output (a bar chart).
- It sets up the analysis: It automatically builds a data table, linking the shipping cost input to the profit margin formula for every category.
- It runs the numbers: The agent then populates the table with the new profit margins for each cost-increase scenario.
- It creates the visual: A clean, professional bar chart is generated comparing the profit margins across all scenarios, making the impact easy to see at a glance.
- It delivers the result: You get a fully formatted table and chart, ready to be dropped into a presentation or report, all without a single click.
This is a powerful example of business process automation (BPA), a field that's growing fast as companies look for ways to work smarter. The global BPA market is expected to hit $19.4 billion by 2026, a huge jump from $9 billion in 2019, all because businesses are eager to get rid of tedious manual tasks. For an analyst wondering how a 25% spike in demand affects inventory, an AI agent can turn hours of work into a single command. You can read more about how organizations are automating workflows on flowforma.com.
2. The True Leap in Productivity
This really is a fundamental shift in how people work with data. The focus moves away from how you do something in Excel and toward what you want to find out. You no longer have to be a master of every feature and formula; you just need to be good at asking the right questions.
This jump in productivity frees you up to explore more scenarios and dig deeper into what the numbers are telling you. An AI assistant for Excel handles the repetitive, mechanical work, letting you focus on interpreting the results and making smarter decisions. It’s the ultimate evolution of what-if analysis—you go from knowing the steps to simply asking for the answer.
5 Best Practices for a Reliable What-If Analysis

Running a what-if analysis is easy. Making sure the results are actually trustworthy? That takes a bit more discipline. It only takes one small error to throw off your entire forecast, turning a helpful tool into a misleading one.
By adopting a few key habits, you can build accurate, defensible analyses every single time. Here are five practices that make all the difference.
1. Build on Clean and Structured Data
Even the most sophisticated model is worthless if it's running on bad data. Before you even think about plugging in scenarios, you have to be confident that your source data is clean, accurate, and organized. It’s the foundation for everything that follows.
This means hunting down duplicates, fixing obvious errors, and smoothing out inconsistencies. A clean dataset is your best defense against the classic "garbage in, garbage out" problem. For a deeper dive, see how AI data cleaning can save you hours of tedious manual work.
2. Document Your Assumptions Clearly
Every what-if analysis hinges on assumptions—things like projected growth rates, expected cost increases, or market shifts. These educated guesses are unavoidable, but they absolutely must be transparent. A common mistake is hardcoding numbers directly into formulas, which makes your model a nightmare to audit or adjust later.
For example, to model a 5% increase in sales, avoid a formula like =A2*1.05. This hardcodes the assumption, making it difficult to find and change later. Instead, use a dedicated input cell.
- Create an Input Cell: Designate a cell (e.g.,
D1) for your growth rate and enter5%into it. - Reference the Cell in Your Formula: Your formula for the new sales figure now becomes
=A2*(1+$D$1).
Formula Explained:
=A2: This is your original sales value.*: The multiplication operator.(1+$D$1): This calculates the growth multiplier.1represents 100% of the original value, and$D$1adds your 5% growth rate. The$signs make it an absolute reference, so if you copy the formula down a column, it will always refer to cellD1.
This simple change lets anyone (including your future self) instantly see and tweak the assumptions driving your forecast.
3. Test a Realistic Range of Scenarios
It's tempting to just test the absolute best-case and worst-case scenarios. While those are important bookends, reality usually plays out somewhere in the vast middle ground. A truly robust analysis explores a much more nuanced range of possibilities.
Try adding these scenarios to your model:
- Most Likely: The outcome based on your most credible projections.
- Slightly Optimistic: A scenario where things go a little better than planned.
- Slightly Pessimistic: A situation with minor headwinds or unexpected challenges.
This approach gives you a much richer, more realistic picture of what could happen. To get the most out of this process, it helps to incorporate established financial modeling best practices into your work.
4. Double-Check Your Results for Logic
When Excel spits out an answer, pause for a moment and ask: does this number actually make sense? This simple sanity check is your best defense against a typo in a formula or a flaw in your logic. If a 10% cost increase completely wipes out your profit, is that realistic, or did a formula go haywire?
Always take a minute to review your outputs and ensure they align with what you know about the business. It’s a good idea to manually trace the calculations for one or two scenarios just to confirm the model is working the way you think it is.
5. Visualize Your Findings
A wall of numbers is tough to interpret, especially for stakeholders who aren't living in the spreadsheet with you. The final, crucial step is to communicate your findings in a way that’s easy to understand. A simple chart or graph can make the impact of different scenarios instantly clear.
Use bar charts to compare outcomes, line charts to show trends over time, or even color-coded tables to highlight the best and worst possibilities. Good visuals turn your analysis from a complex dataset into a compelling story that helps everyone make better decisions.
3 Common Questions About What-If Analysis
As you start exploring what-if analysis in Excel, you'll probably run into a few common questions. Let's clear up some of the most frequent ones so you can pick the right tool for the job and use it confidently.
1. Goal Seek vs. Scenario Manager: What’s the Difference?
This is easily the most common point of confusion. While both are part of Excel's what-if analysis toolkit, they serve completely different purposes.
Here’s a simple way to think about it:
-
Goal Seek works backward. You already know the result you want (your goal), like achieving a $50,000 profit. Goal Seek’s job is to figure out the one specific input you need to change to get there, like the exact number of units you must sell. It’s perfect for finding a single break-even point or a specific target.
-
Scenario Manager works forward. You create a few different possible futures—like "Best Case," "Worst Case," and "Most Likely" sales forecasts—and it shows you where each path leads. It’s built for comparing multiple, distinct possibilities side-by-side.
So, if you have one target and need to find the one input to hit it, use Goal Seek. If you have several different sets of inputs and want to compare all the potential outcomes, Scenario Manager is your tool.
2. Can Data Tables Handle More Than Two Variables?
Another great question. Excel’s Data Tables are fantastic, but they do have a hard limit: they can only handle one or two variables at a time.
You can see how changing interest rates or loan terms impacts a monthly payment. You can even see how both of those variables interact together in a two-variable table. But what if you want to add a third factor, like the down payment amount? You can't do that with a Data Table.
When your analysis involves three or more changing parts, you'll want to turn to Scenario Manager. It was specifically designed to handle models with lots of moving pieces, making it the go-to for comparing more complex situations.
3. Is My Data Safe with an AI Tool?
It’s smart to ask about security, especially when your spreadsheets contain sensitive information. When you use a privacy-first AI agent like ElyxAI, your data’s safety is built into its design.
The AI processes all your information locally on your computer. Your actual data—the numbers, names, and formulas—never leaves your machine. ElyxAI only receives your instructions, not the spreadsheet contents. This approach gives you enterprise-grade security while you get all the benefits of automation.
Ready to stop wrestling with manual steps and start getting answers instantly? ElyxAI is an AI agent that performs your entire what-if analysis workflow from a single command, right inside Excel. Try ElyxAI for free and save hours on your next analysis.
Reading Excel tutorials to save time?
What if an AI did the work for you?
Describe what you need, Elyx executes it in Excel.
Sign up