Master Variance Analysis in Accounting with Excel and AI

Imagine you’ve planned a road trip, carefully budgeting for gas, food, and hotels. After the trip, you review your credit card bill and it doesn't match your plan. Variance analysis is the process of figuring out why. Did gas cost more per gallon? Did you splurge on a fancy dinner? Or did you save money with a cheaper hotel?
In business, variance analysis in accounting is the exact same process. We create a budget as our financial roadmap, but things rarely go exactly as planned. Variance analysis is how we measure and understand the gap between that plan and what actually happened, and we can do it all right within Excel. This guide will show you how to perform variance analysis in Excel, and then take it a step further using AI.
Uncovering the Story Behind Your Numbers with Excel
At its heart, variance analysis isn't about pointing fingers; it’s about understanding the story your numbers are trying to tell you. It helps you dig into the "why" behind your financial performance. By the end of this section, you'll be able to set up a basic variance analysis model in your own spreadsheet.
Spending too much time on Excel?
Elyx AI generates your formulas and automates your tasks in seconds.
Sign up →This process answers crucial questions that every manager needs to ask:
- Did we spend more on raw materials because the supplier raised prices, or did our production team use more than planned?
- Was our revenue higher because we sold more products, or because we charged a higher price?
- Is our team taking longer to finish jobs, or are we paying them a higher hourly rate than budgeted?
To get a clearer picture, let's break down the essential terms. This table provides a quick cheat sheet for the core ideas we'll be using in our Excel examples.
Key Variance Analysis Concepts at a Glance
| Concept | Simple Explanation | Example |
|---|---|---|
| Budgeted/Standard Cost | What you planned to spend or earn. | Budgeting $10 per unit for raw materials. |
| Actual Cost | What you actually spent or earned. | The final invoice shows you spent $12 per unit. |
| Variance | The difference between the planned and actual numbers. | A $2 unfavorable variance per unit ($12 – $10). |
| Favorable Variance | When actual results are better than the budget. | Spending less or earning more than planned. |
| Unfavorable Variance | When actual results are worse than the budget. | Spending more or earning less than planned. |
By getting comfortable with these terms, you're building the foundation needed to turn simple data into powerful business insights using Excel.
How Variance Analysis Came to Be
This might feel like a modern management technique, but its roots go way back. The core ideas became a staple in accounting by the 1950s, giving manufacturing companies a powerful tool to control costs and operate more efficiently.
Today, powerful software like Excel and integrated ERP systems allow us to analyze these variances almost instantly, providing a clearer and faster picture of business performance. Getting this analysis right often falls to professionals with a specific skillset, which you can see in these typical financial analyst job requirements.
By quantifying the difference between expectation and reality, variance analysis transforms raw data into a narrative that explains your business's performance. It’s the diagnostic tool that tells you where your financial health is strong and where it needs attention.
Ultimately, this isn't just an accounting exercise. It's what allows you to make smarter adjustments, fine-tune your operations, and set much more realistic goals for the future. And as we'll see, modern tools like AI integrated into Excel are making this process easier and more insightful than ever.
Diving Into the Main Types of Financial Variances
To truly understand your company's financial performance, you can't just look at the total variance. A single top-line number—say, being $10,000 over budget—doesn't tell you much on its own. It's just a clue. The real story unfolds when you break that number down into its specific components in your Excel sheet.
Think of it this way: a doctor doesn't just say you're "unwell." They run tests to pinpoint the exact cause. Specific variances are your diagnostic tools for financial health, telling you not just that you were off budget, but precisely where the problem (or surprise success) came from.

Material Variances
If your business makes anything tangible, from cupcakes to circuit boards, the cost of raw materials is a huge part of your budget. Material variances get to the heart of this by measuring the gap between what you expected to spend on materials and what you actually spent.
This is usually split into two key areas:
- Material Price Variance: Did you pay more or less for materials than you planned? An unfavorable variance here might mean your supplier hiked their prices unexpectedly. Or maybe you had to scramble and buy from a pricier vendor to meet a deadline.
- Material Quantity (or Usage) Variance: This variance looks at efficiency. Did your production team use more or less material than the standard recipe calls for? An unfavorable result could signal anything from production line waste and faulty equipment to poor-quality materials that required more rework.
Labor Variances
Your people are one of your biggest and most important investments. Labor variances dig into how effectively that investment is paying off. Just like with materials, we can split this into two parts to get a much clearer picture of what's happening on the factory floor or in the office.
These variances separate the cost of labor from the time spent on a task.
It's crucial to look at both rate and efficiency together. You might get a great deal on labor rates (a favorable variance), but if those workers take twice as long to finish a job (an unfavorable efficiency variance), you could still end up losing money.
The two main labor variances are:
- Labor Rate Variance: Were your hourly labor costs higher or lower than budgeted? Things like unplanned overtime, shifting more work to senior (and more expensive) staff, or even new union agreements can all cause a variance here.
- Labor Efficiency Variance: Did your team complete the work faster or slower than the standard time you allotted? If you see an unfavorable variance, it might be a sign that your team needs better training, your processes are clunky, or your equipment is due for an upgrade.
Overhead Variances
Finally, overhead variances tackle all the indirect costs of keeping the lights on—things like rent, utilities, insurance, and administrative salaries. These expenses aren't tied to producing one specific item, but they're absolutely essential for the business to function.
For most companies, digging into these numbers is a non-negotiable part of their overall budget vs. actual reporting.
By analyzing each of these variance types in Excel, you go from staring at a big, confusing number to having specific, actionable insights. You suddenly know exactly which lever to pull—whether that means talking to a supplier, fine-tuning a production process, or getting a better handle on overtime.
How to Perform Variance Analysis in Excel
Knowing the theory is one thing, but putting variance analysis in accounting into practice in Microsoft Excel is where you gain a valuable skill. It’s powerful, accessible, and allows you to build a solid, repeatable process for digging into your financial data. This section provides a step-by-step guide to get you started.
The process is a simple flow: you compare what actually happened to what you planned, and then you figure out why there's a difference by calculating the price and quantity variances.
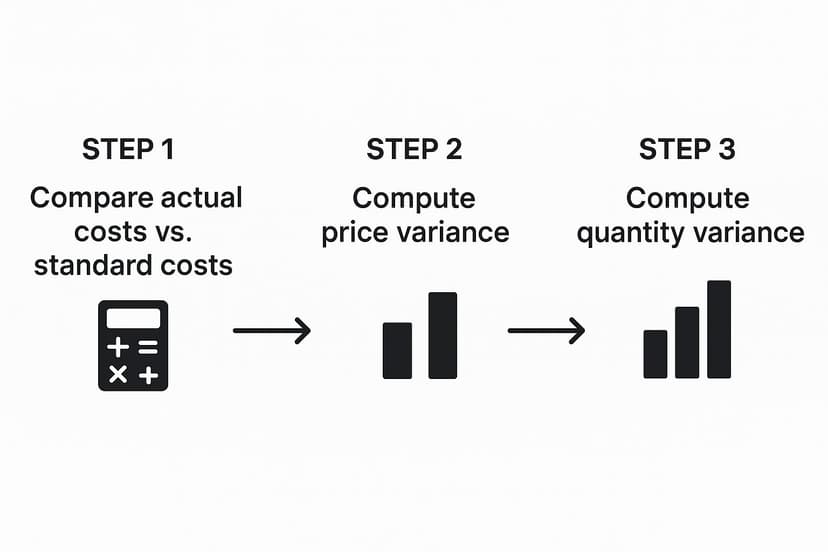
This visual reinforces a key idea: your total variance is really just the sum of its parts. Breaking it down in Excel helps you pinpoint exactly what drove your results.
Step 1: Set Up Your Data in Excel
Before writing a single formula, organize your data. A clean, logical layout is non-negotiable—it prevents errors and makes your report easy for anyone to understand. Create a simple table that puts your budgeted numbers right next to your actual results.
For a manufacturing scenario, you'll want columns like these:
- A: Item: The specific product or material you're analyzing.
- B: Standard Quantity: How much material or labor hours you expected to use per unit.
- C: Standard Price: The cost you budgeted for each unit of material or hour of labor.
- D: Actual Quantity: The amount of material or labor hours you actually used.
- E: Actual Price: The price you actually paid per unit or hour.
Organizing your data this way makes it easy to reference the right cells for your calculations. Once this foundation is in place, you’re ready to build the formulas that will tell the story behind the numbers.
Step 2: Calculate Key Variances with Formulas
With your data neatly arranged, you can calculate the variances using basic Excel formulas. We’ll focus on price variance and quantity (or usage) variance. These two numbers will tell you whether your costs were off because you paid a different price or because you used a different amount.
Let's assume your data for one product is in row 2, and your columns match the setup above.
-
Price Variance Formula: This tells you the impact of paying more or less than planned. In an empty cell (e.g., F2), type:
=(E2-C2)*D2
This formula calculates(Actual Price - Standard Price) * Actual Quantity. -
Quantity/Usage Variance Formula: This measures how efficiently you used your resources. In another cell (e.g., G2), enter:
=(D2-B2)*C2
This formula calculates(Actual Quantity - Standard Quantity) * Standard Price. -
Total Variance: This is the big picture. In cell H2, simply add the results:
=F2+G2
The screenshot below shows a practical example of how these formulas work in a real spreadsheet to figure out sales and cost variances.
It's just a matter of structuring some simple subtractions and multiplications to get to the final variance figures. You now have a reusable template.
Step 3: Visualize Results with Conditional Formatting
Formulas give you the numbers, but visuals help you see what’s important instantly. This is where Excel's Conditional Formatting becomes your best friend. You can set up simple rules to automatically color-code the variance cells, making your report much easier to scan.
By highlighting unfavorable variances (negative numbers) in red and favorable ones (positive numbers) in green, you transform a static table into a dynamic dashboard. This simple technique draws immediate attention to areas that require investigation.
Here’s how to do it:
- First, select the cells that contain your variance calculations (e.g., columns F, G, and H).
- Go to the Home tab, click on Conditional Formatting, and choose Highlight Cells Rules.
- Set a rule for values "Greater Than" 0 to use a green fill (for favorable variances).
- Then, set another rule for values "Less Than" 0 to use a red fill (for unfavorable ones).
This small touch makes your analysis much more powerful, especially when presenting to non-accountants. It closes the gap between raw data and actionable insights.
Using AI in Excel to Enhance Your Variance Analysis
While Excel is fantastic for manual calculations, the next step in mastering variance analysis in accounting is integrating artificial intelligence. When you have an AI tool like Elyx.AI working directly inside your spreadsheets, you can automate tedious calculations and—more importantly—uncover the hidden stories within your data without ever leaving Excel.

Think of an AI assistant as a tireless analyst who can sift through thousands of data points in seconds. It looks for complex patterns and connections that would be nearly impossible for a human to spot. This takes your analysis from just finding a variance to truly understanding why it happened, all with incredible speed and precision.
Automating Insights and Explanations with Simple Prompts
One of the biggest benefits of AI in Excel is its ability to turn raw numbers into a plain-English story. Instead of just seeing an unfavorable labor variance, you can ask an AI tool to investigate.
For example, after identifying a variance, you could prompt the AI:"Analyze the causes for the unfavorable labor efficiency variance in Q3 for the Assembly department. Cross-reference production logs and overtime data."
The AI can then dig into related datasets and suggest likely causes, such as:
- Unexpected downtime on a specific machine last Tuesday.
- A recent raw material shipment from a new supplier that required more handling time.
- An unusually high number of overtime hours logged by a single department.
This ability saves you from hours of manual detective work. The AI handles the heavy lifting of connecting the dots, so you can focus on the bigger picture and what to do next.
By automating the discovery process, AI transforms variance analysis from a reactive, backward-looking exercise into a proactive, forward-looking strategic tool. It helps you anticipate problems before they escalate.
Gaining a Strategic Edge with Predictive Analysis
But AI doesn't just explain what already happened; it can also help you see what's coming. By analyzing your historical variance trends, AI models can start to predict potential budget overruns or efficiency gains. You could ask your AI assistant:"Based on the last 12 months of material price variances, forecast the likely variance for the next quarter and identify the top 3 contributing factors."
This forecasting power lets you make smart adjustments before the period closes, instead of just reacting to bad news after the fact.
The impact here is huge. Studies show that companies using automated variance analysis can slash financial reporting errors by up to 40% and make decisions nearly 30% faster. Finance teams also report that this kind of automation cuts time spent on routine tasks by about 50%, freeing them up for more valuable strategic work.
How to Interpret Variances and Take Action
Getting the numbers is just the first step. The real magic of variance analysis in accounting happens when you figure out what those numbers are telling you and then do something about it. Simply labeling a variance "favorable" or "unfavorable" isn't enough. You have to dig in and uncover the story behind the data to make smart business moves.

Think of a variance as a symptom, not a diagnosis. For example, a large unfavorable labor variance might look like your team is underperforming. But once you start asking questions, you might find out that a batch of poor-quality materials slowed down the whole production line, forcing everyone to work extra hours.
The goal is to move beyond the "what" and get to the "why." A thoughtful investigation turns a simple number into a powerful tool for operational improvement, revealing hidden inefficiencies or unexpected opportunities.
A Framework for Actionable Insights
To make sense of your results, you need a solid game plan. This means asking the right questions, talking to the right people, and creating a clear plan of attack. This process becomes even more powerful within the larger scope of financial reporting automation, where clean data flows make these investigations much smoother.
Start by asking a few key questions:
- Is this a one-off or a pattern? A single spike could just be a blip. But if you see the same unfavorable variance month after month, you're looking at a deeper, systemic issue that needs fixing.
- Whose area is this? Go talk to the department managers involved. The production supervisor will have insights into a material usage variance that a spreadsheet will never show you.
- What’s happening outside our four walls? Did a key supplier suddenly increase their prices? Did a shift in the market affect your sales volume? External factors often play a huge role.
Case Study: Turning Data Into Decisions
Let's say a manager flags a $15,000 unfavorable material price variance. Instead of just noting the overspend, she sits down with the purchasing team. In that conversation, she learns their main supplier had a production issue, forcing them to make a last-minute buy from a more expensive backup vendor.
The solution here isn't to blame the purchasing department. Instead, the team decides to proactively find and get contracts in place with a second-string supplier. This simple action turns a negative variance into a strategic move that makes the entire supply chain more resilient.
Common Questions About Variance Analysis in Excel
Even with a solid process, a few questions always pop up when people start digging into variance analysis in accounting. Let's tackle some of the most common ones so you can feel more confident applying these ideas in Excel.
What Is the Difference Between a Favorable and an Unfavorable Variance?
This is a big one. Think of a favorable variance as a good surprise—any difference that boosts your net income. Maybe you spent less on materials than you budgeted, or you brought in more sales revenue than expected. Both are favorable.
On the flip side, an unfavorable variance is a bad surprise that hurts your bottom line. This is what happens when reality is worse than your plan, like when labor costs come in higher than you thought they would or you miss your sales targets.
It's a classic mistake to just celebrate favorable variances. A surprisingly low material cost might be great, but it could also be a red flag for a quality issue. Or, it might just mean your original budget was way too cautious. Always investigate both types.
Looking into both types of variances is crucial. One tells you where you’re bleeding money, while the other can uncover hidden strengths or flawed planning.
How Often Should a Company Perform Variance Analysis?
There's no single right answer here—it really depends on your business and what you're measuring.
For a fast-moving manufacturing plant, it makes sense to review things like production costs and material usage weekly, or sometimes even daily. This helps managers jump on small problems before they become big ones.
But for bigger-picture financial items, like the company's overall profit and loss statement, a monthly basis is pretty standard. It's usually part of the month-end closing routine. The goal is to find a cadence that lets you act on the information while it's still relevant.
Can Variance Analysis Be Used for Non-Manufacturing Businesses?
Absolutely. The textbook examples often talk about materials and factory labor, but the core idea of comparing what actually happened to what you planned for works for any business with a budget.
Here are a few examples of how to apply it in Excel for other industries:
- A consulting firm can analyze its revenue variance (did we earn more or less in client fees than we projected?) and its labor efficiency (did our consultants log more or fewer billable hours than planned?).
- A retail store can track its sales volume variance (did we sell as many units as we forecasted?), the price variance on its goods, and how its actual marketing spend compared to the budget.
- A SaaS company could look at variances in its customer acquisition cost (CAC) or its monthly recurring revenue (MRR) against the targets in its financial model.
At the end of the day, if you can put a number on it in a budget, you can run a variance analysis on it in Excel.
Ready to supercharge your variance analysis in Excel? Elyx.AI integrates directly into your spreadsheets, automating calculations, generating insights, and turning your raw data into clear, actionable stories with simple text commands. Stop wrestling with formulas and start making smarter decisions, faster.
Discover how Elyx.AI can transform your Excel workflow today!
Reading Excel tutorials to save time?
What if an AI did the work for you?
Describe what you need, Elyx executes it in Excel.
Sign up