Master 10 Key Supply Chain Metrics in Excel for 2025

In today's volatile market, supply chain efficiency isn't just an advantage; it's a necessity for survival. But how do you measure what truly matters? Moving beyond generic reports requires a deep dive into the right Key Performance Indicators (KPIs). Effective management hinges on transforming raw operational data into clear, actionable insights, a process that can feel overwhelming when dealing with disparate information sources. To efficiently collect and manage this data, many organizations rely on robust systems, making a guide to ERP System Implementation highly relevant for understanding the foundational data infrastructure.
This guide solves a concrete problem: how to calculate, track, and analyze the most important supply chain metrics using the tool you already have—Microsoft Excel. We'll provide practical, step-by-step explanations and real-world examples to help you turn complex datasets into strategic decisions.
More importantly, we'll demonstrate how you can supercharge your Excel analysis with AI. Using an AI-powered tool like Elyx.AI, you can automate tedious calculations, generate insightful visualizations, and get answers to complex questions in plain English. You'll leave this article with a new skill: the ability to transform your spreadsheet from a static data repository into a dynamic decision-making engine for your supply chain.
Spending too much time on Excel?
Elyx AI generates your formulas and automates your tasks in seconds.
Sign up →1. Perfect Order Rate
The Perfect Order Rate, often called the Perfect Order Index (POI), is one of the most comprehensive supply chain metrics. It solves the problem of measuring total fulfillment quality by calculating the percentage of orders delivered to customers without any issues. This metric is a powerful indicator of customer satisfaction and operational efficiency because it encapsulates the entire fulfillment process, from order entry to final delivery.
An order is only "perfect" if it meets all the following criteria: delivered on time, complete with all items, damage-free, and with accurate documentation. Even a single error, like a late shipment or a missing invoice, means the order fails the "perfect" test. This all-or-nothing approach provides a holistic view of your supply chain's health.
How to Calculate Perfect Order Rate in Excel
The calculation involves multiplying the success rates of each component. This method highlights how small inefficiencies in different areas can compound to significantly impact overall performance.
The Formula:
Perfect Order Rate = (% of Orders Delivered On Time) x (% of Orders Shipped Complete) x (% of Orders Damage-Free) x (% of Orders with Correct Documentation)
Excel in Practice:
Assume your data is in columns A through D for each component's success rate.
- In cell E2, enter the formula:
=A2 * B2 * C2 * D2 - Format cell E2 as a percentage.
For example, if you have 0.98, 0.99, 0.995, and 0.97 in cells A2, B2, C2, and D2, the result will be 93.6%.
Key Insight: A 93.6% Perfect Order Rate might seem low when individual metrics are all above 97%. This demonstrates how even minor issues across different functions can erode the customer experience. A world-class target is often set at 95% or higher.
How AI in Excel Can Help
Tracking and calculating the Perfect Order Rate in Excel can be tedious, requiring data from multiple sources like your ERP, WMS, and TMS. An AI tool like Elyx.AI simplifies this process entirely.
- Automated Data Consolidation: Instead of manually copying and pasting, use Elyx.AI to automatically pull data from different spreadsheets into a single master sheet.
- Formula Generation: Simply ask Elyx.AI to calculate the Perfect Order Rate. It can generate the formula for you, applying it to your consolidated data columns.
- Root Cause Analysis: If your rate drops, ask Elyx.AI: "Analyze which component (on-time, complete, damage-free, or documentation) had the biggest negative impact on the Perfect Order Rate last quarter." Elyx.AI will instantly pinpoint the weakest link, enabling you to focus your improvement efforts effectively.
2. Cash-to-Cash Cycle Time
The Cash-to-Cash (C2C) Cycle Time is a vital financial supply chain metric that solves the problem of measuring how efficiently a company uses its working capital. It measures the number of days between paying for raw materials and receiving payment from a customer for the final product. A shorter cycle is better, as it means the company can reinvest its cash faster.
This metric uniquely synthesizes inventory, payables, and receivables management into a single, powerful figure. Companies like Dell and Apple famously achieved negative C2C cycles, meaning they receive cash from customers before they even have to pay their suppliers.
The bar chart below illustrates the three core components that determine your Cash-to-Cash Cycle Time.
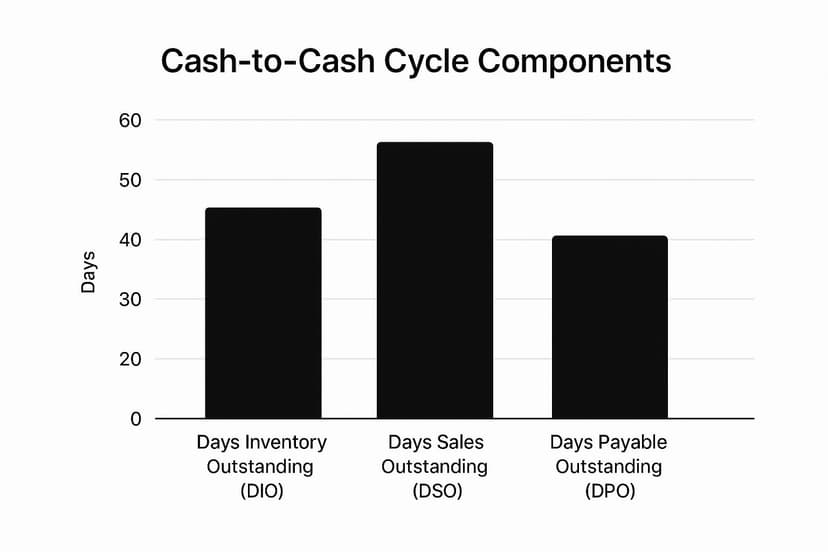
The visualization shows that while inventory (DIO) and receivables (DSO) tie up cash, extending payables (DPO) helps to offset this, improving the overall cycle.
How to Calculate Cash-to-Cash Cycle Time in Excel
The calculation combines three other key metrics: Days Inventory Outstanding (DIO), Days Sales Outstanding (DSO), and Days Payable Outstanding (DPO). The goal is to minimize DIO and DSO while optimizing DPO.
The Formula:
Cash-to-Cash Cycle Time = Days Inventory Outstanding (DIO) + Days Sales Outstanding (DSO) – Days Payable Outstanding (DPO)
Excel in Practice:
- Calculate DIO, DSO, and DPO in separate cells (e.g., A2 for DIO, B2 for DSO, C2 for DPO).
- In cell D2, enter the formula:
=A2 + B2 - C2
For instance, if your company holds inventory for 45 days (DIO), takes 30 days to collect payments (DSO), and takes 50 days to pay its suppliers (DPO), your cycle time is:45 + 30 - 50 = 25 days.
Key Insight: Optimizing C2C isn't about excelling in just one area; it's about balancing all three components. Aggressively extending supplier payments (DPO) might improve your C2C but could damage critical supplier relationships. A holistic approach is essential for sustainable improvement.
How AI in Excel Can Help
Calculating and monitoring the C2C cycle involves pulling data from your accounting, sales, and inventory systems, often housed in different Excel sheets. Elyx.AI streamlines this entire workflow.
- Component Calculation: Instead of manually calculating DIO, DSO, and DPO, ask Elyx.AI to do it for you. For example, prompt: "Calculate Days Sales Outstanding for Q3 using the sales data in Sheet1 and accounts receivable data in Sheet2."
- Automated C2C Reporting: Once the components are calculated, Elyx.AI can automatically compute the final C2C cycle time. You can set it up to generate a monthly C2C report automatically.
- Scenario Analysis: Use Elyx.AI to model how changes would impact your C2C cycle. Ask, "What would be the new Cash-to-Cash Cycle Time if we reduced Days Inventory Outstanding by 10%?" This allows you to test improvement strategies directly in Excel before implementing them.
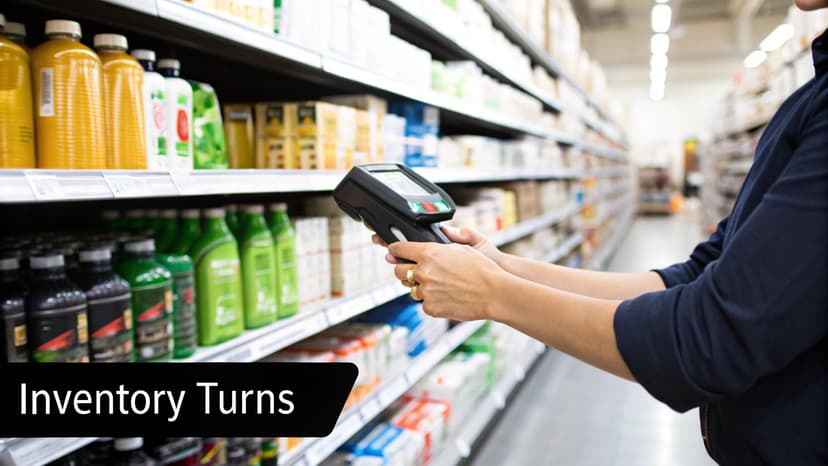
3. Inventory Turnover Ratio
The Inventory Turnover Ratio is a critical financial metric that answers the question: "How efficiently are we managing our stock?" This ratio measures the number of times inventory is sold and replenished over a specific period, providing deep insight into sales performance and making it one of the most fundamental supply chain metrics.
A high turnover rate generally indicates strong sales and effective inventory management. Conversely, a low turnover can signal weak sales, overstocking, or obsolescence. This metric is essential for balancing inventory costs with customer demand to maximize profitability.
How to Calculate Inventory Turnover Ratio in Excel
The calculation is straightforward, comparing the cost of goods sold (COGS) to the average inventory value.
The Formula:
Inventory Turnover Ratio = Cost of Goods Sold / Average Inventory Value
Where Average Inventory Value = (Beginning Inventory + Ending Inventory) / 2.
Excel in Practice:
- Place your COGS in cell A2.
- Place your Beginning Inventory in B2 and Ending Inventory in C2.
- In cell D2, calculate Average Inventory:
=(B2+C2)/2 - In cell E2, calculate the turnover ratio:
=A2/D2
For example, if COGS is $500,000 and average inventory is $50,000, the result is 10. For a deeper dive into inventory formulas, you can explore more about essential inventory management formulas.
Key Insight: The ideal turnover ratio varies dramatically by industry. A grocery store might aim for a ratio above 12 due to perishable goods, while a luxury car dealership’s ratio would be much lower. Comparing your ratio to industry benchmarks is more valuable than aiming for a universal number.
How AI in Excel Can Help
Calculating and tracking inventory turnover in Excel, especially across thousands of SKUs, can be a complex and time-consuming task. Elyx.AI integrates AI into your spreadsheet to streamline this analysis.
- Automated Calculation: Instead of manually setting up formulas, simply ask Elyx.AI: "Calculate the inventory turnover ratio using COGS from sheet1 and inventory data from sheet2." It will generate and apply the correct formula instantly.
- SKU-Level Analysis: Use Elyx.AI to segment your data and identify slow-moving products. You can prompt: "Identify all products with an inventory turnover ratio below 3." This helps you pinpoint which items are tying up capital.
- Trend Monitoring: Ask Elyx.AI to "Create a chart showing the trend of our inventory turnover ratio over the last 12 months." Visualizing this data helps you quickly spot performance changes and make proactive decisions to optimize your stock levels.
4. On-Time In-Full (OTIF)
On-Time In-Full (OTIF) is a critical supply chain metric that solves the problem of measuring supplier reliability. It calculates the percentage of orders delivered according to customer specifications, arriving both on the promised date and with the complete quantity ordered. It directly reflects a company's ability to meet customer promises without errors.
Unlike simpler metrics that track only on-time delivery, OTIF adds the "in-full" component, making it a more holistic indicator of performance. A shipment that arrives on time but is missing 10% of its items is a failure under the OTIF framework. This dual focus is crucial in just-in-time environments where both punctuality and completeness are essential.
How to Calculate On-Time In-Full (OTIF) in Excel
The calculation is a straightforward percentage of total orders that successfully met both the on-time and in-full criteria.
The Formula:
OTIF Rate = (Number of Orders Delivered On-Time and In-Full / Total Number of Orders) x 100
Excel in Practice:
- In column A, list your total orders.
- In column B, use an IF statement to check if an order meets both criteria (e.g., Delivery Date <= Promised Date AND Shipped Qty = Ordered Qty). You can use a formula like:
=IF(AND(C2<=B2, E2=D2), 1, 0)where B/C are dates and D/E are quantities. - Sum column B to get the count of compliant orders.
- Divide the sum by the total count of orders:
=SUM(B:B)/COUNT(A:A)
For example, if you shipped 500 orders and 470 were compliant, your OTIF rate would be 94%.
Key Insight: Many leading retailers like Walmart and Target impose strict OTIF requirements of 95% or higher on their suppliers, issuing financial penalties for non-compliance. This makes OTIF not just a performance metric but a direct factor in profitability and partner relationships.
How AI in Excel Can Help
Manually cross-referencing order dates, delivery confirmations, and item quantities in Excel is prone to errors. An AI tool can automate this.
- Automated Status Checking: Ask Elyx.AI to create a new column that automatically flags each order as "OTIF Compliant" or "Non-Compliant" by comparing promised delivery dates to actual arrival dates and ordered quantities to shipped quantities.
- Root Cause Identification: When your OTIF rate dips, prompt Elyx.AI: "Analyze the non-compliant orders and categorize them by reason: late delivery vs. incomplete shipment." Elyx.AI can instantly segment the data, showing you whether your primary issue lies with logistics timing or inventory and fulfillment accuracy.
- Supplier Performance Dashboards: Ask Elyx.AI to generate pivot tables or charts that track OTIF performance for each of your suppliers. This helps you identify top performers and work with underperforming partners to improve their reliability.
5. Supply Chain Cost as Percentage of Sales
Supply Chain Cost as a Percentage of Sales is a high-level financial metric that solves the problem of connecting operational spending to overall business performance. It measures total supply chain expenses relative to total revenue, providing a comprehensive view of how efficiently the supply chain converts sales into profit.
This metric aggregates all costs associated with supply chain activities, including planning, sourcing, transportation, warehousing, inventory holding, and returns management. By expressing these costs as a percentage of sales, businesses can benchmark their efficiency against industry peers and track the financial impact of improvement initiatives over time.
How to Calculate Supply Chain Cost as a Percentage of Sales in Excel
The calculation is straightforward, but its accuracy depends on correctly identifying and summing all relevant supply chain costs.
The Formula:
Supply Chain Cost as % of Sales = (Total Supply Chain Costs / Total Revenue) x 100
Excel in Practice:
- List all supply chain cost components in a column (e.g., A2:A10).
- In cell B2, calculate the total cost:
=SUM(A2:A10) - In cell C2, enter your Total Revenue.
- In cell D2, calculate the percentage:
=(B2/C2)and format as a percentage.
For instance, if total costs are $800,000 and revenue is $10 million, the result is 8%.
Key Insight: This metric must be analyzed in context. A low percentage is generally good, but not if it comes at the cost of poor customer service (e.g., frequent stockouts or slow delivery). World-class organizations balance this metric with service-level metrics like On-Time Delivery to ensure cost optimization doesn't harm the customer experience. For more on this, learn more about other operational efficiency metrics.
How AI in Excel Can Help
Aggregating cost data from different departments and financial systems in Excel is often a manual and error-prone process. AI streamlines this financial analysis.
- Automated Data Aggregation: Use Elyx.AI to automatically pull cost data from various sources, like accounting software exports, logistics reports, and procurement spreadsheets, into a central worksheet.
- Instant Calculation: Simply ask Elyx.AI to "Calculate the total supply chain cost as a percentage of sales for Q3." It will sum the relevant cost columns, divide by total revenue, and format the result for you.
- Driver Analysis: If the percentage increases, ask Elyx.AI: "Break down the total supply chain cost by category and show which one increased the most last quarter." Elyx.AI will instantly create a summary that pinpoints whether transportation, warehousing, or another area is driving the cost increase.
6. Order Fill Rate
The Order Fill Rate is a critical supply chain metric that answers the question: "Can we fulfill customer demand from our current stock?" It measures the percentage of customer orders fulfilled completely on the first attempt, directly reflecting your inventory availability. A high fill rate is a strong indicator of an efficient inventory management system and leads to higher customer satisfaction.
This metric is a direct, practical measure of your service level. For example, industrial distributors often aim for 95-98% fill rates on high-demand items, while fashion retailers might accept 85-90% to avoid overstocking trendy products.
How to Calculate Order Fill Rate in Excel
The calculation is straightforward, focusing on the ratio of completely fulfilled orders to the total number of orders received.
The Formula:
Order Fill Rate = (Total Number of Orders Shipped Complete / Total Number of Orders) x 100
Excel in Practice:
- List the number of orders shipped complete in cell A2.
- List the total number of orders in cell B2.
- In cell C2, enter the formula:
=A2/B2and format it as a percentage.
For instance, if you shipped 480 orders complete out of 500 total orders, your Order Fill Rate would be 96%.
Key Insight: A 96% fill rate means that 4% of your customers experienced a service failure. Analyzing the root cause of these failures, whether due to forecast inaccuracy, supplier delays, or poor inventory placement, is essential for continuous improvement.
How AI in Excel Can Help
Manually tracking which orders were shipped complete across thousands of transactions in Excel is time-consuming and prone to error. AI streamlines this analysis.
- Automated Calculation: Connect your order data from your ERP or sales spreadsheets. Simply ask Elyx.AI, "Calculate the Order Fill Rate for last month." It will generate the correct formula and apply it to your data in seconds.
- Root Cause Analysis: Go deeper by asking diagnostic questions. For example, prompt: "Which products contributed most to incomplete orders last quarter?" Elyx.AI will analyze your data and highlight the specific SKUs causing stockouts, helping you prioritize inventory adjustments.
- Segmentation Analysis: Use Elyx.AI to segment your fill rate performance. Ask, "Compare the Order Fill Rate for A, B, and C inventory items." This helps you see if your inventory policies are effectively supporting your most important products.
7. Supplier Quality Index (Supplier Defect Rate)
The Supplier Quality Index, also known as the Supplier Defect Rate, is one of the most critical upstream supply chain metrics. It solves the problem of measuring incoming material quality by tracking the percentage of goods received from suppliers that do not meet specifications. This metric is a direct reflection of your supply chain's foundation, as poor incoming quality can trigger a cascade of negative effects downstream.
A high defect rate leads to increased inspection costs, production disruptions, scrap, and ultimately, customer dissatisfaction. By tracking this metric, businesses can proactively manage supplier relationships, ensure product integrity, and protect their brand reputation.
How to Calculate Supplier Quality Index in Excel
The calculation is straightforward, focusing on the ratio of unacceptable units to the total number of units received.
The Formula:
Supplier Quality Index = (Number of Defective Units Received / Total Number of Units Received) x 100
Excel in Practice:
- Place the number of defective units in cell A2.
- Place the total units received in cell B2.
- In cell C2, enter the formula:
=A2/B2and format it as a percentage.
For example, if you received 10,000 components and found 75 to be defective, your Supplier Quality Index would be 0.75%.
Key Insight: While a low unit price might be attractive, a high supplier defect rate can quickly erase those savings through hidden factory costs like rework, downtime, and warranty claims. World-class organizations often demand defect rates below 0.5%, with critical industries like medical devices or aerospace targeting rates closer to 0.1% or even lower.
How AI in Excel Can Help
Managing supplier quality data from different logs and reports can be a manual and error-prone task in Excel. AI streamlines this workflow.
- Automated Data Aggregation: Use Elyx.AI to instantly consolidate purchasing receipts and quality inspection data from various Excel sheets into a single, analysis-ready table.
- Instant KPI Calculation: Instead of manually creating formulas, simply ask Elyx.AI: "Calculate the Supplier Defect Rate for each supplier for Q3." It will generate the correct formula and apply it across your dataset.
- Supplier Performance Analysis: Go deeper by asking qualitative questions. For instance, prompt: "Which supplier had the highest defect rate last month, and what were the most common defect types for their products?" Elyx.AI can parse the data to provide an immediate, actionable answer.
8. Forecast Accuracy
Forecast Accuracy measures how closely your demand predictions align with actual customer sales. This foundational metric solves the problem of balancing supply and demand, as it is a critical input for nearly every major decision in your supply chain, from inventory planning to logistics. It is one of the most important supply chain metrics for preventing costly operational inefficiencies.
High forecast accuracy helps minimize two major problems: stockouts, which lead to lost sales, and excess inventory, which ties up working capital. Getting this metric right creates a ripple effect of efficiency across the entire supply chain.
How to Calculate Forecast Accuracy in Excel
A common way to measure forecast error is with the Mean Absolute Percentage Error (MAPE). Forecast Accuracy is then calculated as the inverse of this error.
The Formula:
MAPE = (1/n) * Σ |(Actual Demand – Forecast Demand) / Actual Demand| * 100
Forecast Accuracy = 100% – MAPE
Excel in Practice:
- List actual sales in column A and forecasted sales in column B.
- In column C, calculate the absolute percentage error for each row:
=ABS((A2-B2)/A2) - At the bottom of column C, calculate the average:
=AVERAGE(C:C). This is your MAPE. - In another cell, calculate accuracy:
=1 - [MAPE_cell]and format as a percentage.
Key Insight: A world-class forecast accuracy is often considered 85% or higher, but this varies by industry. For instance, fast-fashion retailers might accept 60-70% accuracy and build flexibility into their supply chain, while pharmaceutical companies with long lead times aim for 70-80%.
How AI in Excel Can Help
Calculating, tracking, and improving Forecast Accuracy in Excel often involves complex formulas and manual data alignment. AI streamlines this workflow.
- Automated Calculation: Instead of building complex MAPE formulas, simply ask Elyx.AI to calculate the forecast accuracy for your products. It can compare columns of actual sales against forecasted figures and generate the accuracy percentage instantly.
- Identify Biggest Errors: Use Elyx.AI to pinpoint which products or regions have the lowest accuracy. Ask: "Which 10 SKUs had the highest forecast error last month?" This helps you focus your improvement efforts where they matter most.
- Trend Analysis: Ask Elyx.AI to "Analyze the forecast bias for our top product line." It can quickly determine if you are systematically over-forecasting or under-forecasting, a critical insight for refining your prediction models. Learn more about the various business forecasting methods on getelyxai.com to further enhance your strategy.
9. Transportation Cost per Unit
Transportation Cost per Unit is a fundamental supply chain metric that solves the problem of understanding logistics cost efficiency. It measures the average expense to ship a single item, which is crucial for evaluating carrier performance, optimizing shipping routes, and informing pricing strategies.
By breaking down costs to this granular level, companies can effectively identify key opportunities for cost reduction. For instance, a CPG company might track a cost per case of $1.50, while an e-commerce business may face a higher cost of $7 per package for residential deliveries.
How to Calculate Transportation Cost per Unit in Excel
The calculation is straightforward, focusing on the relationship between total transportation spending and the volume of goods moved.
The Formula:
Transportation Cost per Unit = Total Transportation Costs / Total Number of Units Shipped
Excel in Practice:
- In cell A2, enter your total transportation costs.
- In cell B2, enter the total number of units shipped.
- In cell C2, calculate the cost per unit:
=A2/B2
For example, if a company spent $50,000 on transportation and shipped 25,000 units, the cost per unit would be $2.00.
Key Insight: While a low cost per unit is desirable, it must be balanced with service levels and inventory costs. The cheapest shipping option may not be the best if it leads to stockouts or dissatisfied customers. For practical methods to optimize this, explore top strategies to reduce shipping costs.
How AI in Excel Can Help
Calculating this metric across thousands of shipments in Excel, segmented by carrier, lane, and product, can be a complex data-wrangling task. AI streamlines this analysis.
- Automated Cost Allocation: Use Elyx.AI to automatically pull freight invoices and shipment data from separate sheets. It can match invoices to shipments and allocate total costs across the units in each shipment.
- Segmented Analysis: Simply ask Elyx.AI to calculate the cost per unit for different segments. You can prompt: "Calculate the average transportation cost per unit for each shipping lane in Q3."
- Identify Cost Drivers: Go deeper by asking Elyx.AI to find anomalies. For example: "Identify which product categories have the highest transportation cost per unit and compare it to their product value." This helps you spot where shipping costs are disproportionately high.
10. Supply Chain Cycle Time
Supply Chain Cycle Time solves the problem of measuring end-to-end operational speed. It tracks the total time required to fulfill a customer order from start to finish, capturing the responsiveness and agility of your entire operation. A shorter cycle time is a key indicator of an efficient supply chain, directly impacting customer satisfaction.
This metric is particularly critical in industries where speed-to-market provides a competitive advantage, such as fast fashion or e-commerce. A shorter cycle time means you can meet customer demand faster and reduce working capital tied up in inventory. For example, Zara's ability to move a design from concept to store in 2-3 weeks is a direct result of its hyper-efficient cycle time.

How to Calculate Supply Chain Cycle Time in Excel
The calculation is the sum of the time spent in each major stage, from initial order processing to final delivery.
The Formula:
Supply Chain Cycle Time = Order Processing Time + Production Time + Delivery Time
Excel in Practice:
- In column B, have the 'Order Date' timestamp. In column C, have the 'Delivery Date' timestamp.
- In column D, calculate the cycle time in days for each order:
=C2-B2 - Calculate the average of column D to find your average cycle time.
For instance, if it takes 1 day to process an order, 7 days to manufacture, and 3 days for delivery, the total cycle time is 11 days.
Key Insight: Reducing the average cycle time is important, but reducing its variability is often more critical. An unpredictable cycle time makes it impossible to give customers reliable delivery dates, leading to poor service levels and increased buffer stock.
How AI in Excel Can Help
Calculating and analyzing cycle time in Excel can be challenging, as it requires pulling and aligning date and time data from multiple systems. AI makes this analysis effortless.
- Automated Time Calculation: Use Elyx.AI to automatically consolidate order, production, and shipping logs. You can then ask it to calculate the duration between different timestamp columns (e.g., "Calculate the difference in days between the 'Order Date' and 'Delivery Date' columns").
- Bottleneck Identification: If your cycle time is too long, ask Elyx.AI: "Analyze the average time spent in each stage (processing, production, delivery) to identify the biggest bottleneck in our supply chain cycle time for last month."
- Variability Analysis: Go beyond averages by asking Elyx.AI to analyze consistency. You could ask, "Calculate the standard deviation for our total Supply Chain Cycle Time and highlight any orders that were more than two standard deviations above the average." This instantly flags outliers that need investigation.
Supply Chain Metrics Comparison Table
| Metric | Implementation Complexity 🔄 | Resource Requirements ⚡ | Expected Outcomes 📊 | Ideal Use Cases 💡 | Key Advantages ⭐ |
|---|---|---|---|---|---|
| Perfect Order Rate | High — involves multiple data sources & rigorous tracking | High — robust data collection & real-time monitoring | Comprehensive view of order fulfillment quality | Supply chains aiming for end-to-end fulfillment excellence | Holistic metric linking multiple supply chain areas |
| Cash-to-Cash Cycle Time | Moderate — requires financial & operational data integration | Moderate — data across inventory, sales, payables | Improved working capital efficiency & cash flow | Companies focused on liquidity and cash flow optimization | Links supply chain operations directly to finance |
| Inventory Turnover Ratio | Low — straightforward calculation from financial data | Low to Moderate — requires inventory and sales data | Measures inventory management efficiency | Businesses managing inventory investments | Simple indicator of inventory usage efficiency |
| On-Time In-Full (OTIF) | Moderate to High — coordination across sales, planning, logistics | Moderate — tracking order delivery & completeness | Higher customer satisfaction and reduced disruptions | Retail and manufacturing with just-in-time needs | Combines timeliness and completeness for customer focus |
| Supply Chain Cost as % of Sales | Moderate — needs cost accounting & revenue data alignment | Moderate — cross-functional cost tracking required | Holistic view of supply chain cost efficiency | Executive-level cost performance monitoring | Links financial outcomes with supply chain operations |
| Order Fill Rate | Moderate — requires inventory & order fulfillment data | Moderate — inventory systems and demand forecasting | Direct measure of service level and inventory availability | Customer service focused supply chains | Clear metric of immediate order fulfillment capability |
| Supplier Quality Index | High — requires detailed inspection & quality data capture | High — incoming inspection systems and supplier data | Reduced defects & supplier-related quality issues | Quality-sensitive manufacturing & regulated industries | Early supplier issue detection, cost reduction |
| Forecast Accuracy | Moderate — statistical methods & demand data needed | Moderate — forecasting systems & data analytics | Better inventory & capacity planning | Demand-driven planning environments | Drives improvements in demand planning and inventory |
| Transportation Cost per Unit | Low to Moderate — requires shipping cost and volume data | Moderate — transport management systems | Optimized shipping costs & carrier performance | Logistics-heavy distribution and transportation networks | Enables cost vs. service trade-off decisions |
| Supply Chain Cycle Time | High — end-to-end process mapping & timing data needed | High — cross-functional data & process integration | Faster order fulfillment and responsiveness | Speed-sensitive industries like e-commerce and manufacturing | Identifies bottlenecks, enhances agility and responsiveness |
Turn Metrics into Momentum: Building a Smarter Supply Chain with AI-Powered Excel
We have journeyed through ten foundational supply chain metrics, from the precision of the Perfect Order Rate to the velocity of the Cash-to-Cash Cycle Time. You now have the practical Excel skills to calculate each one. However, the true value of these metrics is not unlocked by simply calculating them; it's unleashed when you transform this raw data into strategic momentum.
The core takeaway is this: measurement is just the beginning. The real challenge lies in making these numbers talk—connecting a low inventory turnover ratio to your working capital, or linking a dip in OTIF rates to a specific supplier issue. This is where many organizations falter, drowning in a sea of spreadsheets without a clear path to actionable insights. The goal is to create a living, breathing dashboard that doesn't just report the past but helps you shape the future.
From Static Numbers to Strategic Intelligence
Moving beyond isolated calculations requires a shift in mindset and tools. Your Excel workbook, the daily driver for so much business analysis, can become a dynamic command center for your supply chain. Instead of treating metrics like static report cards, think of them as interconnected levers you can pull to drive real-world results.
- Connect the Dots: Don't analyze metrics in a vacuum. A poor Supplier Quality Index will inevitably impact your Perfect Order Rate. Similarly, a high Forecast Accuracy can drastically improve your Inventory Turnover. Use your Excel dashboard to visualize these relationships and understand the ripple effects of your decisions.
- Establish a Cadence: Data is only useful if it's timely. Establish a regular review cadence for your key supply chain metrics (daily, weekly, or monthly) to spot trends before they become problems. Consistency turns measurement into a proactive management habit rather than a reactive, fire-fighting exercise.
- Democratize Data: The insights gleaned from your metrics shouldn't be confined to the supply chain team. Share relevant dashboards with sales, finance, and marketing. When everyone understands how their actions impact metrics like Order Fill Rate or Supply Chain Cost, you foster a culture of shared accountability.
Amplifying Your Analysis with AI in Excel
The crucial next step is to accelerate this entire process with intelligence. Manually wrangling data, building complex formulas, and trying to spot subtle correlations is time-consuming and prone to human error. This is precisely where an AI co-pilot like Elyx.AI transforms your capabilities directly within Excel.
Imagine asking your spreadsheet questions in plain English, such as, "Generate a pivot table showing the average Transportation Cost per Unit for each shipping lane last quarter," and watching it appear instantly. Or, "Highlight all products with an Inventory Turnover Ratio below our benchmark of 6." This is no longer a futuristic concept. AI assistants remove the technical barriers, allowing you to focus on strategic thinking instead of formula syntax. They automate the tedious data cleansing and aggregation, freeing you to ask deeper, more impactful questions. By integrating AI, you are not just tracking supply chain metrics; you are engaging in a dynamic conversation with your data, uncovering insights that would otherwise remain hidden.
Your journey toward a smarter, more resilient supply chain begins with the decision to move from passive measurement to active, intelligent management. Start small. Select three crucial metrics from this list that align with your most pressing business goals, build a simple tracking dashboard in Excel, and begin your analysis. By embracing these metrics and augmenting your workflow with AI, you will turn data into decisions, and decisions into a decisive competitive advantage.
Ready to stop wrestling with formulas and start getting answers from your supply chain data? Elyx.AI integrates directly into your Excel workflow, allowing you to automate calculations, generate instant visualizations, and ask complex questions in simple language. See how you can build a powerful supply chain dashboard in a fraction of the time at Elyx.AI.
Reading Excel tutorials to save time?
What if an AI did the work for you?
Describe what you need, Elyx executes it in Excel.
Sign up