Create Your Monthly Financial Report Template in Excel Easily

A monthly financial report template is a crucial document for understanding the financial pulse of your business. It's a standardized framework for tracking key financial metrics, typically built around the three core statements: the Income Statement, Balance Sheet, and Cash Flow Statement. Think of it as a consistent, reliable snapshot that helps you make informed, data-driven decisions.
This guide will walk you through building a practical and automated monthly financial report template in Excel, showing you how to leverage AI to handle the tedious work so you can focus on analysis.
Why Bother With an Automated Report Template in Excel?

Spending too much time on Excel?
Elyx AI generates your formulas and automates your tasks in seconds.
Sign up →If you've ever manually pieced together financial reports each month, you know the pain. It’s not just tedious; it's a significant business risk. You wrestle with scattered spreadsheets, inconsistent formulas, and spend hours copying and pasting data. This manual grind is a recipe for costly errors and missed insights.
This is where an automated monthly financial report template in Excel changes the game. It establishes a single, reliable source of truth.
It's not just about saving a few hours. The real win is clarity. A well-designed template ensures every report follows the same structure and uses the same calculations. This consistency is essential because it lets you make accurate, apples-to-apples comparisons over time.
This is critical for:
- Tracking Performance: At a glance, you can see if revenue is trending up, if costs are in check, and whether you're hitting your profit targets.
- Managing Cash Flow: You can stay ahead of your cash position, sidestepping potential shortfalls and making smarter decisions about where to invest your money.
- Spotting Trends Early: Good data helps you identify patterns in your financials that might signal a new opportunity or a brewing problem.
Seeing the Bigger Picture
A standardized report becomes truly powerful when you connect your internal numbers to what's happening in the broader market. For instance, these templates are an essential tool for tracking metrics like profit and loss against market shifts. According to World Bank analysis, economies constantly see changes in inflation and production, and your financial forecasts need to account for that to be accurate.
The real value of an automated template is transforming data from a historical record into a forward-looking guide. It answers not just "what happened?" but "what's next?"
To really grasp the potential here, it's worth digging into the world of financial reporting automation. Making the switch from manual work to a streamlined, automated system is how you start turning raw numbers into real business intelligence.
How to Build Your Monthly Financial Report Template in Excel
Alright, let's get into the nuts and bolts of building your Excel template. This is where we move from theory to action. A great monthly financial report template isn't just a random collection of cells; it's a thoughtfully designed system. The goal is to build something where data flows logically, formulas are easy to understand, and updating one number doesn't create a domino effect of manual fixes.
We’re aiming for a foundation that's both solid and flexible enough to grow with your business.
The first step is to give each of the three core financial statements its own dedicated tab in your Excel workbook. Each one tells a different, crucial part of your company's story. Separating them keeps things tidy and makes your analysis much clearer.
Laying Out the Three Core Statements
Let's start by creating a separate worksheet for each of these key reports. This is non-negotiable for a clean setup.
- The Income Statement: This is all about profitability. It's the story of your revenue, your cost of goods sold (COGS), and all your operating expenses over the month. The bottom line? Your net income or loss.
- The Balance Sheet: Think of this as a financial snapshot on a specific day. It lays out what you own (assets), what you owe (liabilities), and the owner's stake (equity). It's all governed by the classic accounting equation: Assets = Liabilities + Equity.
- The Cash Flow Statement: This one is critical. It tracks every dollar coming in and going out, breaking the movement down into operating, investing, and financing activities. It gives you the real story on your cash position.
Once you have these tabs set up, it’s time to add some structure. A crucial best practice is to use Excel's Table feature (Insert > Table). Tables are a game-changer because they automatically expand when you add new data, which makes your formulas far more dynamic and easier to maintain.
For example, instead of a rigid formula like =SUM(C5:C30), a table lets you write something clean and descriptive, like =SUM(Income_Statement_Table[Revenue]). This is far more readable and less prone to errors.
Here’s a quick overview of what each statement should contain to get you started.
Core Components of Your Financial Report Template
| Financial Statement | What It Tells You | Key Metrics to Include |
|---|---|---|
| Income Statement | Measures profitability over a period (e.g., one month). | Revenue, COGS, Gross Profit, Operating Expenses, Net Income |
| Balance Sheet | Provides a snapshot of financial health at a point in time. | Current & Fixed Assets, Current & Long-Term Liabilities, Equity |
| Cash Flow Statement | Tracks the actual cash moving in and out of the business. | Cash from Operations, Cash from Investing, Cash from Financing |
This table gives you the essential building blocks. Each metric tells a piece of the story, and together they provide a comprehensive view of your business's performance.
Another pro-tip is to use Named Ranges. Let’s say you’re constantly referencing your net income. Instead of clicking on cell G28 every time, you can name that cell "Net_Income." This simple trick makes it incredibly easy to link your Income Statement to your Balance Sheet and Cash Flow Statement, creating a report that updates automatically.
When you build these logical links from the very beginning, you create an interconnected financial model. A change in revenue on your Income Statement will flow through automatically to update retained earnings on the Balance Sheet. This is how you ensure accuracy without constant manual checks.
Letting AI Handle the Data Cleanup in Excel
So, you’ve built your template. That's a great start, but now comes the part most people dread: wrangling the raw data. This is where monthly reporting often grinds to a halt. You’re faced with a messy export from your bank or accounting software, and it’s up to you to prepare it for your report.
Let's be honest, manually fixing inconsistent dates, correcting typos in vendor names, and trying to categorize every single transaction is a soul-crushing task. It can take hours, and it's frustratingly easy to make a mistake.
This is exactly where an AI tool that works inside Excel, like Elyx.AI, can be a game-changer. Instead of slogging through the data row by row, you can tell the AI what you need with a simple command. It takes that chaotic data dump and turns it into a clean, organized table ready for analysis—and it does it in minutes, not hours.
The image below gives you a sense of how a typical income statement comes together, but it all starts with having clean, structured data as your foundation.
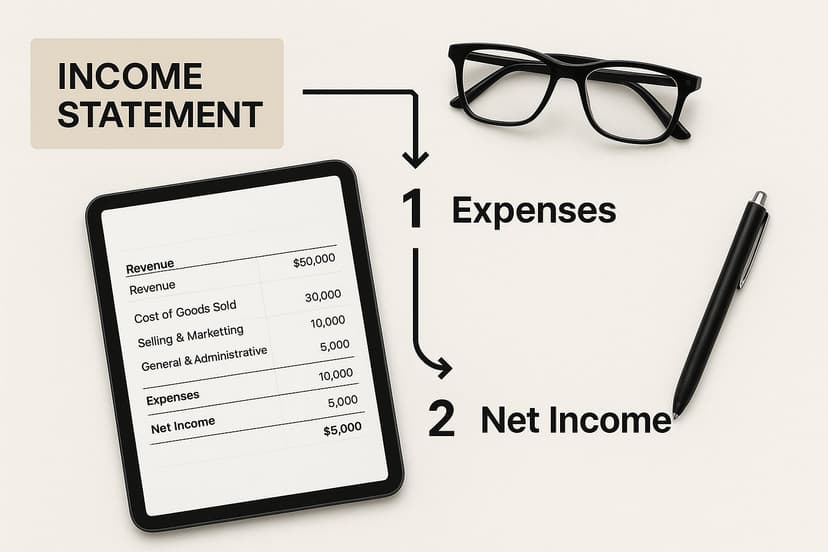
Without that clean starting point, everything that follows—from your P&L to your cash flow statement—is built on shaky ground.
A Real-World Example of Data Cleaning with AI
Picture this: you've just downloaded your monthly transaction history as a CSV file. It’s a complete mess.
- Some dates look like "05/10/2024" while others are "Oct-05-24".
- Vendor names are inconsistent, like "Staples Inc." in one row and "STPLS" in another.
- You have hundreds of transactions you need to assign to categories like "Office Supplies," "Software," or "Utilities."
The old way would be to pour a fresh cup of coffee and start correcting everything by hand. The new way? Let an AI assistant handle it.
- To fix the dates: Just select the date column and type a prompt like, "Convert this column to MM/DD/YYYY format." Done.
- To categorize everything: Highlight the transaction descriptions and tell the AI, "Create a new 'Category' column and classify each transaction based on its description."
- To catch errors: You can even ask it to "Find and flag any duplicate transactions in this table."
This approach transforms a tedious chore into a quick, automated workflow. If you want to see more examples of this in action, check out our guide on automated data cleaning in Excel.
The biggest win here isn't just speed; it's accuracy. Automation virtually eliminates the human error that inevitably creeps in during manual data entry. You can finally trust that your report is built on solid, reliable information.
By handing off these repetitive tasks to AI, you get your time back. You can finally focus on what really matters: analyzing the numbers and figuring out what they mean for the business. The result is a reporting process that's not only faster but also far more trustworthy.
Finding the Story in Your Numbers
Once your data is clean and structured in your Excel template, the real fun begins. This is the point where your monthly financial report template stops being a static spreadsheet and starts becoming a strategic powerhouse. By bringing an AI assistant like Elyx.AI into your Excel workflow, you essentially get a data analyst on-demand, right inside your worksheet.
The magic here is moving beyond just looking at numbers. Instead of wrestling with pivot tables or trying to remember complex formulas, you can simply ask questions in plain English. This makes financial analysis approachable for everyone, not just the Excel wizards on your team. You can finally get straight to the "why" behind the figures.
Asking the Right Questions in Excel
Let's say you're looking at your expenses and something feels off. Instead of spending an hour filtering and sorting, you could just ask the AI:
- "Show me the top 3 biggest differences between this month's and last month's operating expenses."
- "What's our gross profit margin trend over the last 6 months?"
- "Which expense category grew the most, percentage-wise, this quarter?"
The AI crunches the numbers for you in seconds and gives you a clear, simple summary. Suddenly, you're having a conversation with your data, not just staring at it.
This kind of quick analysis is crucial for reacting to what's happening in the wider economy. For instance, businesses across the United States use their monthly reports to see how consumer behavior is shifting. You could pull in public data on personal income and spending from a source like the U.S. Bureau of Economic Analysis website and analyze it right alongside your own numbers to see the real-world impact on your bottom line.
Using AI for analysis isn't just about making calculations faster; it's about discovering insights you might have missed. It helps you find the story behind the data, so you can make smarter decisions for your business.
Creating a Dynamic Financial Dashboard

Let's be honest, a giant spreadsheet full of numbers isn't going to grab anyone's attention. After you've cleaned your data and analyzed the key trends, the final step is bringing that financial story to life with a visual dashboard. This is the moment your monthly financial report template transforms from a simple data file into a genuine decision-making tool.
The whole point is to build a clean, one-page summary that anyone—from your CEO to a department head—can understand at a glance. You're taking the guesswork out of it. Instead of making them hunt through rows and columns, you’re serving up clear, visual answers about the company's financial health.
This dashboard ensures your key findings don't just get buried in a file, but get seen and acted upon.
Choosing the Right Visuals for Your Data
Picking the right chart for the right data point is crucial. Each type of chart tells a different part of the story effectively.
-
Line Charts: These are your go-to for showing trends over time. Want to see how revenue has grown over the last quarter? Or track customer acquisition costs month-over-month? A line chart makes those patterns instantly clear.
-
Bar Charts: Perfect for comparing different categories. Use them to show which department is spending the most or how sales stack up across your product lines. It’s a simple, powerful way to compare distinct groups.
-
Waterfall Charts: These are fantastic for visualizing how an initial value is affected by a series of intermediate positive or negative values. Think of breaking down your monthly cash flow—starting with net income and showing how each expense and revenue source brought you to your final cash balance.
Matching the visualization to the data isn't just about making things look pretty; it's about clarity and preventing misinterpretation.
A great dashboard is a living dashboard. When you link your charts directly to your cleaned data tables in Excel, they update automatically as soon as you drop in the new month's numbers. It’s no longer a static document but a real-time view of your business.
Building these reports does more than just help with internal decisions. Consistent monthly reporting is a cornerstone of healthy credit and investment markets. In fact, research from J.P. Morgan highlights that reliable monthly financial data is essential for evaluating credit quality and risk on a larger scale.
Common Questions About Building Financial Templates in Excel
When you start building a financial report from scratch, a few questions always seem to pop up. Here are some of the most common ones, along with practical solutions.
How Do I Handle Multi-Currency Reporting?
The best practice is to keep things separate but connected. In your raw data sheet, create a column for the original transaction currency right next to a column for your main reporting currency (like USD or EUR).
Then, dedicate a single cell somewhere prominent in your workbook to input the monthly exchange rate. A simple multiplication formula can then convert every transaction. This keeps your model clean and easy to update. For a more advanced setup, you can use Excel’s data features or an API to pull live exchange rates automatically, ensuring your report is always accurate.
What are the Biggest Mistakes People Make?
The number one mistake is hardcoding numbers directly into formulas. It feels like a quick shortcut, but it turns your monthly update process into a nightmare of hunting for cells to edit. Always use cell references! Another common issue is inconsistent formatting—random dates, text in number fields—which can break your formulas and charts.
A great template is a focused template. Avoid the trap of adding every metric you can think of. A clean, simple report that highlights the numbers needed for real decisions is infinitely more valuable than a cluttered one nobody can decipher.
Can AI Actually Help with Forecasting in Excel?
Absolutely. This is where AI becomes incredibly powerful. Once you have a few months of clean, historical data in your template, AI tools can help you generate forecasts without needing to be a statistics expert.
You can give an AI assistant a simple instruction, like you're talking to a colleague:
- "Analyze the revenue trend for the last six months."
- "Based on this data, project sales for the next quarter using linear regression."
- "Identify any seasonality in our expense data."
The AI does the heavy lifting in seconds, giving you a solid, data-driven forecast to inform your strategy.
How Can I Keep My Financial Data Secure with AI?
This is a critical question. Financial data is sensitive, so security is paramount. The key is to choose an AI tool that either processes data locally on your computer or is designed with enterprise-grade privacy and security protocols.
Stick to reputable Excel add-ins that have been vetted for security. And here’s a golden rule: never paste sensitive financial information into a public web-based AI chatbot. Only use tools built for business that take data protection and encryption seriously.
Ready to stop wrestling with formulas and start having a conversation with your data? Elyx.AI plugs right into Excel, letting you clean data, spot trends, and find insights using simple, plain English. It’s time to move from manual work to automated intelligence.
Try Elyx.AI for free and build your smartest financial report yet!
Reading Excel tutorials to save time?
What if an AI did the work for you?
Describe what you need, Elyx executes it in Excel.
Sign up