7 Steps on How to Use Excel AI Tools to Boost Your Productivity

Staring at a messy spreadsheet full of raw data? The quickest way to get started with AI in Excel is by grabbing a dedicated add-in. Forget trying to master complex formulas—these tools work more like smart assistants, taking your simple English commands and turning them into polished reports, cleaned-up data, and insightful charts.
3 Reasons Why Your Quick Start to Using AI in Excel is an Add-in
Bringing AI into your everyday Excel routine is a lot simpler than you might think. Instead of getting tangled up in built-in features that have a steep learning curve, an AI add-in acts as a capable partner right inside your spreadsheet. This approach immediately starts saving you hours of tedious, manual data work.
For instance, an autonomous agent like ElyxAI can take a straightforward command like, "Clean this sales data, remove duplicates, and create a regional summary report." It then handles the entire process for you, from data cleaning to building pivot tables and charts. This lets you focus on what the data means, not the grunt work of getting it there.
Spending too much time on Excel?
Elyx AI generates your formulas and automates your tasks in seconds.
Sign up →1. The Shift to AI-Powered Productivity
This move toward AI assistance isn't just a passing trend; it represents a fundamental change in how we work. The market for AI productivity tools was valued at USD 11.72 billion in 2025 and is expected to skyrocket to USD 69.22 billion by 2035.
That explosive growth highlights a clear demand for smarter, faster ways to manage information. Instead of needing to be an Excel wizard, you can now simply tell an AI what you need. That’s the real advantage of learning how to use Excel AI tools—it puts expert-level analysis within everyone's reach.
The goal is to work on the data, not just in it. By handing off the mechanical parts of spreadsheet management to an AI, you get back precious time for strategy and decision-making.
2. 3 Common Excel Tasks You Can Automate with AI Today
To give you a clearer picture, here’s a look at some common, time-consuming Excel tasks and how an AI tool like ElyxAI can automate them in just a few seconds.
| Manual Excel Task | Time Spent Manually | AI Automation with ElyxAI |
|---|---|---|
| Data Cleaning: Finding and removing duplicates, correcting typos, and standardizing formats across thousands of rows. | 30-60 minutes | Under 30 seconds with a simple prompt like, "Clean this dataset." |
| Creating a Pivot Table: Manually selecting data ranges, dragging fields, and configuring the layout to summarize sales by region. | 5-10 minutes | Under 15 seconds with a command like, "Create a pivot table showing total sales by region and product." |
| Building a Chart: Generating a bar chart to visualize monthly trends, then formatting labels, titles, and colors. | 5-15 minutes | Under 20 seconds with a prompt like, "Generate a bar chart for monthly sales trends." |
As you can see, the time savings add up quickly, especially when you perform these tasks multiple times a day.
3. What AI Can Actually Do for You in Excel
These tools aren't just for data scientists or analytics gurus. They're built for anyone who relies on Excel, from marketers and project managers to finance professionals.
Here’s what the ElyxAI add-in looks like right inside your workbook:
The interface is intentionally simple. You just type instructions in plain language, and the results appear directly in your worksheet. This conversational style breaks down the technical barriers that often make advanced Excel tasks feel intimidating. To see how different options compare, take a look at our guide to the best Excel AI tools available today.
Installing Your First Excel AI Add-in in 3 Simple Steps
Jumping into the world of AI for Excel is surprisingly easy. You don't need to be a tech wizard; getting your first add-in up and running usually takes just a couple of minutes. The safest and most reliable way to do this is by grabbing a tool directly from the official Microsoft AppSource, which is basically a curated app store for Excel.
Using the AppSource means you're installing a tool that Microsoft has already reviewed, giving you peace of mind.

These tools are built for one-click installation. Once it's installed, the AI tool usually pops up as a new tab on your ribbon or a new panel on the side of your screen. It's right there, ready for you to use without any complicated setup. If you want to know more about picking the right tool, we have some great tips on what to look for in an Excel AI add-in in our detailed guide.
1. Finding and Installing from Microsoft AppSource
Let's walk through how to add a tool like ElyxAI. The best part is you can do it all without ever leaving your spreadsheet.
- First, head to the Insert tab on the Excel ribbon and click Get Add-ins. This opens the official Microsoft AppSource store right inside Excel.
- Next, use the search bar to look for the AI tool you want. For instance, just type in "ElyxAI" and it will appear.
- Finally, click the Add button. You'll be asked to agree to the terms, and then Excel handles the rest.
Once it's done, you'll see the AI assistant ready to go on your Excel ribbon. A new pane will open where you can immediately start typing your commands. This seamless integration is what makes these tools so powerful—they fit right into your existing workflow.
2. Understanding How Your Data Stays Secure
It's completely normal to wonder about data security when using a third-party tool. I get this question all the time. Here’s the good news: reputable add-ins from the AppSource are built with privacy as a top priority. Your actual spreadsheet data never leaves your computer.
So, how does it work? When you use an AI add-in like ElyxAI, only your plain-language instruction—the prompt you type—is sent to the AI model. Your sensitive financial data or customer lists stay put.
The AI processes your command and sends back only the necessary actions or formulas to make it happen. These instructions are then carried out locally on your machine. This clever approach gives you all the benefits of powerful AI automation while ensuring your proprietary information remains confidential. It's the best of both worlds.
Your data's security is non-negotiable. With a properly designed add-in, the AI receives your request (like "summarize column B"), not the data in column B itself. The AI's response tells Excel how to perform the task, and your computer does the work locally. Your data stays private.
3 Keys to Crafting AI Prompts That Get Results in Excel
Talking to an Excel AI is a skill. And like any skill, the better you get at it, the better your results will be. If your requests are vague, you'll get vague—or just plain wrong—answers back. Learning how to write a good prompt is what turns these tools from a neat gimmick into an expert partner you can't live without.
Think about giving instructions to a new assistant. If you just slide a spreadsheet over and say, "handle this," you’re going to get a blank stare. But if you say, "In this Q4 sales report, please remove all the duplicate rows, figure out the total revenue for each region, and put the final numbers in a simple table," you'll get exactly what you asked for. AI works the same way. It needs clear directions.
The growth in this space is just staggering. The global AI platforms market was valued at USD 18.30 billion in 2025 and is on track to hit an unbelievable USD 494.14 billion by 2035. That explosion is all about the need for smarter automation and data analysis—which is precisely what a well-written prompt helps you do. You can read more about the explosive growth of AI platforms to get a sense of just how big this shift is.
1. The 3-Part Anatomy of a Perfect Prompt
A great prompt isn't just a question; it's a clear, detailed instruction manual. The best ones almost always contain three key ingredients: context, action, and format. When you include all three, you close the door on guesswork and get the right result much faster.
- Context: Tell the AI what data to work with. Be specific! Instead of "this data," try "the data in columns A through F" or "the 'Sales2026' worksheet."
- Action: State the main task you want it to do. Are you asking it to "summarize," "clean," "analyze," "create," or "calculate" something?
- Format: Describe how you want the output to look. Should it be a chart? A pivot table? A new column with a formula? Or maybe just some highlighted cells?
Nailing these three elements transforms a weak request into a powerful command.
2. From Vague to Valuable: A Prompt Makeover
Let’s see what this looks like in the real world. We’ll compare a lazy, ineffective prompt with a sharp, effective one that uses our context-action-format model.
Ineffective Prompt:
"Make a chart for me."
This is far too generic. The AI has no clue which data to use, what kind of chart you’re picturing, or what that chart is supposed to show. It’s forced to guess, and it will probably guess wrong.
Effective Prompt:
"Create a stacked column chart using the data in the 'RegionalSales' tab, cells A1:E5. Show the total sales revenue by region for Q4 2026. Use the color #1A2B3C for the 'North' region and #4D5E6F for 'South'."
Now that is a command. It gives the AI everything it needs:
- Context: The 'RegionalSales' tab, specifically cells A1:E5.
- Action: Create a stacked column chart showing sales revenue by region for Q4 2026.
- Format: Specifies the chart type and even the exact brand colors to use.
By being specific, you guide the AI to deliver exactly what you envision on the first try. This is the real secret to making human-AI collaboration in Excel feel effortless, not frustrating.
3. 2 More Real-World Prompt Examples
Here are a few more prompts designed for different roles to get your gears turning.
For a Financial Analyst:
- Weak: "Analyze my P&L."
- Strong: "In the 'P&L_FY26' sheet, calculate the Gross Profit Margin for each month in row 15. Then, add conditional formatting to highlight any month where the margin drops below 40% in red."
For a Marketing Manager:
- Weak: "Where did my leads come from?"
- Strong: "Create a pivot table from the 'LeadSource' data in columns A:G. Set 'Source' as the rows, 'Month' as the columns, and show a count of 'Lead ID' as the values. Also, add a slicer for the 'Campaign' column."
These examples show just how important it is to give clear, structured commands. If you’re looking to build complex formulas, a specialized AI formula generator can provide specialized assistance for those more technical jobs. The rule is simple: the more detail you provide, the better and more accurate your results will be.
5 Powerful AI Workflows to Automate in Your Spreadsheets
Okay, this is where the fun starts. We’ve covered how to get an AI add-in running and craft a decent prompt. Now it’s time to see what these tools can really do in your day-to-day work.
The true magic of learning how to use Excel AI tools isn't just about saving a few clicks—it's about handing off entire workflows that used to eat up your afternoon. An autonomous agent like ElyxAI doesn't just suggest a formula; it can perform the whole task from start to finish, just like a real assistant.
This section breaks down 5 high-impact workflows you can start automating right now. For each one, I'll walk you through a common "before" scenario, give you the exact prompt to use, and show you the "after" result. You'll see just how much manual work you can skip.
The secret is turning your fuzzy goal into a clear, direct instruction. This is the single most important skill for getting accurate results from any AI.
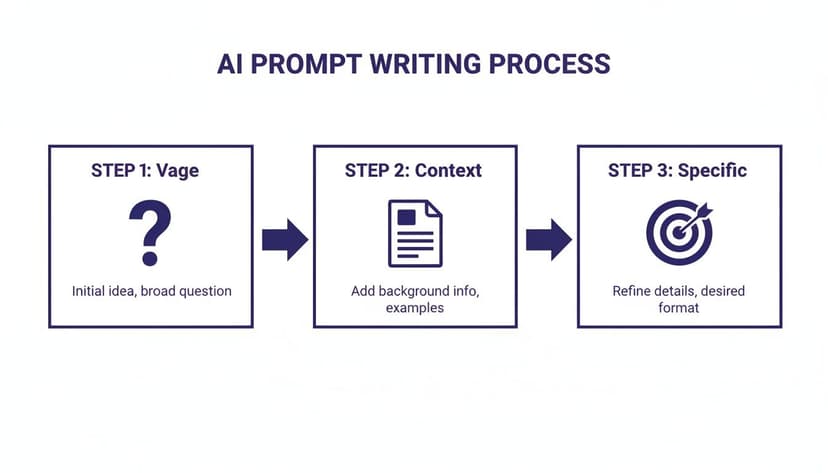
This simple flow—from a vague question to a specific, context-rich command—is the foundation of successful AI collaboration in Excel.
1. Automated Data Cleaning and Standardization
Let's be honest: messy data is the bane of every spreadsheet user's existence. You get a raw data export, and it's a total mess. Inconsistent dates, extra spaces, typos, and blank rows everywhere. Cleaning it up is tedious but absolutely necessary before you can do any real analysis.
The Scenario: You've just received a data dump of customer orders in a worksheet named 'Orders_Q3'. It's a disaster.
- The 'Order Date' column has mixed formats ("10/15/2026", "15-Oct-26", "2026.10.15").
- The 'Customer Name' column is full of annoying leading and trailing spaces.
- Blank rows and duplicate entries are scattered throughout the sheet.
Fixing this manually would mean fiddling with TRIM, TEXT, the "Remove Duplicates" tool, and filters. You can kiss a good part of your morning goodbye.
The AI Prompt:
"In the 'Orders_Q3' sheet, clean the data in columns A through G. Standardize the 'Order Date' column to 'MM/DD/YYYY' format. Remove all leading and trailing spaces from the 'Customer Name' column. Finally, find and delete all duplicate rows based on the 'Order ID' column."
The Result: In less than a minute, the AI executes all these steps. Your data is now perfectly clean, standardized, and ready for analysis. You just got back 30-45 minutes of your life.
2. Autonomous Report and Pivot Table Generation
With clean data in hand, the next logical step is to summarize it. Pivot tables are one of Excel's greatest features, but building them still means manually dragging fields, applying filters, and getting the structure right. An AI agent can build the entire report from a single sentence.
The Scenario: Your manager wants a quick summary of sales performance by region and product category, using your freshly cleaned data.
The AI Prompt:
"Create a new pivot table in a new worksheet from the data in 'Orders_Q3'. Set 'Region' as the rows, 'Product Category' as the columns, and show the sum of 'Sale Amount' as the values. Name the new sheet 'Regional Summary'."
The Result: A perfectly formatted pivot table instantly appears in a new tab, exactly as you asked. Not only is this way faster, but it also prevents common mistakes like selecting the wrong data range or summary function.
3. Instant Chart Creation and Custom Formatting
A good chart turns a wall of numbers into a clear insight. But creating a professional-looking chart is more than just clicking "Insert Chart." You often have to fuss with colors, add data labels, and tweak the axes to make it easy to read and on-brand.
The Scenario: You need to present that regional sales summary in a visually compelling way for the weekly team meeting.
The AI Prompt:
"Create a clustered column chart based on the pivot table in the 'Regional Summary' sheet. Set the chart title to 'Q3 Sales Performance by Region'. Add data labels to all columns. Use our company's brand color #361ba3 for the 'Electronics' series."
The Result: The AI generates a chart that's not just functional but genuinely presentation-ready. It understands context, like applying a specific hex code, which saves you the trouble of hunting through formatting menus.
AI shines at handling the detailed, stylistic work that makes a report look polished. This frees you up to think about the story the data tells, not how to format a chart title.
4. Advanced Trend Analysis and Forecasting
Why stop at summarizing the past? You can use AI to spot trends and even generate simple forecasts. This is a huge step up from just reporting what happened—it’s about providing insight into what might happen next.
The Scenario: You have monthly sales data for the past 3 years. You want to visualize the underlying trend and get a quick forecast for the next 6 months.
The AI Prompt:
"Using the data in the 'MonthlySales' sheet (Column A is 'Month', Column B is 'Total Sales'), add a linear trendline to a line chart of the sales data. Then, in column C, calculate a simple forecast for the next 6 months using the FORECAST.LINEAR function based on the historical data."
The Result: The AI not only creates the visual trendline on the chart but also writes the correct formula and populates the forecast values for you. It performs a statistical task that many Excel users might not know how to tackle on their own. For example, to forecast the next value based on historical known_y's (sales) and known_x's (dates), the formula would look something like this:=FORECAST.LINEAR(A25, B2:B24, A2:A24)
A25: The new x-value (the next month) for which you want to predict a y-value.B2:B24: The range of known dependent y-values (your historical sales).A2:A24: The range of known independent x-values (your historical months).
If you're keen to see how this fits into the bigger picture, you can explore the broader potential of AI automation for business workflows.
5. Complex Formula Generation and Explanation
We’ve all been there—stuck on Google, trying to remember the exact syntax for a tricky VLOOKUP or INDEX(MATCH). An AI agent can not only write the formula for you but also explain how it works, so you learn something in the process.
The Scenario: You have two tables. The 'Orders' table has order details but is missing customer emails. The 'Customers' table has customer IDs and their corresponding emails. You need to pull the right email into the 'Orders' table for each order.
The AI Prompt:
"In the 'Orders' sheet, create a new column named 'Customer Email'. In cell F2, write a VLOOKUP formula to find the customer email from the 'Customers' sheet (range A1:B1000) by matching the 'CustomerID' in cell E2. Explain how the formula works in the chat."
The Result: The AI immediately inserts the correct formula—=VLOOKUP(E2, Customers!A1:B1000, 2, FALSE)—and gives you a simple, step-by-step breakdown:
E2: This is the lookup value, the CustomerID you want to find.Customers!A1:B1000: This is the table array, the range where you're searching.2: This is the column index number, telling Excel to return the value from the 2nd column of the table array (the email).FALSE: This specifies an exact match.
It solves your problem and makes you a smarter Excel user at the same time.
To get you started even faster, here are a few prompts you can copy and paste directly into ElyxAI for some of the most common spreadsheet tasks.
5 Sample ElyxAI Prompts for Instant Results
| Workflow Category | Example Prompt for ElyxAI |
|---|---|
| Data Formatting | "Format the 'Revenue' column as Currency with 2 decimal places. Then, highlight all cells in that column greater than 5000 with a light green fill." |
| Text Manipulation | "In column C, combine the 'First Name' from column A and 'Last Name' from column B, separated by a space." |
| Data Summarization | "Calculate the average, median, and maximum value for the 'Transaction Amount' column and place the results in cells F1, F2, and F3." |
| Conditional Logic | "In the 'Status' column, write an IF formula. If the 'Due Date' in column D is past today's date, show 'Overdue'. Otherwise, show 'On Track'." |
| Data Extraction | "Extract the 4-digit year from the 'Date' column and put it into a new column called 'Year'." |
These examples are just the beginning. The more you use an AI assistant for these small but time-consuming tasks, the more you'll realize how much of your day you can get back.
3 Steps for How to Review and Refine AI-Generated Results
AI tools are fantastic assistants, but they aren't mind readers. The best way to use an AI in Excel is to treat its output as a strong first draft. It’s a starting point that needs a quick once-over from you, the human expert.
This review doesn't need to be an exhaustive audit. Often, a quick spot-check is all it takes. For instance, if you ask the AI to create a pivot table summarizing sales, glance at the grand total. Does it match the source data? Pick a specific region or product and see if its subtotal makes sense. This simple check can catch any misunderstanding the AI might have had.
Applying established strategies for software quality assurance can be a great mental model here. You’re essentially doing a quick QA pass on the AI's work to make sure it's ready before presenting it.
1. It's a Conversation, Not a Command
The real magic of these new AI tools isn't just their ability to follow a single order. It's their power to refine and adjust based on your feedback. You don't need the perfect prompt right out of the gate. Think of it as a conversation.
This back-and-forth is what makes the AI feel less like a calculator and more like a capable assistant sitting next to you. After it completes your first request, you can simply tell it what to change.
Here’s a real-world example of how that conversation might play out:
- You: "Create a pivot table showing sales by region and make a bar chart of the results."
- AI: Generates the table and chart.
- You: "This is good, but change the chart to a line graph to show the trend."
- AI: Instantly replaces the bar chart with a line graph.
- You: "Perfect. Now add a slicer for 'Year' so I can filter the view."
This dialogue is incredibly fast and intuitive. It beats digging through menus and sub-menus to make these changes manually every single time.
Think of the AI as an expert Excel colleague. You provide the high-level direction, and it handles the tedious clicks. You then review its work and ask for tweaks until it’s exactly what you need.
2. 3 Quick Checks for Any AI Output
To build confidence in what the AI produces, get into the habit of running these 3 quick checks.
- Spot-Check the Numbers. For any summary or calculation, pick one or two key figures to verify by hand. In a sales report, check the total revenue. For a budget, double-check the sum of a major expense category.
- Verify Chart Labels. Make sure the chart is actually showing what you think it's showing. Do the axis titles, data labels, and chart title match the story in the data? A common slip-up is a chart that accidentally pulls from the wrong column.
- Test the Filters. If the AI created slicers, filters, or other interactive elements, give them a click. Make sure they work as expected and that your charts and tables update correctly.
This workflow—giving a command, reviewing the output, and making refinements—is the most effective way to work with AI in Excel. It combines the raw speed of the machine with your critical expertise.
ElyxAI vs. Microsoft Copilot: What's the Real Difference?
With so many new AI tools popping up for Excel, it's easy to get confused. You've got built-in assistants like Microsoft Copilot and specialized add-ins like ElyxAI, but what's the actual difference? Knowing this is crucial for picking the right tool for the job and really learning how to use Excel AI tools effectively.
I like to think of it as the difference between a guide and a builder. Copilot is a fantastic guide. You can ask it to explain a tricky formula or walk you through the steps to create a pivot table. It gives you the "how-to," acting as a smart partner that offers suggestions and explains things.
ElyxAI, on the other hand, is the builder. It’s an agent designed to just do the entire task for you from a single, simple command. Instead of telling you how to build the pivot table, it just builds it.
Task Execution vs. Task Suggestion
The core difference really comes down to how they operate.
- Microsoft Copilot is mainly a generative assistant. It’s great for drafting content, suggesting formulas, and breaking down concepts. It’s a powerful partner when you're brainstorming or trying to learn something new.
- ElyxAI is an autonomous agent. You give it a high-level goal, and it handles the entire multi-step process on its own—cleaning data, creating tables, generating charts, and applying formatting, all in one go.
This distinction becomes crystal clear in business situations where speed is everything.
While an assistant helps you perform a task better, an agent performs the task for you. It's a shift from AI-assisted work to AI-automated work.
A Look at the Bigger Picture
Both of these tools operate on the same powerhouse platform: Microsoft Excel, the undisputed king of spreadsheets. In fact, recent data shows that 203,913 verified companies were using Excel as of 2026, including giants like Walmart and Apple. With such a massive user base, there's a huge opportunity for AI tools that can solve real-world efficiency problems. If you're interested in the numbers, you can discover more insights about Excel's market dominance.
For most of us, the goal isn't just to learn a new formula; it's to get the report finished and out the door. This is where an autonomous agent like ElyxAI really shines. If you want a more detailed breakdown, you can check out our detailed analysis of ElyxAI versus Copilot.
Ultimately, the choice is yours. Do you need a teacher to guide you, or a skilled worker to just get the job done for you?
Answering Your Top 3 Questions About AI in Excel
Thinking about bringing AI into your Excel workflow? It's a smart move, but it's also normal to have questions before you jump in. We hear a few of the same ones all the time, so let's tackle them head-on and get you started on the right foot.
1. Will My Data Be Secure If I Use an AI Add-in?
This is usually the first question people ask, and it's the most important one. The short answer is yes, your data is safe with a properly built and Microsoft-vetted add-in like ElyxAI.
These tools are specifically designed with a privacy-first architecture. Here’s how it works: your actual spreadsheet data—the numbers, customer names, and financial details—never actually leaves your computer. When you give the AI a command, like "create a pivot table," only that instruction is sent out. The AI model figures out the necessary steps and sends those instructions back to Excel to run locally on your machine. Your proprietary information is never stored or used to train any models.
2. How Is This Better Than Just Using Formulas?
Formulas are fantastic, but they're just one tool in the toolbox. Think of it this way: a formula is a very specific instruction you have to know how to write. An AI tool, on the other hand, is a partner you can give high-level goals to.
For example, imagine you need to clean up a messy dataset. Manually, you'd be stringing together TRIM, PROPER, maybe a VLOOKUP, and then finding the "Remove Duplicates" button. With an AI tool, you can simply say, "Clean this data." It’s the difference between building an engine piece by piece and just telling a driver where you want to go.
The real power of AI is that it lets you shift from being an Excel operator to an Excel director. You get to focus on the 'what' and 'why' while the AI handles the 'how.'
3. What’s the Learning Curve Really Like?
Honestly, it’s surprisingly gentle. If you can write a clear email, you already have the core skill needed to use an AI add-in. The main adjustment is learning to give clear, specific instructions, which is often called "prompt crafting."
Instead of memorizing complex function syntax, you just need to describe the outcome you want. A simple prompt like, "Summarize total sales by region and show it in a bar chart," is often all it takes. Most people we see get comfortable with it and start noticing a real boost in their productivity within the first day.
Ready to stop wrestling with spreadsheets and start getting answers? ElyxAI acts as your personal data analyst, automating entire workflows from a single command. Get your free 7-day trial and see how much time you can save. Start your free trial of ElyxAI today.
Reading Excel tutorials to save time?
What if an AI did the work for you?
Describe what you need, Elyx executes it in Excel.
Sign up