How to Handle Missing Data for Accurate Analysis

When you're staring at a spreadsheet, dealing with those empty cells is a critical step. It's a three-part process: first, you have to find the gaps, then figure out why they're empty, and finally, decide whether to remove them or fill them in.
The two most common routes are either deleting the entire row that has a missing value or imputing a value. Imputing just means replacing the blank with a smart guess, usually a statistical measure like the mean, median, or mode. Making the right call here is what keeps your analysis honest and your results trustworthy.
The Hidden Costs of Ignoring Missing Data

Spending too much time on Excel?
Elyx AI generates your formulas and automates your tasks in seconds.
Sign up →It’s easy to glance over a few blank cells and keep moving, but those little gaps can quietly wreck your entire analysis. Ignoring missing data isn't just a small oversight; it's a real business risk that can lead to skewed conclusions and bad decisions. The fallout can be serious, from wildly inaccurate sales forecasts to completely unreliable machine learning models.
Think about it this way: you're analyzing customer feedback on a new product feature. If you only look at the fully completed surveys, you might think everyone loves it. But what if the missing responses were from users who got so frustrated they just gave up? You'd be painting a biased picture that could trick you into pouring resources into a feature that's actually a dud.
Why Is Data Missing in the First Place?
Before you can fix the problem, you need to understand where it came from. The reasons for missing data usually boil down to a few common culprits:
- Human Error: Simple typos or someone forgetting to fill in a field during manual data entry. It happens more than you'd think.
- System Glitches: A technical hiccup during data collection or a file transfer can easily leave you with incomplete records.
- Intentional Skips: Sometimes people deliberately leave fields blank, especially when asked for sensitive information like their income or age.
- Not Applicable: The field might be empty because it simply doesn't apply. For instance, the "Previous Company" field for someone entering their very first job.
The Trouble with Quick Fixes
When faced with blanks, many people take the quickest way out: they just delete any row with a missing value. This approach, called listwise deletion, is shockingly common. In fact, a 2022 review of research papers found that a staggering 72.6% of studies defaulted to this method, even though it can introduce serious bias. A far better strategy, multiple imputation, was only used in 4.8% of those cases.
The big problem with just deleting data is that it shrinks your sample size and can warp the reality your dataset is supposed to reflect. If the data isn't missing completely at random, you're not just losing information—you're losing a specific, non-random piece of the puzzle.
Ultimately, knowing how to handle these gaps is a non-negotiable part of any solid data cleaning workflow. Our guide on how to clean data in Excel is a great place to start building these skills. A good strategy ensures your insights are built on a complete and accurate foundation.
Finding and Diagnosing the Gaps in Your Data
Before you can fix missing data, you have to play detective. The first job is to hunt down every blank cell and figure out the story behind it. Just finding the gaps is one thing, but understanding why they’re empty is what will shape your entire approach. Skip this step, and you risk applying a one-size-fits-all fix that could skew your results.
You don't need any fancy software for this initial investigation. Your everyday spreadsheet tool, Excel, has some surprisingly powerful features that can help you spot missing values in a flash. With a few simple tricks, you can instantly see where the problem areas are and get a clear map of the gaps in your dataset.
Quick Ways to Spot Missing Values in Excel
Let's start with Excel’s built-in tools to highlight or count empty cells. These methods are fast, simple, and give you an immediate sense of how big your missing data problem really is.
- Conditional Formatting: This is my go-to for a quick visual check. Select your data range, head to the Home tab, and click on Conditional Formatting > New Rule. From there, choose "Format only cells that contain," and in the dropdown menu, pick "Blanks." I usually set the format to a bright yellow or red fill—it makes every empty cell jump off the screen.
- The Go To Special Feature: This is another great shortcut. Just press
Ctrl+G(orF5on some machines) to open the "Go To" dialog box. Click the "Special" button, then select "Blanks" and hit OK. Bam. Excel instantly selects every single empty cell in your dataset. - The COUNTBLANK Function: When you need a hard number, this function is your friend. Use the formula
=COUNTBLANK(range)to count the number of empty cells in a column or even across your entire table. This is incredibly useful for creating data quality dashboards or just getting a quick metric.
Here’s a look at the "Go To Special" dialog box, a simple but powerful tool for grabbing all your blank cells at once.

Using this feature lets you quickly size up the extent of the missing information without having to write a single formula.
Understanding the Three Types of Missing Data
Once you’ve found the gaps, the real work begins: diagnosing their nature. The reason data is missing is what dictates the best way to handle it. Statisticians generally bucket missing data into three main categories, and knowing which one you're dealing with is key.
Missing Completely at Random (MCAR): This is the holy grail of missing data. It means the absence of a value is totally random and has no relationship with any other data, observed or missing. Think of a survey respondent accidentally skipping a question. It's the ideal scenario because it doesn't introduce bias, but honestly, it's pretty rare in the real world.
Missing at Random (MAR): This one is a bit more common. Here, the probability of a value being missing is related to another observed variable in your dataset, but not the missing value itself. For example, men might be less likely to fill out a section on dietary habits than women. The missingness depends on gender (which you have recorded), not on their actual diet.
Missing Not at Random (MNAR): This is the one that keeps analysts up at night. The missingness is directly related to the value that is missing. The classic example is high-income individuals being less likely to disclose their income on a survey. The reason the data is gone is tied directly to the value you're trying to find. This type is the most challenging because it can introduce significant bias into your analysis.
Figuring out which type of missingness you have is more of an art than a science; it often comes down to your domain knowledge. Is there a logical reason why certain entries are blank? Could it be tied to another column? Answering these questions is the most critical step before you even think about choosing a solution.
If you want to dive deeper into maintaining data quality from the start, you might find a practical guide to research data management helpful. Correctly identifying the pattern of missingness in your data will set you up for success.
Choosing Your Strategy: Deletion vs. Imputation
Once you've figured out why your data is missing, you're at a crossroads. Do you just get rid of the incomplete records, or do you try to fill in the blanks? This choice between deletion and imputation is a big one, and it will directly shape how trustworthy your final analysis is.
This isn't just a technical step; it's a strategic move. The right call depends on how big your dataset is, what percentage of values are missing, and the patterns you've already found. Get it wrong, and you could introduce serious bias, making your conclusions shaky at best.
When Is It Safe to Just Delete Data?
The most straightforward fix is to simply remove any rows with missing values. This is called listwise deletion, and it's tempting because it’s quick and leaves you with a "clean" dataset. But fast doesn't always mean good, and this is rarely the best path forward.
Deleting rows is generally only safe when the amount of missing data is tiny—think less than 5%—and you're confident the data is Missing Completely at Random (MCAR). In this best-case scenario, dropping a few records probably won't throw off your results.
Expert Tip: Before you delete a single row, calculate what percentage of your data you're about to lose. If getting rid of all incomplete rows means ditching 20% of your dataset, stop. You're tossing out way too much information and almost guaranteeing you'll skew the results.
Modern statistical methods have come a long way from simple deletion. Yet, a 2019 review pointed out that many researchers still rely on analyzing only complete cases, despite the well-documented risks of bias and lost statistical power. You can dive deeper into these statistical findings on data handling.
The Smarter Approach: Imputation
Instead of just deleting data, imputation is the process of filling in the blanks with estimated values. This approach keeps your sample size intact and is almost always the better choice when you're dealing with anything more than a trivial amount of missing information.
The point of imputation isn't to perfectly guess the original value—that's impossible. The real goal is to plug in a plausible substitute that maintains the overall statistical integrity of your dataset. This helps you avoid the kind of distortion that deletion can cause.
To help you decide, here’s a quick breakdown of the common methods.
Quick Guide to Handling Missing Data
| Method | Best For | Primary Risk |
|---|---|---|
| Listwise Deletion | Datasets where less than 5% of data is MCAR. | Reduces statistical power and can introduce significant bias if data isn't truly MCAR. |
| Mean/Median/Mode Imputation | Quick fixes for small amounts of missing data in normally distributed variables. | Distorts variance and correlations between variables, weakening relationships. |
| Regression Imputation | When a strong linear relationship exists between the missing variable and other variables. | Overestimates correlations and can produce poor estimates if relationships are weak or non-linear. |
| Multiple Imputation | Complex situations with moderate to high levels of missing data (MNAR or MAR). | Computationally intensive and requires careful selection of the imputation model. |
Ultimately, the more data you're missing, the more sophisticated your solution needs to be.
This decision tree gives a great visual for picking the right method based on how much data you're missing.
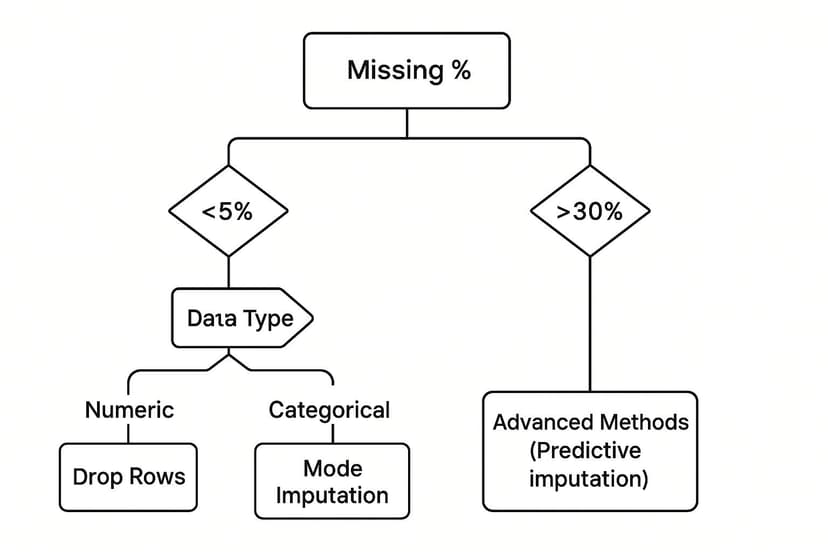
As you can see, the higher the percentage of missing data, the more careful you need to be. Simple deletion works for tiny gaps, but larger holes demand a much more thoughtful imputation strategy to keep your analysis on solid ground.
Practical Imputation Techniques You Can Use Today

Alright, you've got a strategy. Now it's time to roll up your sleeves and actually fix those empty cells. Imputation might sound like a data scientist's buzzword, but many of the most effective methods are surprisingly straightforward, especially if you know your way around Excel.
The real goal here isn't just to plug a hole. It's to fill that blank with a logical, defensible value that keeps your dataset's integrity intact. Let's walk through a couple of go-to methods, starting with a lightning-fast Excel trick before moving on to a more sophisticated approach.
Fast Fills with Excel's Go To Special
One of the quickest ways to deal with missing numbers is to use the mean or median of the entire column. There’s a brilliant Excel shortcut for this that can fill hundreds of blank cells in seconds, saving you from an endless, mind-numbing copy-and-paste session.
Imagine you're staring at a "Sales Volume" column with gaps scattered all over the place. Here's how you can fill them all in one go:
- First, select the entire column where the data is missing.
- Press
Ctrl+G(orF5on a Mac) to bring up the "Go To" box. - Click the "Special…" button. In the window that pops up, choose "Blanks" and hit "OK". Instantly, Excel highlights every empty cell in your selection.
- Here's the key: don't click anything else. With the blank cells still selected, just start typing your formula. For example, you might type
=AVERAGE(F2:F100), making sure to use the actual range of your data. - Now for the magic. Instead of just pressing Enter, press
Ctrl+Enter.
That simple key combination applies your formula to every single selected blank cell. What would have taken ages to do manually is done in a flash.
Key Takeaway: The
Ctrl+Entershortcut is a true game-changer for any bulk task in Excel. It populates all selected cells with the same value or formula at once, turning a tedious job into a five-second fix.
This method is fantastic for a quick, first-pass clean-up. The only downside is that it treats every missing value the same, which isn't always the most accurate path. For that, we need a smarter technique.
Smarter Guesses with Regression Imputation
When you have variables in your dataset that are related, you can lean on that relationship to make a much more educated guess. This is the whole idea behind regression imputation. Instead of just plugging in a simple average, you build a small model to predict the missing value based on other columns you do have complete data for.
Let's say you have missing values in a "Monthly Income" column but complete data for "Years of Experience." It's a safe bet these two are connected. You can create a simple linear regression model where income depends on experience.
The model provides a formula (something like Income = m * Experience + c), which you can then use to calculate a predicted income for every row with a missing value. Yes, it takes a bit more statistical effort, but the result is often far more realistic than what you'd get from a simple mean.
This kind of careful approach is absolutely essential in fields like finance, where a missing data point can lead to flawed conclusions. In fact, missing data is a constant headache in financial markets, affecting more than 70% of firms. A 2022 study highlighted that the patterns of missing financial data are often complex, not random, making basic imputation methods unreliable. Getting this right is critical for everything from asset pricing to investment strategy. You can dive deeper into how missing data impacts financial analysis on SSRN.
By tailoring your fix to the relationships hidden in your data, you’re no longer just filling gaps—you’re genuinely restoring the dataset’s underlying story.
Automating Data Cleaning with AI Tools
Let's be honest, manual methods for dealing with missing data are a real drag. They work fine for tiny datasets, but the moment you're staring down thousands of rows, it becomes a time-consuming, error-prone nightmare. The risk of making a mistake while filling in gaps—or even just finding all of them—shoots up. This is exactly where modern AI-powered tools come in and change the game.
Tools like Elyx.AI are built to do this heavy lifting for you. They go far beyond just spotting empty cells. They intelligently hunt down all sorts of missing value placeholders that we humans often miss, like 'N/A', 'Not Available', or even those tricky numerical codes like '999'. Right from the start, this detection is leagues ahead of a simple COUNTBLANK function.
Beyond Detection to Intelligent Imputation
Once all the gaps are flagged, the real magic of AI kicks in. Instead of just plugging in a basic mean or median everywhere, these tools actually analyze the patterns and relationships swimming in your data. They look at the data type, its distribution, and how different columns relate to each other to suggest the best, most statistically sound way to fill the blanks in each column.
For instance, an AI tool might see that regression imputation is a perfect fit for one column but suggest filling another with the mode, all in the same dataset. Our guide on automated data cleaning in Excel dives deeper into how this technology saves countless hours and seriously boosts your data's reliability.
Here's a quick look at the Elyx.AI interface. You can see how it plugs right into the spreadsheet environment you already know.
This kind of seamless integration means you can run powerful cleaning operations without having to jump between different apps or disrupt your flow.
The biggest win with automation is consistency. An AI tool applies the rules you set with perfect accuracy across the entire dataset. This gets rid of the little inconsistencies that sneak in during manual cleaning, making sure your data is truly ready for analysis.
In the end, knowing how to handle missing data is less about doing it all by hand and more about picking the right tool for the job. If you want to stop missing data at the source and cut down on cleaning later, think about the benefits of automating data entry processes with AI and RPA tools. By taking an automated approach, you get your time back to focus on what really matters: pulling valuable insights from clean, trustworthy data.
Common Questions About Missing Data
Even with a solid game plan, you're bound to run into some tricky situations when cleaning up a messy dataset. Knowing how to handle missing data means navigating the gray areas. Let's tackle some of the questions I hear most often.
What Percentage of Missing Data Is Too Much?
Everyone wants a magic number, but the truth is, there isn't one. Still, there are some good rules of thumb that have served me well over the years.
If you have less than 5% of your data missing in a particular column, you can usually get away with simpler methods like deletion or mean imputation without losing too much sleep.
Once you start creeping into the 10-20% range, however, the risk of skewing your results shoots way up. At this stage, just deleting rows is a recipe for disaster. You'll need to look at more sophisticated imputation techniques to keep your dataset from becoming unreliable. The context is everything—a small amount of non-random missing data can do more damage than a larger, completely random scattering of gaps.
The real question isn’t just how much data is missing, but why it's missing. Understanding the pattern (MCAR, MAR, or MNAR) is far more important than clinging to a strict percentage.
Can I Just Use Zero to Fill Missing Numbers?
This is a tempting shortcut, but it's a dangerous one. Unless a zero is a legitimate, meaningful value for that specific variable (like ‘number of customer complaints’), replacing empty cells with zeros will seriously warp your data.
Think about it this way: plugging in zeros artificially drags down the average and tightens the standard deviation. Your models will then treat that zero as a real piece of information, not the placeholder it truly is. This can lead straight to faulty conclusions and bad predictions. You're almost always better off using a statistical measure like the mean or median.
How Should I Handle Missing Categorical Data?
You can't calculate the mean of non-numeric data like 'product type' or 'customer feedback,' so what's the solution? The most common fix is mode imputation, which just means you fill in the blanks with the most frequent value. It's simple and often effective.
Another smart tactic is to create an entirely new category, like 'Unknown' or 'Missing'. This can be surprisingly insightful because it allows your analysis to reveal whether the absence of data is, in itself, a meaningful pattern.
To make sure your approach is sound, it helps to cross-reference your methods with established data quality best practices. This ensures every fix you make contributes to a more robust and trustworthy dataset.
Stop wrestling with messy data and let AI handle the heavy lifting. Elyx.AI integrates directly into your Excel workflow to automatically detect, analyze, and clean your data in seconds. Transform your spreadsheets and get back to what matters—finding insights. Learn how Elyx.AI can help you today!
Reading Excel tutorials to save time?
What if an AI did the work for you?
Describe what you need, Elyx executes it in Excel.
Sign up