How to Calculate Standard Deviation in Excel: A Guide to STDEV.S & STDEV.P

Calculating standard deviation in Excel is a straightforward process once you know which formula to use. It comes down to two main functions: =STDEV.S() for a sample of data, and =STDEV.P() for an entire population. The task is as simple as typing the correct formula and selecting your data range to instantly measure the dispersion of your numbers.
This guide will provide a practical, step-by-step explanation to help you master this essential statistical tool in Excel, ensuring you can apply it to real-world problems.
Why Bother with Standard Deviation in Excel?
Before diving into Excel formulas, it’s useful to understand what standard deviation actually tells you. In short, it’s a single number that reveals how consistent or spread out your data is.
Spending too much time on Excel?
Elyx AI generates your formulas and automates your tasks in seconds.
Sign up →For example, are your monthly sales figures clustered around the average, or do they fluctuate wildly? Standard deviation provides a concrete answer by quantifying the variability in your dataset.
A low standard deviation indicates that your data points are close to the average, signaling consistency and predictability. Conversely, a high standard deviation means the numbers are scattered, which could point to volatility or a lack of process control. Understanding this metric allows you to move beyond simple averages and make more informed, data-driven decisions.
The Critical Choice: Population vs. Sample
This is the most important decision you'll make, as it determines which Excel function is appropriate for your analysis. Using the wrong one can lead to inaccurate conclusions.
So, what's the difference?
-
Population: This refers to the entire group you are interested in. If you are analyzing the test scores for every student in a specific school, that complete list of scores is your population.
-
Sample: This is a subset of the population. It’s a smaller, manageable selection used to make inferences about the larger group. For example, analyzing every customer transaction from the last ten years is a massive undertaking. Instead, you might analyze a sample—such as all transactions from last month—to understand broader trends.
In most business scenarios, you will be working with a sample because collecting data for an entire population is often impractical. This distinction is key to selecting the right Excel formula.
For a deeper dive, our guide on a variety of descriptive statistics examples can provide more context.
Key Takeaway: A low standard deviation suggests your process is stable and outcomes are predictable. A high standard deviation is not necessarily negative, but it highlights significant variation that may require further investigation.
For instance, if you are tracking the duration of customer support calls, a low standard deviation indicates that most calls are of similar length, which simplifies team staffing. A high standard deviation, however, means call times are inconsistent, possibly signaling a need for better training or a deeper look into complex customer issues.
Choosing the Right Formula: STDEV.S vs. STDEV.P
When you open Excel to calculate standard deviation, you must choose between two primary functions. This choice hinges on a single question: is your data the whole story (a population) or just a piece of it (a sample)?
Making the wrong choice can lead to flawed conclusions, so let's break down the functions.
Population vs. Sample: What's the Difference?
Excel provides two main tools for this calculation: STDEV.P for a population and STDEV.S for a sample.
Imagine you are a teacher calculating the standard deviation of test scores for your entire classroom. Since you have the complete dataset, you are working with a population and would use STDEV.P.
Now, what if you wanted to estimate the standard deviation of test scores for the entire school district using only your classroom's scores? In this case, your class is a sample of a much larger group. Here, STDEV.S is the correct function to use.
In business contexts, you are almost always working with a sample. You might analyze one month's sales to estimate annual performance or survey 1,000 customers to understand your entire customer base.
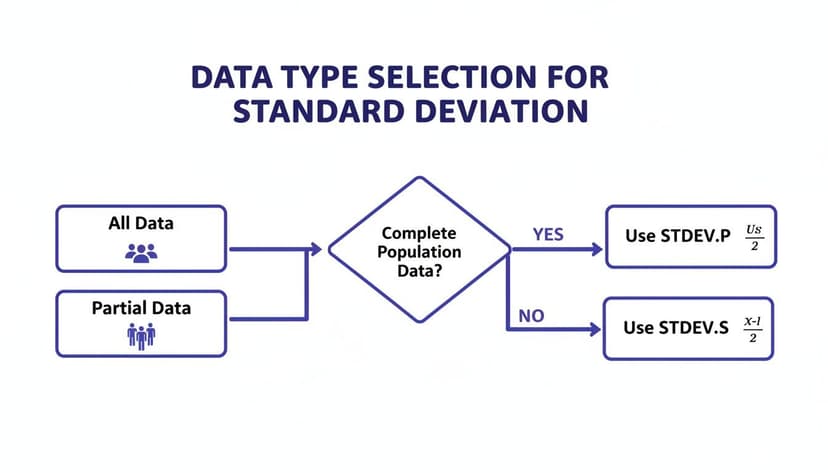
This flowchart illustrates the core decision: if your dataset is complete, use STDEV.P. If it is a subset, use STDEV.S.
A Quick Peek at the Math Behind the Scenes
The difference between the two functions lies in a subtle but significant adjustment in their underlying formulas.
STDEV.Pdivides by the total number of data points, n.STDEV.Sdivides by n-1.
This n-1 adjustment is known as Bessel's correction. It is used because a sample is less likely to capture the extreme values present in the full population. By dividing by a slightly smaller number (n-1), STDEV.S produces a slightly larger standard deviation. This compensates for the potential underrepresentation of variability and provides a more accurate, unbiased estimate of the true population standard deviation.
If you're curious about how samples are chosen, you can explore various data sampling methods to learn how statisticians ensure a sample is representative of the whole.
To make the choice even clearer, here is a quick reference table.
STDEV.S vs STDEV.P Function Comparison
| Feature | STDEV.S | STDEV.P |
|---|---|---|
| Data Type | Use for a sample or subset of data. | Use for the entire population. |
| Denominator | Divides by n-1 (Bessel's correction). | Divides by the total count, n. |
| Common Use | Most common for business and research analysis. | Used when you have every single data point. |
| Result | Gives a slightly larger, more conservative estimate. | Gives the exact standard deviation for the given data. |
Ultimately, this table reinforces that your choice depends entirely on the nature of your dataset.
Why This Matters: A Real-World Retail Example
This distinction has practical consequences. Imagine you manage inventory for an e-commerce store and pull sales data for the last 30 days, finding the average daily sales to be $975.
If you treat those 30 days as a complete population (e.g., a special one-month promotion), you would use =STDEV.P(B2:B31) and might get a standard deviation of 432.77. This suggests your sales typically vary by about $433 from the average.
However, it's more likely these 30 days are a sample of your annual performance. Using =STDEV.S(B2:B31) would return a slightly higher figure, 440.17. This small increase acknowledges that other months might have even more volatility. For inventory planning, that difference could be the buffer that prevents a stockout during an unexpectedly busy week.
My Personal Rule of Thumb: When in doubt, always use
STDEV.S.
Most of the time in business, you’re looking at a slice of the pie, not the whole thing.STDEV.Sis the safer, more statistically robust choice because it guards against underestimating the true variability in your data.
Getting Hands-On with Standard Deviation Formulas
Now that the theory is covered, let's apply these calculations in Excel. Walking through a real-world scenario is the best way to solidify your understanding.
Imagine you are a team lead reviewing the annual performance scores (on a scale of 1 to 100) for your 10 direct reports. The scores are listed in cells B2 through B11. Your goal is to determine the consistency of your team's performance.
How to Calculate the Sample Standard Deviation
Since your 10 employees represent a sample of the entire company, the appropriate function is =STDEV.S().
The process is simple. Click on an empty cell, such as D2, and enter the formula. The syntax is STDEV.S(number1, [number2], ...), where number1 is the range containing your data.
For our example, the formula is:=STDEV.S(B2:B11)
When you press Enter, Excel performs the calculation. Let's say the result is 12.5. This figure tells you that, on average, an individual employee's score deviates from the team's average score by about 12.5 points.
What If It Was the Entire Population?
To illustrate the difference, let's pretend your 10-person team is the entire company. In this less common scenario, you have data for the whole population.
In this specific case, you would use the =STDEV.P() function.
The steps are nearly identical. In another empty cell, say D3, you would type:=STDEV.P(B2:B11)
You will notice that the result from =STDEV.P() is slightly lower than the result from =STDEV.S(). This is because the formula divides by the total number of employees (10) instead of n-1 (9), as it is working with a complete dataset.
Pro Tip for Dynamic Data: Manually updating your formula's range each time you add a new employee is inefficient and prone to error. A more robust approach is to convert your data into an Excel Table. Select your data and press Ctrl+T. Now, your formulas will automatically include new rows as they are added, ensuring your analysis remains accurate without manual adjustments.
A Peek Under the Hood
Excel's STDEV.P and STDEV.S functions (introduced in Excel 2010) provide a modern and precise way to calculate standard deviation. Behind the scenes, the function performs the same steps you would by hand.
For a small dataset like 2, 3, 5, 6, and 8, Excel first calculates the mean (4.8). Next, it calculates the squared difference of each number from that mean and sums them up (the result is 52). STDEV.S(A1:A5) calculates the square root of 52/4, which is 2.94. STDEV.P would calculate the square root of 52/5 to get 2.73.
This is not just an academic exercise. Companies like Toyota have famously applied this statistical logic in their lean manufacturing processes, reportedly reducing production defects by 25% by using standard deviation to identify and address inconsistencies.
To accelerate this process, AI tools are becoming invaluable. An AI formula builder for Excel can generate the correct standard deviation formula based on a simple natural language prompt, removing any guesswork from the process.
Tackling Common Problems and Advanced Scenarios
Real-world data is rarely as clean as textbook examples. It often contains empty cells, text entries, or requires analysis of specific subsets. Knowing how to handle these situations is key to accurate calculations in Excel.
Fortunately, Excel's standard deviation functions (STDEV.S and STDEV.P) are designed to automatically ignore blank cells and cells containing text within your selected range. This feature saves you from having to manually clean your data before analysis. While this is helpful, adhering to data cleaning best practices is always recommended for reliable results.
This built-in functionality is great, but what about when you need to be more selective?
Analyzing Filtered Data
A common mistake is to filter a large dataset and then use a standard STDEV.S formula on a column. The problem is that Excel calculates the standard deviation for the entire original dataset, including the hidden rows. This can completely invalidate your analysis.
To calculate the standard deviation for only the visible, filtered cells, you must use the SUBTOTAL function.
The syntax is: =SUBTOTAL(function_num, ref1)
- function_num: This code tells
SUBTOTALwhich calculation to perform. For standard deviation, use 107 for the sample (STDEV.S) or 108 for the population (STDEV.P). - ref1: This is your data range, such as
C2:C100.
So, to find the sample standard deviation for visible data in cells C2 through C100, your formula would be:=SUBTOTAL(107, C2:C100)
This formula is dynamic and will automatically recalculate whenever you change the filters, providing an accurate analysis of the specific data subset you are viewing.
A cautionary tale from the field: I once saw an analyst at a large company make a critical error in a dynamic sales report. They forgot to use a function like
SUBTOTALor lock their cell ranges. The result? Their forecasts were off by 15%, a mistake that cost the company millions. It's a powerful reminder that small details matter.
Finding Standard Deviation in PivotTables
For heavy PivotTable users, you can calculate standard deviation directly within the PivotTable without writing any formulas. This is an incredibly efficient way to add statistical depth to your reports.
Here's how to do it:
- Drag the numeric field you want to analyze into the Values area of your PivotTable. It will likely default to "Sum of…" or "Count of…".
- Click on the field in the Values area and select Value Field Settings.
- In the dialog box that appears, change the summary type from Sum to StdDev (for a sample) or StdDevp (for a population).
That's it. The calculation is now part of your PivotTable and will update automatically as you slice, dice, and filter your data, allowing for robust and dynamic summaries.
Using AI in Excel to Automate Your Analysis
While mastering functions like SUBTOTAL and STDEV.S is valuable, the way we interact with spreadsheets is evolving. With AI tools integrated into Excel, you can now perform complex statistical analyses simply by asking a question in natural language.
Instead of remembering syntax and double-checking cell ranges, you can instruct an AI assistant. For example, typing, "Calculate the sample standard deviation for the Q1 sales data in column D," prompts the AI to generate the correct formula, =STDEV.S(D2:D101), and place it in the desired cell. This approach significantly reduces the risk of human error, such as selecting the wrong data range or confusing STDEV.P with STDEV.S.
From Calculation to Instant Insight
The true power of AI extends beyond formula generation. After calculating the standard deviation, you can ask a follow-up question, such as, "Explain what this result means for our sales consistency."
The AI can then provide a clear, plain-English summary. For instance: "The standard deviation is $5,420. This suggests a moderate amount of volatility in your Q1 sales. While generally stable, there are significant deviations from the average that may warrant investigation."
This capability makes complex analysis accessible to all team members, regardless of their statistical expertise, and bridges the gap between obtaining a result and making an informed business decision. To learn more about how this technology is transforming workflows, you can read about AI in Excel.
Speed and Efficiency in Data Preparation
AI-driven automation is also valuable in the data preparation phase, which is critical but often tedious.
By automating repetitive tasks, AI gives you back the one resource you can't make more of: time. This allows you to shift your focus from the 'how' of the calculation to the 'why' behind the data.
In addition to automating calculations, sophisticated AI-powered data extraction engines can help gather and prepare data much faster. By handling data entry and cleanup automatically, these tools ensure your dataset is accurate and ready for analysis, streamlining your entire workflow.
Common Questions About Standard Deviation in Excel
As you become more proficient with calculating standard deviation in Excel, certain questions tend to arise. Here are answers to some of the most common ones.
What's the Difference Between STDEV and STDEV.S?
This is a frequent point of confusion. The STDEV function is a legacy function from older versions of Excel (Excel 2007 and earlier). It remains for backward compatibility with old spreadsheets.
For any analysis you perform today, you should always use STDEV.S. It is the modern, more accurate function for calculating the standard deviation of a sample and is consistent with Excel's updated suite of statistical functions.
How Do I Handle Text or Blank Cells in My Data?
The good news is that Excel handles this automatically.
The STDEV.S and STDEV.P functions are designed to ignore any cells within the specified range that are empty or contain text. They focus only on the numerical values, saving you the time of cleaning your data manually.
Can I Calculate Standard Deviation for a Filtered List?
Yes, but it requires a specific function. Using the standard STDEV.S or STDEV.P functions on a filtered list will produce an incorrect result because they include hidden rows in the calculation.
The correct method is to use the SUBTOTAL function. For example, the formula =SUBTOTAL(107, A2:A100) will calculate the sample standard deviation using only the visible cells in your filtered range.
What Does It Mean If the Standard Deviation Is Zero?
A standard deviation of zero indicates that there is no variation in your data. Every number in your dataset is exactly the same.
Imagine you're looking at the number of coffees sold each day for a week. A standard deviation of zero would mean you sold the exact same number of coffees every single day. It's a sign of perfect consistency.
Ready to stop wrestling with formulas and start getting insights instantly? Elyx.AI is an autonomous AI agent inside Excel that handles everything from data cleaning to complex analysis and report generation from a single command. Save hours and eliminate errors by letting AI do the work. Try Elyx.AI for free and transform your workflow today.
Reading Excel tutorials to save time?
What if an AI did the work for you?
Describe what you need, Elyx executes it in Excel.
Sign up