How to Calculate Break Even Point in Excel A Practical Guide

Calculating your break-even point is a crucial financial exercise. In simple terms, you take your total fixed costs and divide them by your contribution margin per unit (the difference between your price per unit and your variable cost per unit). This calculation reveals the exact number of units you need to sell to cover all your costs. It's the critical threshold where you stop losing money and start turning a profit, and Excel is the perfect tool to model it.
Why Bother With a Break-Even Analysis in Excel?

Before diving into formulas, let's establish why this analysis is more than an accounting chore. Think of break-even analysis as your business's financial GPS. It clearly marks the destination you must reach to survive, providing a data-driven baseline for every decision, from pricing to cost control.
Spending too much time on Excel?
Elyx AI generates your formulas and automates your tasks in seconds.
Sign up →Building your model in Excel transforms this from a static number into a dynamic tool. You can easily adjust variables to see how changes in costs or prices impact your profitability, empowering you to make smarter, more informed decisions. Without knowing this number, you're essentially flying blind.
The Strategic Value of Your Break-Even Point
Knowing your break-even point isn't just about covering costs; it's a strategic advantage. It turns a pile of financial data into actionable insights you can use to run your business better. For example, it gives you a concrete floor for your pricing strategy—you know the absolute minimum you have to charge to avoid losing money on a sale.
It’s also a powerful tool for managing risk. Knowing your "margin of safety"—how far your current sales are from your break-even point—is essential. A company operating just 10% above its break-even point is in a much riskier spot than one operating 40% above it. One unexpected cost increase could wipe out all their profit.
Break-even analysis is the ultimate reality check for any new business idea or investment. It cuts through the noise and asks a simple question: How much do we need to sell just to cover our costs? Answering that makes it so much easier to see if the venture is even viable.
Core Concepts You Need to Master
To run an accurate break-even analysis in Excel, you first have to get a solid handle on the three main ingredients. These are the building blocks for the entire calculation.
- Fixed Costs: These are the consistent expenses you must pay regardless of sales volume. Think rent for your office, employee salaries, insurance, or that monthly software subscription.
- Variable Costs: These costs fluctuate directly with your production or sales volume. The more you sell, the higher they are. This includes things like raw materials, shipping fees, and sales commissions.
- Selling Price Per Unit: This one's straightforward—it's how much you charge a customer for one unit of your product or service.
Getting these three numbers right is the first and most important step toward financial clarity. It’s the kind of fundamental analysis that helps investors Never Buy An Unprofitable Airbnb Again, for example. When you can confidently identify these inputs, you’re ready to build a powerful analysis in Excel that can secure investor confidence and light the way to profitability.
Understanding the Core Break-Even Formulas in Excel
You don't need an advanced degree to calculate your break-even point. The analysis relies on two simple, powerful formulas that tell you exactly how much you need to sell to cover your costs. One formula gives the answer in units sold, while the other frames it in sales revenue. Let's break them down.
Nailing Down Your Break-Even Point in Units
The most common way to calculate the break-even point is by the number of individual products you need to sell. This is the go-to formula for businesses with easily countable items, like a software company selling licenses or a coffee shop selling cups of espresso.
The formula is refreshingly simple:
Break-Even Point (Units) = Fixed Costs / (Sales Price Per Unit – Variable Cost Per Unit)
The part in the parentheses, (Sales Price Per Unit - Variable Cost Per Unit), is called the contribution margin per unit. This crucial number tells you how much cash from each sale is left over to pay down your fixed costs. Once those are covered, it’s pure profit.
A higher contribution margin is always better—it means you reach your break-even point faster. If you want to explore similar profitability metrics, our guide on how to calculate gross margin is a great next step.
Let's put this into practice with a quick example of a SaaS business:
- Fixed Costs: $20,000 per month (salaries, rent, software tools).
- Sales Price Per Unit: $100 for a monthly subscription.
- Variable Cost Per Unit: $20 per subscription (covering payment processing fees and server usage).
In Excel, if you place these values in cells B2, B3, and B4 respectively, the formula would be:=B2/(B3-B4)
This calculation gives us:$20,000 / ($100 - $20) = $20,000 / $80 = 250 units
The magic number is 250. This SaaS company must sell 250 subscriptions every month just to keep the lights on. The moment they sell the 251st subscription, they start making a profit.
Before we move on, let's quickly recap the components that make up these formulas.
Table: Break-Even Formula Components Explained
Here’s a quick reference table breaking down the key terms and their roles in the break-even calculation.
| Component | Description | Example |
|---|---|---|
| Fixed Costs | Expenses that don't change with sales volume. | Rent, salaries, insurance, software subscriptions |
| Variable Cost Per Unit | Costs directly tied to producing one unit. | Raw materials, sales commissions, shipping fees |
| Sales Price Per Unit | The price you charge customers for one unit. | The sticker price of your product or service |
| Contribution Margin | The revenue left over from a sale to cover fixed costs. | (Sales Price) – (Variable Cost Per Unit) |
Understanding these pieces is the key to getting an accurate and useful break-even number.
Calculating Your Break-Even Point in Revenue
What if your business sells hundreds of different products with varying price points? Counting individual "units" becomes impractical. For businesses like retail stores or restaurants, it makes more sense to calculate the break-even point in total sales revenue (dollars).
The formula for this is:
Break-Even Point (Revenue) = Fixed Costs / Contribution Margin Ratio
The Contribution Margin Ratio is simply the contribution margin expressed as a percentage of your sales price. You can calculate it in Excel with this formula: =(Sales Price Per Unit - Variable Cost Per Unit) / Sales Price Per Unit.
Let's stick with our SaaS example to see how it works:
- The Contribution Margin Ratio is
($100 - $20) / $100 = $80 / $100 = 0.80, or 80%.
Now, we can find the break-even revenue:$20,000 / 0.80 = $25,000
The company needs to generate $25,000 in revenue each month to cover its costs. This aligns perfectly with our first calculation—250 units sold at $100 each is exactly $25,000. These are just two different ways of looking at the same goal.
A restaurant chain with $2 million in annual fixed costs (rent, salaries, utilities) and a $20 average meal price illustrates this perfectly. With variable costs of $10 per meal, the contribution margin is $10, or a 50% ratio. This means they need to sell 200,000 meals or generate $4 million in revenue to break even, a model that is consistent with analyses across hundreds of food and beverage firms. Discover more insights about break-even analysis in different industries from businesslike.co.nz.
Building Your Break-Even Model in Excel
Knowing the formulas is one thing, but bringing them to life in an Excel model is where the real magic happens. This transforms a static calculation into a dynamic tool for smarter decision-making. A little setup work upfront will pay huge dividends.
Let's start by laying a solid foundation. I always recommend creating a clean, dedicated section for your inputs. This keeps everything organized and makes it incredibly easy to update or audit your model. You don't want your assumptions mixed in with your calculations—that's a recipe for confusion.
Setting Up Your Spreadsheet
First, label your key inputs in column A. This is a best practice for clear and understandable models.
- A2: Fixed Costs
- A3: Sales Price Per Unit
- A4: Variable Cost Per Unit
Then, enter the corresponding values for your business into column B. This simple layout is the engine of your entire model.
With your inputs neatly arranged, you can build the break-even formula. Find a separate spot on your sheet and label a cell "Break-Even Point (Units)." In the cell next to it, you'll type the formula that references your input section.
Assuming your fixed costs are in B2, your price is in B3, and your variable costs are in B4, the formula is:=B2/(B3-B4)
The key here is using cell references. Never hard-code numbers directly into your formulas! This way, when you change an input—say, you negotiate a better price from a supplier—your break-even point updates instantly. This is the core power of using Excel for financial analysis.
This flowchart gives a great visual of how the pieces fit together.
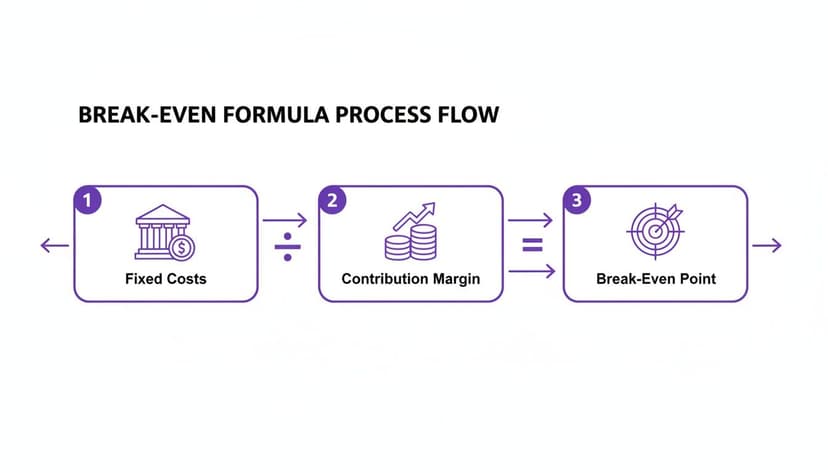
It clarifies the core concept: your total contribution margin from all sales must cover all your fixed costs before you can turn a profit.
From Static Numbers to Dynamic Insights
A single number is useful, but a visual tells the whole story. By creating a simple break-even chart in Excel, you can make your analysis crystal clear to anyone, even those without a finance background. Plotting your Total Revenue, Total Costs, and Fixed Costs against the number of units sold shows the exact point where the lines cross. That intersection is your break-even point.
Let’s put this into a real-world context. Imagine you're launching a SaaS startup. Your fixed costs—server hosting, AI model licensing, and salaries—come to $58,000 a month. Your subscription is priced at €19/month, but after accounting for different tiers, your weighted average price works out to $71 annually per user. Your variable costs, like payment processing fees and cloud usage spikes, average $42 per user.
This leaves you with a weighted average contribution margin of $29 per user. Plugging that into your Excel formula, you’d find you need to sign up 2,000 users just to break even each month. Hitting that first milestone is a huge moment for any new venture.
Using Goal Seek for Automatic Targeting
Here’s a pro tip: Excel has a fantastic built-in tool called Goal Seek that can do the heavy lifting for you. Instead of manually tweaking your inputs to figure out what it takes to break even, Goal Seek finds the answer automatically.
You can find it under the Data tab, then What-If Analysis, and Goal Seek. It's incredibly straightforward. You just tell Excel:
- Set cell: Point it to the cell with your profit calculation (e.g.,
(B3-B4)*B5 - B2, where B5 is the number of units sold). - To value: Enter 0, because breaking even means zero profit.
- By changing cell: Tell it which input to adjust, like the cell for the number of units sold (
B5).
Click "OK," and Excel will instantly run through the possibilities to find the exact number you need. It's a game-changer for more complex scenarios. Once you're comfortable with the basics, you might find that exploring your numbers with a dedicated marketplace calculator can provide even more tailored insights.
Taking Your Analysis to the Next Level: Scenarios and Sensitivity

Finding your break-even point is a great first step. But in the real world, things never stay static. Costs fluctuate, prices change, and your initial calculation quickly becomes a historical artifact. To make your analysis truly useful, you need to go beyond that single number and start thinking dynamically.
This is where sensitivity analysis comes in. It’s a powerful "what-if" exercise in Excel that shows you exactly how your break-even point reacts when key variables change. It helps you prepare for the inevitable questions that keep business owners up at night.
What if a key supplier hikes material costs by 10%? How would a big new marketing push—and the associated fixed costs—affect your timeline to profitability? By modeling these possibilities, you turn a simple spreadsheet into a strategic foresight tool.
Using Data Tables for 'What-If' Scenarios
For this kind of forward-looking analysis, Excel’s Data Table feature is your best friend. Instead of manually plugging in new numbers and recalculating over and over, a Data Table lets you see how changes in one or two variables affect your outcome, all organized in a neat table.
Let’s say you're debating a price change. You can set up a Data Table to show you the new break-even point across a whole range of potential prices. You could test everything from $45 to $55, in one-dollar increments, and instantly see how many units you'd need to sell at each price point to break even.
This gives you a complete picture of your strategic options, making it much easier to find that sweet spot between what the market will bear and what your business needs to be profitable. For a more detailed walkthrough, check out our guide on how to perform a sensitivity analysis in Excel.
A great example from the Yale School of Management shows just how much small changes matter. A retailer with $500,000 in fixed costs selling a $3 product initially breaks even at 250,000 units. But after negotiating a bulk deal that drops their variable cost from $1.00 to just $0.75, their break-even point plummets to 222,222 units. That’s an 11% improvement from one small change. You can read the full primer on Yale's website.
This isn't just an academic exercise; it has very real bottom-line implications. It’s the difference between reacting to the market and being prepared for it.
Using AI to Automate Your Break-Even Analysis
While building break-even models and running "what-if" scenarios manually in Excel is powerful, it can be time-consuming. Repetitive tasks like cleaning data, double-checking formulas, and building charts can eat up hours that are better spent on strategic thinking. This is where AI assistants integrated into Excel become a game-changer.
Bringing AI into your spreadsheet fundamentally changes your workflow. Instead of methodically building your break-even analysis piece by piece, you can simply instruct the AI on what you need, and it will handle the tedious mechanics for you.
From Clicks and Formulas to Simple Instructions
Imagine your raw data for fixed costs, variable costs, and sales prices are in the first three columns of your sheet. The traditional method involves writing formulas, perhaps using Goal Seek, setting up a data table, and then carefully constructing a chart. With an AI assistant like Elyx.AI, you can skip all that.
You can give it a single command in plain English. For instance, you could type:
"Calculate the break-even point in units and dollars using the data in columns A-C. Then, create a line chart showing total revenue and total costs, highlighting the break-even point for sales volumes from 0 to 500 units."
The AI understands your request, applies the correct break-even formulas to your data, and instantly generates the exact chart you wanted. This not only saves a significant amount of time but also reduces the risk of human error from typos in formulas. The focus shifts from knowing how to build the model in Excel to knowing what questions to ask your data.
It's More Than Just a Formula Writer
Modern AI tools can do much more than just write a formula. They can handle the entire workflow, from messy data to a finished report.
- Data Cleaning: Is your cost data inconsistent? An AI can fix it before starting the calculation. A quick prompt like, "Clean the data in column B by removing duplicates and formatting it as USD," prepares your sheet for accurate analysis.
- Complex Scenario Analysis: You can have the AI run a full sensitivity analysis for you. Just ask: "Create a data table showing how the break-even point in units changes if the sales price moves between $50 and $70 and the variable cost goes from $20 to $30."
- Report Polishing: Once the numbers are crunched, the AI can make it all look professional. It can apply clean formatting, add clear labels, and create a layout that’s ready for a presentation.
By delegating these tasks, you can run a more detailed analysis in a fraction of the time. You can explore more possibilities and dig deeper into the numbers. To see more examples, check out how an AI Excel formula generator can handle these kinds of jobs. Ultimately, letting AI handle the heavy lifting for your break-even point means you can move faster, test more ideas, and make better decisions with more confidence.
Common Questions About Break-Even Analysis
Even after you've mastered the formulas in Excel, a few common questions often arise when you're deep in the numbers. Let's clear up some of the most frequent sticking points to ensure your analysis is rock-solid.
A classic one I hear a lot is: can the break-even point be negative? The short answer is no. A negative result in your Excel calculation is a red flag indicating an error in your inputs. It almost always means your variable cost per unit is higher than your selling price. In that scenario, you're losing money on every single sale, making it impossible to ever "break even."
Can a Business Have More Than One Break-Even Point?
Yes, and this is where the simple formula gets more complex in the real world. The basic calculation assumes you're selling just one product. But how many businesses do that?
Most companies sell a whole range of products, each with its own price and profit margin. To get a realistic picture, you'd calculate a weighted-average contribution margin based on your sales mix. This gives you a single break-even point for the entire business.
And remember, your break-even point isn't a static number you calculate once and frame on the wall. It’s a moving target that shifts any time your underlying business dynamics change.
- Cost Changes: Your landlord raises the rent (a fixed cost hike) or a key supplier ups their prices (a variable cost increase). Both of these will push your break-even point higher.
- Pricing Strategy: You decide to raise your prices. This boosts your contribution margin per sale and, as a result, lowers the number of units you need to sell to break even.
This is exactly why you can't just set it and forget it. Your Excel model should be a living document that you revisit regularly.
The biggest mistake I see people make with break-even analysis is ignoring cannibalization. If a new, cheaper product siphons sales away from an older, more profitable one, you absolutely must factor that lost profit into your calculations.
Is Break-Even Analysis the Same as Payback Period?
This is another common mix-up. They both sound similar, but they measure completely different things. Break-even analysis is all about ongoing operations—it tells you the sales volume you need to hit just to cover your costs and arrive at zero profit.
The payback period, on the other hand, is about capital investment. It calculates how long it takes for the cash flow from a project (like buying a new machine) to pay back the initial money you spent on it. It’s focused on recouping a one-time outlay, not day-to-day profitability.
If you want to dive deeper into these kinds of target-based calculations, check out our guide that explains how to use Goal Seek in Excel. It's a fantastic tool for finding the inputs you need to hit a specific financial goal automatically.
Ready to stop wrestling with manual calculations and let AI do the heavy lifting? Elyx.AI is an autonomous agent that executes entire workflows in Excel from a single instruction. Clean data, generate charts, and run complex analyses instantly, freeing you to focus on strategy. Start your free trial at https://getelyxai.com and see how much time you can save.
Reading Excel tutorials to save time?
What if an AI did the work for you?
Describe what you need, Elyx executes it in Excel.
Sign up