Mastering Financial Analysis Techniques in Excel with AI

Think of a company's financial statements—the balance sheet, income statement, and cash flow statement. On their own, they're just a sea of numbers. Financial analysis techniques are the tools we use in Excel to make sense of that sea, to chart a course, and to understand what’s really happening beneath the surface.
These methods, from ratio analysis to trend analysis, are how we turn raw data into something meaningful. They help us gauge a company's health and predict where it might be headed. This guide will show you how to perform these analyses directly in Excel, solving concrete problems and making you a more effective analyst.
Why Financial Analysis Techniques Matter
Imagine trying to navigate a ship using only a list of coordinates without a map. That's what looking at financial data without analysis is like. You have information, but no context, no story. Financial analysis techniques provide the map. They help you connect the dots, understand the journey so far, and anticipate the storms or clear skies ahead.
Spending too much time on Excel?
Elyx AI generates your formulas and automates your tasks in seconds.
Sign up →This isn't just a skill for CFOs or Wall Street analysts anymore. Anyone in business who wants to make smart, informed decisions needs to grasp these concepts. This guide will break down these techniques into practical skills you can start using right in Excel, helping you translate numbers into a clear story about a company's real performance and potential.
Unlocking Deeper Business Insights
The whole point of financial analysis is to dig deeper than the headline numbers. A company's revenue figure for the quarter is interesting, but it becomes truly insightful only when you compare it to the same quarter last year or stack it up against the costs incurred to achieve it. Analysis gives you that crucial context.
It helps answer the big questions that every business leader, investor, or stakeholder has:
- Are we actually profitable? It's not just about bringing in money. Are the profit margins strong enough to sustain the business and compete in the industry?
- Can we cover our short-term debts? This gets at the heart of liquidity—a company's ability to pay its bills and keep the lights on.
- Is our debt working for us or against us? Understanding how a company uses debt is fundamental to knowing if its growth is sustainable or built on a shaky foundation.
- How good are we at turning assets into revenue? This is all about operational efficiency.
Think of financial analysis as a diagnostic health check for a business. It identifies strengths, pinpoints weaknesses, and provides the insights needed to map out a strategy for long-term success.
With this foundation, we can start exploring specific methods. We'll soon get into the nuts and bolts of techniques like ratio and trend analysis, showing how you can use them—especially with the help of Excel and AI—to paint a complete picture of a company's financial reality.
Exploring Core Financial Analysis Methods
To really get under the hood of a company's financial health, you need a solid set of tools. The core financial analysis techniques are your best friends here, turning rows of raw numbers into a clear story about a company's performance and stability. And these methods aren't just for Wall Street pros; they're practical tools anyone can use in Excel to make sense of financial statements.
Let's start with two of the most popular approaches: Horizontal and Vertical analysis. The best way to think of them is as two different camera lenses for looking at the same financial landscape.
Horizontal and Vertical Analysis: The Time-Lapse and The Snapshot
Horizontal analysis is like watching a time-lapse video of a company's performance. It works by comparing financial data from different periods side-by-side to spot trends over time. For example, you might compare this quarter's revenue to the same quarter last year to see if you're growing or shrinking. It's all about answering questions like, "Are we growing consistently?" or "Are our expenses climbing faster than our sales?"
In Excel, this is dead simple. Just lay out your income statements from the last few years in adjacent columns and calculate the percentage change from one year to the next using a formula like =(C2-B2)/B2.
Vertical analysis, on the other hand, is like taking a detailed snapshot. It dives deep into a single financial statement at one specific moment. Each line item is shown as a percentage of a major base figure, like total assets on the balance sheet or total sales on the income statement. This reveals the company's internal financial structure. For instance, it can quickly show you that the cost of goods sold eats up 60% of total revenue—a huge insight for understanding profitability. In Excel, you'd calculate this by dividing each line item by the base figure (e.g., =B3/$B$10, using $ to lock the base cell).
Diving Deeper with Ratio Analysis
While horizontal and vertical analyses give you a great bird's-eye view, ratio analysis is where you pull out the magnifying glass. This powerful technique uses simple formulas to check a company's pulse across several key areas.
Ratio analysis is a cornerstone of fundamental analysis, which is all about figuring out a company's true value by digging into its financials and the broader economic picture. Ratios are critical here because they standardize the numbers, making it easier to compare companies of different sizes or track performance over time.
This image really helps to visualize how different ratios fit into the big picture of a company's financial assessment.
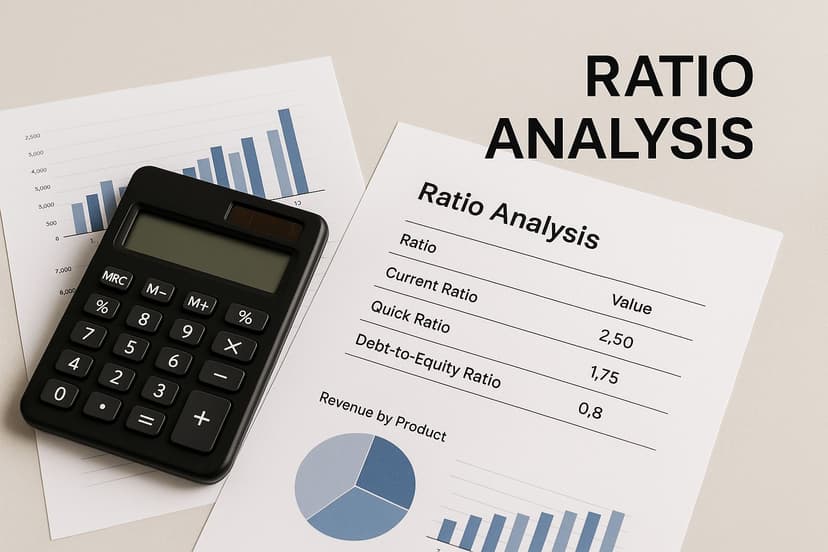
As you can see, each category of ratios gives you a unique window into how the company is operating and managing its money.
To make this more concrete, let's break down the main categories of financial ratios.
Key Financial Ratios at a Glance
Financial ratios help us make sense of the vast amount of data in financial statements. The table below summarizes the four main categories you'll encounter, explaining what they measure and giving a few key examples for each.
| Ratio Category | Purpose | Example Ratios |
|---|---|---|
| Liquidity Ratios | Measure a company's ability to meet its short-term obligations (bills due within a year). | Current Ratio, Quick Ratio (Acid-Test) |
| Solvency Ratios | Assess a company's long-term financial health and ability to meet its long-term debt obligations. | Debt-to-Equity Ratio, Debt-to-Assets Ratio |
| Profitability Ratios | Indicate how effectively a company is generating profits from its sales and operations. | Net Profit Margin, Return on Equity (ROE) |
| Efficiency Ratios | Evaluate how well a company uses its assets and liabilities to generate sales and profits. | Inventory Turnover, Asset Turnover Ratio |
By getting familiar with these categories, you can quickly diagnose specific areas of a business, from its day-to-day cash flow to its long-term viability.
Putting It All Together
Let's look at the four main types of ratios you'll use most often:
- Liquidity Ratios: These tell you if a company can pay its immediate bills. Think of it as checking their wallet. The Current Ratio (Current Assets / Current Liabilities) is the go-to metric here.
- Solvency Ratios: These look at long-term stability and the ability to pay off long-term debt. The Debt-to-Equity Ratio (Total Debt / Shareholder Equity) is a big one, showing how much a company leans on borrowing.
- Profitability Ratios: Just like the name says, these ratios show how good a company is at turning sales into actual profit. The Net Profit Margin (Net Profit / Revenue) and Return on Assets (Net Income / Total Assets) are key indicators.
- Efficiency Ratios: These measure how well a company is using what it has—its assets and liabilities—to make money. The Inventory Turnover Ratio (Cost of Goods Sold / Average Inventory) reveals how fast it's selling its products.
Each ratio provides a piece of the puzzle. A strong profitability ratio might look great, but if it's paired with a dangerously high solvency ratio, it could signal unsustainable, debt-fueled growth.
By combining these different types of ratios, you start to build a multi-dimensional view of the business. You’re no longer just looking at numbers; you’re evaluating its operational heartbeat, its financial resilience, and its ability to create value over time. And a simple table in Excel is all you need to track these key ratios, giving you an at-a-glance dashboard for quick assessment.
Using Historical Data to Predict Future Trends
Think of your company's financial past as a detailed roadmap. A single financial report is like a snapshot of your current location, but looking back at several years of data shows the entire journey—the hills you've climbed, the valleys you've navigated, and the general direction you're headed. This backward-looking view is one of the most powerful financial analysis techniques for anticipating what’s around the corner.
When you line up past reports, you start to see patterns that are invisible in a single snapshot. You might notice that sales always spike in the fourth quarter or that marketing expenses have slowly crept up as a percentage of revenue. These are the kinds of insights that form the bedrock of reliable forecasts, solid budgets, and confident strategic decisions.

Uncovering Hidden Patterns with Trend Analysis
Trend analysis, which you might also hear called horizontal analysis, is simply the method of comparing financial data over several periods to spot consistent patterns. It's not just about seeing if revenue went up or down; it’s about understanding the rate and consistency of that change. Is your growth speeding up, leveling off, or starting to slow down?
By laying out income statements, balance sheets, and cash flow statements side-by-side, analysts can spot everything from seasonal quirks to long-term growth trajectories. In fact, financial teams report that incorporating historical trends can improve forecast accuracy by as much as 15-20%. This data provides the solid foundation needed for more complex financial models.
A Practical Trend Analysis Example in Excel
Let's walk through a quick example of trend analysis in Excel. The goal is to calculate the year-over-year (YoY) growth for a couple of key metrics to see what story the numbers are telling.
Step 1: Organize Your Data
First, pull your company's annual revenue and net profit for the last four years. Arrange them in a simple Excel table.
| Metric | Year 1 | Year 2 | Year 3 | Year 4 |
|---|---|---|---|---|
| Revenue | $500,000 | $550,000 | $620,000 | $650,000 |
| Net Profit | $50,000 | $58,000 | $65,000 | $60,000 |
Step 2: Calculate Year-Over-Year Growth
Now, add new rows to calculate the YoY growth percentage for each metric. The formula is straightforward: (Current Year - Previous Year) / Previous Year.
In your spreadsheet, the formula for Year 2 Revenue Growth would look something like =(C2-B2)/B2. Just drag that formula across the other years.
| Metric | Year 1 | Year 2 | Year 3 | Year 4 |
|---|---|---|---|---|
| Revenue Growth | – | 10.0% | 12.7% | 4.8% |
| Net Profit Growth | – | 16.0% | 12.1% | -7.7% |
Right away, this simple analysis tells a story. While revenue grew each year, the growth rate took a nosedive in Year 4. Even more alarming, net profit actually went backward, which could mean costs are ballooning or margins are getting squeezed.
This basic exercise shows how looking at trends gives you so much more context than just looking at the final year's numbers alone. It's a skill that immediately adds value, and you've just learned how to do it in under five minutes.
From Historical Data to Strategic Action
The insights from trend analysis should directly feed your strategy. The data in our example would spark a few urgent questions:
- Why did our revenue growth slow down so much in Year 4? Did we run into new competition, or did a major marketing campaign fall flat?
- What caused our net profit to drop even though revenue went up? Are our material costs out of control, or is it our operating expenses?
This is where historical analysis really proves its worth. It doesn't just hand you answers; it helps you start asking the right questions. By understanding where you've been, you can make smarter, more proactive decisions about where you're going next. You're turning simple data into a powerful tool for strategic planning.
Building Advanced Forecasts and Models in Excel
Looking at historical data is great for understanding where a company has been. But the real magic happens when you can confidently predict where it's going. This is the leap from just reviewing the past to actively modeling the future, and you can do it all right inside Excel.
These advanced techniques turn your analysis into a strategic compass. Instead of just reporting on last quarter's numbers, you can start answering the tough questions about what might happen next. It's this shift from reactive reporting to proactive planning that truly separates a great financial analyst from a good one.

Demystifying Discounted Cash Flow DCF Analysis
One of the cornerstones of forecasting is the Discounted Cash Flow (DCF) model. It might sound intimidating, but the idea behind it is surprisingly straightforward. It's a method for figuring out what a company or an investment is worth today based on the cash it’s expected to produce down the road.
Think about it this way: getting $100 five years from now isn't as good as having $100 in your hand today. Why? Because you could invest that money right now and watch it grow. That core principle—the "time value of money"—is exactly what a DCF analysis applies to a business's projected cash flows.
Building a DCF model in Excel involves a few core steps:
- Forecast Future Cash Flows: You start by estimating how much free cash flow the business will generate over a set period, usually five to ten years.
- Determine a Discount Rate: This rate, often the Weighted Average Cost of Capital (WACC), accounts for the risk tied to the investment. Higher risk means you need a higher discount rate.
- Calculate Present Value: You then use Excel’s NPV (Net Present Value) function to pull all those future cash flow estimates back to what they're worth in today's dollars.
What you're left with is an estimate of the company's "intrinsic value"—a critical number for making smart investment decisions.
Exploring Futures with Scenario and Sensitivity Analysis
Any financial forecast rests on a pile of assumptions. But what happens if those assumptions are off? What if interest rates shoot up, or a major supplier hikes their prices? That’s where scenario and sensitivity analysis come into play.
These techniques let you stress-test your financial models. Instead of relying on a single, rigid forecast, you build a flexible model that can show you a whole range of possible outcomes. It’s about preparing for uncertainty and making your strategies more robust.
By building models that can answer "what if" questions, you transform your spreadsheet from a simple calculator into a strategic decision-making tool. You're no longer just predicting one future; you're preparing for many.
For a deeper look at building models that can stand up to scrutiny, check out our guide on financial modeling best practices.
How to Build a Scenario Analysis in Excel
Excel has some fantastic built-in tools that make scenario analysis much easier than you'd think. The Data Table feature, in particular, is a game-changer. Let's say you have a profit model that hinges on two key variables: how many units you sell and the price per unit.
You need to know how your net profit will react if those two numbers change.
- Step 1 Set Up Your Model: First, build a simple model with input cells for "Units Sold" and "Price Per Unit," along with a formula that calculates "Net Profit."
- Step 2 Create the Data Table Structure: Next, set up a grid. List different "Units Sold" values down the first column and various "Price Per Unit" values across the top row.
- Step 3 Use the Data Table Tool: Head to
Data > What-If Analysis > Data Table. In the pop-up, link the "Row input cell" to your original "Price Per Unit" cell and the "Column input cell" to your "Units Sold" cell.
Click OK, and Excel instantly fills in the table, calculating the net profit for every possible combination of price and volume. Suddenly, you have a complete map of potential outcomes, making it easy to spot your best-case, worst-case, and most-likely scenarios.
And with an AI assistant like Elyx.AI, you could generate the initial model or the table structure with a simple text command, getting you to the insights even faster.
How AI Changes the Game for Your Financial Analysis
Let's be honest. The core techniques of financial analysis are solid, but the day-to-day process can feel like a grind. We've all been there, lost in a sea of cells, painstakingly calculating ratios and building forecast models from scratch in Excel. It's time-consuming, and frankly, it's often the most repetitive part of the job.
This is where AI comes in, not as a replacement for your financial expertise, but as a seriously smart assistant. Think of AI tools that plug right into Excel, like Elyx.AI, as a way to automate the grunt work. Imagine asking your spreadsheet a question in plain English and getting an answer in seconds. This simple shift means you spend less time wrestling with formulas and more time thinking about what the numbers actually mean.
From Tedious Tasks to Quick Insights
The real magic of AI is its ability to chew through massive amounts of data in the blink of an eye. It can spot trends, flag strange outliers, and find connections that a person might miss after hours of staring at the same numbers. This turns standard financial analysis techniques from a simple reporting exercise into a genuine discovery process.
Take sensitivity analysis, for example. Building one from the ground up is a chore. With an AI assistant, you can just type a request like, "Create a data table showing how net profit changes if revenue fluctuates between $500k and $800k and COGS varies from 40% to 60%." The tool instantly builds the structure and formulas, leaving you free to focus on the strategic implications.
The point of AI in financial analysis isn't to take over your job. It’s to handle the heavy data lifting so you can focus on the bigger picture—the "why" behind the numbers.
This blend of human insight and machine speed is fundamentally changing how finance pros work. It makes deep, meaningful analysis faster and more accessible than ever before.
What This Looks Like in Your Daily Excel Work
Enough with the theory. Let's talk about what you can actually do with an AI tool like Elyx.AI inside your spreadsheet. It’s usually as simple as just telling it what you need.
Here are a few ways AI can transform your daily to-do list:
- Automated Ratio Calculation: Forget typing out formulas for every single ratio. Just highlight your financial statements and ask, "Calculate liquidity, solvency, and profitability ratios for this company over the last three years."
- Quick Narrative Summaries: After you've run the numbers, prompt the AI to, "Write a short summary of the key findings from this performance report, highlighting big year-over-year changes." It’s a great way to get a first draft for your reports.
- Forecasting Head Start: Need a new model? Ask the AI to, "Build a 5-year DCF model based on these historical cash flow assumptions." It will create the entire framework, which you can then tweak and refine with your own expert judgment.
For those who need even more advanced capabilities, specialized tools like an AI Finance Investment Analyst show just how far this technology can go in supporting complex financial decisions.
Traditional vs AI-Powered Financial Analysis in Excel
To really see the difference, it helps to put the old way and the new way side-by-side. The fundamental methods of analysis are the same, but the workflow is worlds apart. If you want to dive deeper into how this technology is reshaping the industry, check out our complete guide on using AI for financial analysis.
The table below breaks down how a few common tasks change when you bring an AI assistant into your Excel workflow.
| Analysis Task | Traditional Excel Method | Streamlined Elyx.AI Method |
|---|---|---|
| Ratio Analysis | Manually writing formulas for each ratio (like =C2/C3) and dragging them across columns. |
A single prompt like "Calculate key financial ratios from this data" generates the full table. |
| Trend Summary | Calculating year-over-year changes by hand and then writing a summary of what you found. | Prompting "Summarize the main trends in this data" for an instant narrative overview. |
| Scenario Modeling | Manually building data tables, linking all the input cells, and formatting the output grid. | Using a simple prompt to generate the entire model structure, formulas and all. |
As you can see, AI doesn't throw out the rulebook of financial analysis. It just helps you work through it faster, removing the friction and letting you apply your skills at a much greater speed and scale.
So, What's Next on Your Path to Smarter Financial Decisions?
We've covered a lot of ground together, from the bedrock principles of ratio and trend analysis all the way to the exciting possibilities of AI-driven forecasting. The big takeaway? These skills aren't just for Wall Street gurus. They’re for anyone who wants to make sharper business decisions and genuinely move the needle in their organization. You now have a roadmap for turning a jumble of data into a clear story.
Think of it this way: you're moving beyond just looking at the numbers. You're learning to read the narrative they're telling about a company's health, its day-to-day effectiveness, and where it's headed. Mastering these techniques is what elevates you from a simple reporter of facts to a strategic advisor.
It's Time to Go from Data User to Data Strategist
Now, the ball is in your court. The best way to make these concepts stick is to start using them in your own Excel work. Dig into your historical data to understand the journey so far, then fire up a forecasting model to get a glimpse of the road ahead. This is the leap from passively consuming data to actively shaping strategy with it.
When you pair timeless financial analysis methods with the sheer speed of an AI tool like Elyx.AI, something powerful happens. You don't just get answers quicker; you start asking smarter, more impactful questions. That’s the real difference between a good analyst and a great decision-maker.
Your First Moves in Excel
You don't have to boil the ocean. You now have a framework for making your spreadsheets work for you, not against you. Start with a few manageable steps:
- Try a simple trend analysis: Just pull up your company's revenue for the last two years and see what the comparison tells you.
- Calculate one or two key ratios: Pick one liquidity ratio and one profitability ratio. See what they reveal.
- Play with "what-if" scenarios: Use Excel to model what happens to your profit if, say, a key cost goes up by 5%.
Every small step you take builds your confidence and hones your analytical eye. It's the most direct route there is to making truly intelligent financial decisions.
Got Questions? We've Got Answers.
Diving into financial analysis can feel a bit overwhelming, and it's natural to have questions as you try to connect these techniques to your own business. Let's tackle some of the most common ones we hear.
What’s the Most Important Technique for a Small Business?
If you're running a small business, one thing matters above all else: cash. That's why cash flow analysis is hands-down the most critical technique to master. It's entirely possible to be profitable on paper but still run out of money and have to close up shop. A close watch on your cash flow statement shows you precisely where your money is coming from and where it's headed.
Once you have a handle on cash, a couple of key profitability ratios are your next best friend. Calculating your Gross Profit Margin and Net Profit Margin gives you a quick, honest look at whether your core business is actually making money.
I'm New to This. How Can I Start Using Excel for Financial Analysis?
The key is to start small. Forget about building a massive, complex financial model right out of the gate. Your best bet is to begin with a document you already know well, like your company’s Profit and Loss (P&L) statement.
A fantastic first project is to run a simple horizontal and vertical analysis.
- Horizontal Analysis: Just line up two years of your P&L data next to each other. Then, calculate the percentage change for each line—revenue, cost of goods sold, marketing expenses, you name it.
- Vertical Analysis: Now, take just one year's P&L. For every expense, calculate what percentage it is of your total revenue.
These two exercises don't require fancy formulas, but they'll reveal powerful insights about your business trends and where your money is really going.
Can We Actually Trust AI for Financial Analysis?
That's a fair question, and the answer isn't a simple yes or no. It’s more about a change in mindset. Don't think of AI as a magic box that spits out perfect answers. Instead, think of it as an incredibly capable co-pilot. Its job is to enhance your expertise, not to make you obsolete.
Think of AI as your super-fast, detail-obsessed junior analyst. It’s a tool for speeding up tedious work and catching the kinds of human errors that creep into repetitive calculations. It can sift through mountains of data in seconds, but the final strategic call and interpretation? That still needs a seasoned expert—you.
AI handles the number-crunching and grunt work, which frees you up to focus on the big-picture decisions that drive the business forward. It boosts the reliability of your financial analysis techniques by bringing speed and consistency, but you always remain in the driver's seat.
Tired of getting bogged down in manual calculations? Ready for faster, smarter insights from your financial data? See how Elyx.AI can become your personal financial co-pilot inside Excel. It automates ratio analysis, generates summaries, and builds models from simple text prompts, letting you focus on strategy.
Learn more and get started with Elyx.AI today.
Reading Excel tutorials to save time?
What if an AI did the work for you?
Describe what you need, Elyx executes it in Excel.
Sign up