How to Build a Powerful Excel DCF Model

At its core, an Excel DCF model is a spreadsheet designed to determine a company's intrinsic value. The process involves forecasting all the cash the company will generate in the future and then discounting that future cash back to its worth today. For analysts and investors, this is the fundamental method for deciding if a stock is a bargain or overpriced.
This guide provides a practical, step-by-step approach to building a robust DCF model in Excel, showing you how to structure your analysis, apply key formulas, and leverage modern tools to enhance your valuation.
Your Blueprint for a Defensible DCF Model
Before launching Excel, it's crucial to understand what makes a Discounted Cash Flow (DCF) model effective. It’s not just about plugging in numbers; it's about building a logical and defensible narrative about a company’s future.
Spending too much time on Excel?
Elyx AI generates your formulas and automates your tasks in seconds.
Sign up →A truly solid model is built on three key pillars. Mastering these will give you a valuation you can confidently stand behind.
The Three Pillars of a DCF Valuation
Every DCF model, whether for a high-growth tech startup or a stable manufacturing firm, rests on the same three components. Understanding how they interact is the first step toward mastering the valuation process.
- Projected Free Cash Flows: This is your forecast of the actual cash the business will produce over a defined period, typically 5 to 10 years. Think of it as the money left over after paying for all expenses needed to run and grow the business—the cash available to all of the company's investors.
- The Discount Rate (WACC): A dollar tomorrow is not worth the same as a dollar today. The discount rate, usually the Weighted Average Cost of Capital (WACC), accounts for this time value of money and the inherent risk of the investment. It brings all future cash flows back to their present-day value.
- Terminal Value: Since you cannot forecast indefinitely, the terminal value estimates the company's worth for all years beyond your detailed forecast period, assuming it settles into a stable, long-term growth pattern.
This structure provides a clear roadmap, keeping the valuation process transparent and organized—essential for both simple investment decisions and complex M&A deals.
A DCF analysis is useful when investing money now and expecting some rewards in the future. A DCF analysis finds the intrinsic value of a business, which is the present value of the free cash flow the company is expected to pay its shareholders in the future.
While this guide focuses on corporate valuation, the principles are widely applicable. For instance, the fundamentals of financial modeling for real estate share a similar logic of structuring assumptions and projecting cash flows, just with a different asset class.
Ultimately, a well-built Excel DCF model tells a compelling financial story grounded in reasonable assumptions, making your final valuation both insightful and easy to defend.
Structuring Your Model and Forecasting Assumptions
Before inputting any numbers, the most critical step is organizing your Excel workbook correctly. A well-structured model is efficient and easy to audit, while a messy one is a source of errors and frustration.
The best practice is to use separate tabs for distinct functions. This simple yet effective approach involves setting up three core sheets:
- An Assumptions tab: This is the central hub for all your key valuation drivers.
- A Calculations or "Model" tab: This is where your 3-statement model (Income Statement, Balance Sheet, Cash Flow) resides.
- An Outputs tab: This serves as your summary dashboard, displaying the final valuation, sensitivity tables, and charts.
This separation of concerns makes your model transparent, easy to audit, and far less prone to errors.
Establishing Your Core Assumptions
Your "Assumptions" tab is the engine of the entire valuation. Every projection and calculation throughout the workbook should link directly back to a cell on this single sheet. Avoid hard-coding numbers directly into formulas at all costs.
Why is this so important? Flexibility. When you want to test what happens if revenue growth is 2% higher or if margins compress, you only need to change one cell on the assumptions tab. The entire model updates instantly, allowing you to run scenarios and sensitivity analyses efficiently.
Your assumptions sheet should comprehensively list all key inputs:
- Revenue Growth Rates: Year-over-year growth projections for the next 5-10 years.
- Operating Margins (EBIT %): Your forecast for the company's core profitability.
- Tax Rate: The company's expected effective tax rate.
- Working Capital Needs: Projections for Accounts Receivable, Inventory, and Accounts Payable, often modeled as a percentage of revenue or Cost of Goods Sold (COGS).
- Capital Expenditures (CapEx): The amount the company will reinvest in assets, often linked to revenue growth.
- Discount Rate (WACC): The Weighted Average Cost of Capital.
- Terminal Growth Rate: The perpetual growth rate assumed for the company beyond the explicit forecast period.
This layout provides a clear overview of the fundamental drivers behind your valuation.
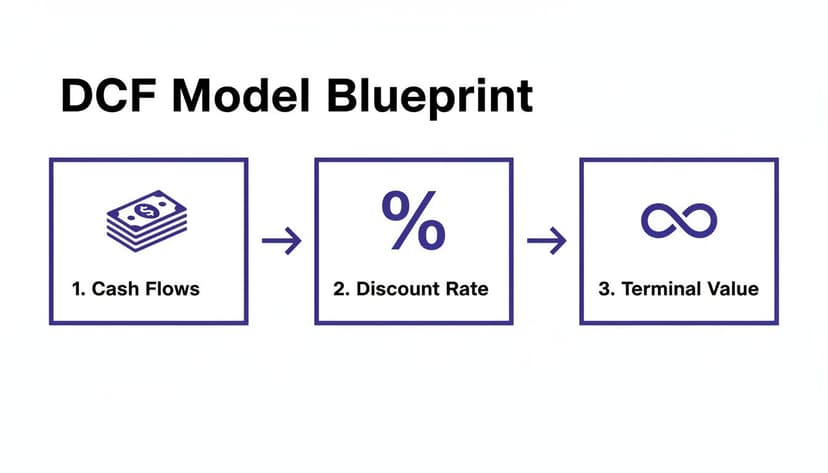
As shown, your assumptions for cash flow, the discount rate, and terminal value are the three pillars that support the entire DCF valuation.
Forecasting Revenue and Costs
Forecasting blends art with science. For example, projecting a constant 25% growth rate for a maturing software company over ten years is unrealistic. No company can sustain such rapid growth indefinitely.
A more defensible approach is to model tapering growth. You might start with 15% growth next year, then step it down to 12%, 9%, 6%, and finally a stable 4% in Year 5. This narrative reflects the business maturing and its market becoming saturated.
The goal of forecasting isn't to be perfectly right—it's to be directionally correct and logically consistent. Your assumptions should tell a believable story about the company's future based on its competitive position, industry trends, and economic outlook.
Once your revenue forecast is set, projecting costs becomes more straightforward. A common method is to tie costs like COGS and Selling, General & Administrative (SG&A) expenses to revenue. For instance, you could assume COGS remains stable at 45% of revenue. For SG&A, you might model it declining from 25% to 22% of sales over five years as the company achieves economies of scale.
Building Working Capital and CapEx Schedules
This is a critical step that beginners often overlook. A growing business must invest in itself through both short-term working capital and long-term capital expenditures (CapEx). Ignoring these cash outflows will significantly overstate a company's free cash flow.
Your working capital schedule forecasts cash tied up in items like inventory and accounts receivable. The easiest way to project this is by assuming these items remain a stable percentage of revenue or COGS, based on historical patterns. If accounts receivable has historically been around 15% of annual sales, that's a solid starting point.
CapEx represents spending on major assets like new facilities, machinery, or technology. For a manufacturing company, you could link CapEx directly to revenue growth, assuming that for every $10 in new sales, $1 must be reinvested. Remember to also model depreciation, which can be calculated as a percentage of the fixed asset base or prior year's CapEx.
For those seeking greater precision, tools for AI data analysis can uncover hidden trends in historical data, helping you build more accurate and data-driven forecast drivers directly within Excel.
Calculating Free Cash Flow and WACC
With your model's foundation and assumptions in place, it’s time to calculate the core of the valuation: the projected cash flows. This is where we translate your forecasts into the tangible cash the business is expected to generate.
We will focus on Unlevered Free Cash Flow (UFCF). UFCF represents the cash available to all capital providers—both debt and equity holders—before accounting for financing decisions. This provides a pure measure of the company's operational performance, which is exactly what's needed for an enterprise valuation.

Unpacking the UFCF Calculation
The UFCF formula may seem complex, but each component tells a vital part of the company's financial story. Let's break it down with the exact Excel formulas you'll use.
The standard formula is:
UFCF = EBIT(1 – Tax Rate) + D&A – Change in Net Working Capital – CapEx
To build a credible Excel DCF model, project UFCF with precision by grounding your assumptions in historical data—ideally 5-10 years' worth—to identify trends and make defensible forecasts.
Here’s the breakdown with example formulas:
EBIT(1 – Tax Rate): This is your Net Operating Profit After Tax (NOPAT). It represents the company's core operational earnings, adjusted to remove any tax benefits from debt.
- Excel Formula: If your EBIT for the year is in cell
C10and your tax rate is in cellB5on theAssumptionssheet, the formula is:
=C10*(1-Assumptions!$B$5)- Explanation: This multiplies EBIT by
(1 - tax rate)to find the after-tax operating profit. The$signs create an absolute reference, ensuring the formula always points to the correct tax rate cell as you drag it across columns.
- Excel Formula: If your EBIT for the year is in cell
+ D&A (Depreciation & Amortization): This is a non-cash charge. It was subtracted to calculate EBIT, but no cash actually left the company, so we must add it back.
- Excel Formula: This is typically a direct link to the D&A line item from your cash flow statement. If D&A is in cell
C15, the formula is:
=C15- Excel Formula: This is typically a direct link to the D&A line item from your cash flow statement. If D&A is in cell
– Change in Net Working Capital (NWC): This tracks the cash used or released by daily operations. An increase in accounts receivable, for example, means less cash on hand.
- Excel Formula: If this year's NWC is in
D20and last year's was inC20, the formula is:
=D20-C20- Explanation: This calculates the year-over-year change. A positive result means cash was consumed and will be subtracted from your UFCF.
- Excel Formula: If this year's NWC is in
– Capital Expenditures (CapEx): This is the actual cash spent on property, plant, and equipment to maintain and grow the business.
- Excel Formula: This is a direct link from your CapEx schedule or cash flow statement. If CapEx is in cell
C25:
=C25- Excel Formula: This is a direct link from your CapEx schedule or cash flow statement. If CapEx is in cell
Summing these components gives you the UFCF for each year of your forecast. For a refresher, our guide on essential Excel formulas can help you build these schedules professionally.
Determining the Weighted Average Cost of Capital (WACC)
Now that you have your future cash flows, you need a discount rate to bring them back to their present value. The industry standard is the Weighted Average Cost of Capital (WACC).
WACC represents the company's blended cost of capital from both debt and equity sources. In simple terms, it's the minimum return a company must earn on its assets to satisfy its investors.
The formula for WACC is:
WACC = (E / (E + D)) * Cost of Equity + (D / (E + D)) * Cost of Debt * (1 – Tax Rate)
Where:
- E = Market Value of Equity (Market Cap)
- D = Market Value of Debt
- Re = Cost of Equity (the return shareholders require)
- Rd = Cost of Debt (the interest rate the company pays on its debt)
Think of WACC as the "hurdle rate." It’s the benchmark that the company’s returns must clear. It neatly bundles up the riskiness of the investment—both business risk (captured in the Cost of Equity) and financial risk (from the level of debt). A higher WACC means more risk, which in turn leads to a lower present value.
Finding the inputs for the Cost of Equity and Cost of Debt requires careful research.
The Cost of Equity is typically estimated using the Capital Asset Pricing Model (CAPM), which involves finding the risk-free rate (e.g., the yield on a 10-year government bond), estimating the equity risk premium, and calculating the company's Beta (a measure of its stock's volatility relative to the market).
The Cost of Debt is the effective interest rate the company pays on its borrowings. For public companies, you can often find the yield-to-maturity on their bonds. For private companies, you may need to look at rates on recent loans or analyze the credit ratings of comparable public companies.
The table below illustrates how these components come together for a sample tech company.
WACC Component Breakdown for a Sample Tech Company
| Component | Variable/Formula | Example Value | Result |
|---|---|---|---|
| Cost of Equity | Re = Rf + Beta * (Rm – Rf) | 4.5% + 1.2 * (5.5%) | 11.10% |
| Cost of Debt | Rd | 6.0% | 6.00% |
| Tax Rate | T | 25.0% | 25.00% |
| Mkt Value of Equity | E | $800M | 80% Weight |
| Mkt Value of Debt | D | $200M | 20% Weight |
| WACC Calculation | **(E/(E+D))Re + (D/(E+D))Rd(1-T)* | **(80%11.1%) + (20%6.0%(1-25%))* | 9.78% |
Once calculated, this single percentage becomes one of the most sensitive drivers in your entire DCF model. A small change in WACC can significantly alter your final valuation.
Determining Terminal Value and Enterprise Value
After forecasting cash flows for the primary projection period, you arrive at the most debated and sensitive part of any Excel DCF model: the Terminal Value.
The terminal value captures the value of all cash flows beyond the detailed forecast period in a single number. Its impact is enormous; for a stable, mature business, the terminal value can easily account for 70% or more of the total enterprise value. Therefore, the assumptions here must be carefully considered.
Two Common Methods for Terminal Value
Analysts typically use two main methods to calculate terminal value. It is best practice to use both as a cross-check to ensure your valuation is reasonable.
- Perpetuity Growth Method: This method assumes the company’s free cash flow will grow at a steady, constant rate forever.
- Exit Multiple Method: This method assumes the company is sold at the end of the forecast period for a multiple of a financial metric, such as EV/EBITDA.
The choice often depends on the industry and the company's maturity. The perpetuity growth method is suitable for stable, established businesses, while the exit multiple approach is common for cyclical industries or when a sale is a plausible exit strategy.
The Perpetuity Growth Method
This academic approach uses the Gordon Growth Model to calculate terminal value.
The Excel formula is:= (Final Year FCF * (1 + g)) / (WACC - g)
Let's break down the components:
- Final Year FCF: The Unlevered Free Cash Flow from the last year of your detailed forecast (e.g., Year 5 or Year 10).
- g (Perpetual Growth Rate): This is your most critical assumption. It represents the constant rate at which you expect FCF to grow forever. This rate must be conservative and should not exceed the long-term growth rate of the overall economy. A range of 2.0% to 3.0% is standard for a developed market.
- WACC: Your calculated Weighted Average Cost of Capital.
Example Calculation:
Suppose your final year's UFCF is $100 million, your WACC is 9.0%, and your terminal growth rate is 2.5%.
- Formula:
=(100 * (1 + 0.025)) / (0.09 - 0.025) - Result: This gives a terminal value of approximately $1.577 billion.
The Exit Multiple Method
This method is more market-based, asking: what would a buyer pay for this business in the future? The value is typically based on a multiple of a metric like EBITDA.
The formula is straightforward:Terminal Value = Final Year EBITDA * Exit Multiple
To determine the exit multiple, research comparable public companies or recent M&A transactions in the same industry. If similar businesses trade at an average EV/EBITDA multiple of 8.0x, that provides a solid, defensible starting point.
The Exit Multiple Method reflects current market sentiment, which is a key advantage. However, it can be skewed by market bubbles or downturns. Calculating terminal value using both methods allows you to compare the implied growth rates and multiples for reasonableness.
From Terminal Value to Enterprise Value
The terminal value must be discounted back to its present value, just like the individual cash flows in your forecast period.
Here’s the Excel formula you’ll use:= Terminal Value / (1 + WACC) ^ Number of Forecast Years
Using our $1.577 billion terminal value and a 5-year forecast, the Present Value would be =1577 / (1 + 0.09)^5, which is approximately $1.025 billion.
Finally, calculate the Enterprise Value by summing the present values of all projected free cash flows and the present value of the terminal value. This figure represents the total value of the company’s core business operations.
For example, when analysts value a company like Apple, they might start with revenue growth around 8-12% that gradually slows to 4%, paired with operating margins of 25-30% and a WACC between 7-9%. In such models, the terminal value often accounts for 60-80% of the final Enterprise Value, highlighting the importance of these assumptions. You can explore detailed examples on sites like Mergers & Inquisitions.
The last step is to derive the Equity Value. To do this, simply subtract the company's net debt (Total Debt minus Cash & Cash Equivalents) from the Enterprise Value. The remaining figure is the theoretical value of the company's shares. If your formulas become complex, an AI formula generator can be a useful tool to ensure they are structured correctly in Excel.
Stress-Testing Your Model With Sensitivity Analysis
A single valuation figure from your Excel DCF model is not the end of the analysis; it's the beginning. True insight comes from understanding how that valuation changes when you adjust your core assumptions. This is where sensitivity and scenario analysis come in—they are essential for stress-testing your work and bringing your valuation to life.
A valuation is only as good as its inputs. By varying key drivers like the discount rate and growth assumptions, you can assess the robustness of your final number. This process transforms a static model into a dynamic decision-making tool, revealing a range of potential outcomes instead of a single, misleadingly precise figure.

Using Data Tables to See the Full Picture
Excel's Data Tables feature is perfect for sensitivity analysis. It allows you to create a matrix showing how an output (like equity value per share) responds to simultaneous changes in two key inputs. The most common drivers to test are the WACC and the terminal growth rate.
Setting up a two-variable data table is straightforward:
- Layout: In a blank area of your sheet, list a range of potential WACC values down the first column and a range of terminal growth rates across the top row.
- Link Output: In the top-left corner cell of this grid, create a direct link to your final output cell (e.g., equity value per share).
- Run Analysis: Select the entire matrix, then go to the Data tab > What-If Analysis > Data Table.
- For the "Row input cell," link to the original terminal growth rate cell in your model.
- For the "Column input cell," link to your original WACC cell.
Click OK, and Excel will populate the grid instantly. This table provides an immediate visual representation of your model's sensitivity. If a small 0.5% increase in WACC causes a 20% drop in your valuation, you've identified a critical pressure point.
The goal isn't to eliminate uncertainty—it's to understand its boundaries. Sensitivity analysis gives you a clear, visual map of risk. It shows which assumptions demand the most scrutiny and helps you present a more honest, defensible range of values.
A Practical Checklist for Auditing Your Model
Before presenting your findings, a thorough audit is essential. A single error can undermine your credibility. While formal risk analytics methods can be applied, a detailed mechanical audit is the first line of defense.
Use this checklist to catch common errors:
- Hunt for hard-codes: Are there any numbers typed directly into formulas that should be linked to your assumptions tab? Use
F5> "Special" > "Constants" to quickly find them. - Check formula consistency: Ensure formulas are dragged correctly across all years in your forecast. Inconsistent formulas, especially in the last column, are a common mistake.
- Trace your drivers: Use Excel's "Trace Precedents" tool to visually confirm that your final valuation is linked to the correct assumptions.
- Balance sheet check: Your balance sheet must balance to zero every single year (Assets = Liabilities + Equity). An imbalance indicates a fundamental error.
- Do a sanity check: Step back and assess the narrative your numbers tell. Does the implied EV/EBITDA multiple from your terminal value seem reasonable for the industry? Is the projected free cash flow growth logical?
Identifying these issues is critical. If you're stuck on formula errors, our guide on how to fix common https://getelyxai.com/en/excel-errors can be an invaluable troubleshooting resource.
Frequently Asked Questions About DCF Modeling
Even with a solid template, complex questions often arise when building an excel dcf model. Here are answers to some of the most common ones.
How Many Years Should I Forecast in a DCF Model?
The industry standard for stable, mature companies is a five-year forecast. This period is long enough to capture the impact of current strategies without extending so far into the future that projections become pure speculation.
For high-growth companies or businesses in cyclical industries, a 10-year forecast is often more appropriate. The primary goal is to project financials until the company reaches a "steady state"—a point where its growth rates and margins have normalized. This is the ideal point to apply a terminal value, as it avoids capturing major operational shifts within that single figure.
What Are the Most Common Mistakes in an Excel DCF Model?
The most significant errors are typically found in the underlying assumptions, not in the Excel formulas themselves. The most common mistake is an overly optimistic terminal growth rate. As a rule of thumb, the perpetual growth rate should never exceed the long-term GDP growth rate of the country where the company operates. A higher rate implies the company will eventually outgrow the entire economy, which is a logical impossibility.
Another classic error is a disconnect between assumptions. For example, projecting aggressive revenue growth without a corresponding increase in capital expenditures (CapEx) and working capital is unrealistic. Growth requires investment, and your model must reflect this reality.
One technical trip-up I see all the time is using book values instead of market values when calculating WACC. The weights for debt and equity must be based on their current market values to get a true picture of the company's financing costs.
How Can AI Tools Help Me Build a DCF Model?
AI assistants integrated into Excel can act as a powerful co-pilot, dramatically accelerating the model-building process. Instead of manually writing complex formulas or building schedules from scratch, you can provide instructions in plain English.
Imagine using simple prompts like these:
- "Project revenue for the next 5 years using the historical 3-year CAGR from cells C5:E5."
- "Create a sensitivity table to show how enterprise value in cell B50 changes based on WACC and the terminal growth rate."
- "Build a depreciation schedule from my CapEx forecast, assuming a 5-year straight-line method."
These AI-powered tools offload the most tedious and mechanical parts of building an excel dcf model. This frees you to focus on the strategic thinking, critical analysis, and assumption-setting that truly drive the valuation, rather than getting bogged down in manual tasks. To learn more, explore the capabilities of AI in Excel.
Ready to stop wrestling with manual tasks and focus on high-impact analysis? Elyx AI is your autonomous agent inside Excel. It doesn't just suggest formulas—it builds entire reports, creates charts, cleans data, and performs complex analyses from a single command. Start your free 7-day trial and save hours of work this week.
Reading Excel tutorials to save time?
What if an AI did the work for you?
Describe what you need, Elyx executes it in Excel.
Sign up