Master Your Data with an Excel Add In Data Analysis Tool

If your daily Excel routine feels like a constant battle with formulas and pivot tables, I get it. You're likely missing out on a much smarter, faster way to get things done. An Excel add in data analysis tool, especially one running on AI like Elyx.AI, is the upgrade you need to solve the real-world headaches every analyst faces.
Move Beyond VLOOKUP with an AI Data Analysis Add In
For a long time, being an "Excel guru" meant memorizing a library of complex formulas, wrestling with unruly pivot tables, and dedicating hours to mind-numbing data cleaning. Those skills are still valuable, but they represent an older, more manual way of working. In today's fast-paced business world, we need insights now, and the old methods often can't keep up.
This is exactly where a modern Excel add in data analysis tool completely changes the game. It’s designed to tackle those common frustrations, turning Excel from a static grid into a dynamic, conversational workspace. Imagine swapping out VLOOKUP, INDEX(MATCH), and those dreaded nested IF statements for simple, plain-English commands.
Spending too much time on Excel?
Elyx AI generates your formulas and automates your tasks in seconds.
Sign up →The Big Shift to Conversational Analysis
The real breakthrough here is moving from writing formulas to asking questions. Instead of spending ten minutes trying to remember the right syntax to clean a messy "State" column, you can just tell the add-in, "Standardize this column to two-letter state abbreviations." This simple shift saves an incredible amount of time and makes deep analysis accessible to more people.
Bringing AI into Excel has a huge impact on efficiency. In fact, many enterprise users of AI tools have seen productivity jump by as much as 30%. We're even seeing this trend in native Excel features, like Microsoft's 'Analyze Data,' which lets you use natural language to get charts and pivots without touching a formula. You can find more great insights on how AI is changing financial analysis over at Excelmatic.ai.
The true advantage of an AI add-in isn’t just about speed. It's about freeing up your brainpower to focus on strategy and interpretation instead of getting bogged down in formula syntax and manual data prep.
Let's look at how this plays out in a typical data analysis workflow. The table below gives a quick snapshot of how an AI add-in fundamentally changes your approach to common tasks.
Traditional Excel vs AI Add In Capabilities
| Analysis Task | Standard Excel Method | AI Add-In Method (e.g., Elyx.AI) |
|---|---|---|
| Data Cleaning | Manual find/replace, complex formulas (TRIM, PROPER, etc.), Text to Columns wizard. | Simple text commands like "remove extra spaces" or "standardize state names." |
| Summarization | Building a PivotTable or writing multiple SUMIFS/COUNTIFS formulas. | Ask a question: "What are the total sales per region?" or "Show me the top 5 products." |
| Visualization | Manually selecting data and choosing a chart type from the "Insert" menu. | Ask for what you need: "Create a bar chart of sales by month." The AI suggests the best visuals. |
| Complex Lookups | Writing VLOOKUP or INDEX(MATCH) formulas, often nested and prone to errors. |
Plain English requests like "Merge this sheet with the customer data based on email address." |
As you can see, the AI method isn't just a shortcut—it's a more intuitive way to interact with your data, letting you stay in the flow of your analysis.
How an AI Add-In Actually Enhances Your Workflow
Think about the things you do in Excel every single day. An AI add-in doesn't just do them faster; it opens up possibilities for tasks that would have been too tedious to even attempt with standard functions.
Here’s what that looks like in practice:
- Data Cleaning: Instantly spot and fix inconsistencies, zap duplicates, and intelligently fill in missing values based on context.
- Rapid Summarization: Pull key performance indicators (KPIs) and high-level summaries without ever having to build a pivot table from scratch.
- Smart Visualization: Just ask for a chart. The AI can analyze the data and suggest the perfect visualization to tell a compelling story.
At the end of the day, an Excel add in data analysis tool like Elyx.AI is about augmenting your skills, not replacing them. It takes over the repetitive, mechanical work, so you can focus on what people do best: asking sharp questions and turning raw data into real business intelligence.
Installing Your First AI Data Analysis Add-In
Bringing a new tool like Elyx.AI into your Excel toolkit might sound complex, but I've found the process is surprisingly straightforward. Let's walk through how to get it installed directly from the Microsoft AppSource store. My goal here is to get you up and running in just a few minutes, while also helping you sidestep a few common setup hiccups I've seen people run into.
Your journey starts right inside Excel. Head over to the Insert tab on the ribbon and find the "Get Add-ins" button. Clicking this opens up the Office Add-ins store, which is packed with thousands of different tools.
In the search bar at the top, just type in "Elyx.AI" and hit Enter. When it pops up in the search results, click the "Add" button and follow the simple on-screen instructions to grant it the necessary permissions. It’s a quick, one-and-done process.
Finding and Launching the Add-In
Once the installation is complete, you should see a brand-new Elyx.AI tab appear in your Excel ribbon. Go ahead and click it. This action opens the main panel, which typically docks on the right side of your screen. Think of this sidebar as your new command center for all things AI analysis.
If for some reason it doesn't appear automatically, don't worry. You can always launch it manually from the "My Add-ins" section within the same Insert > Get Add-ins area.
One quick thing to check before you start: make sure you're using a compatible version of Microsoft 365. Most modern, subscription-based versions of Excel play nicely with these add-ins. If you run into any weird loading errors, a quick update to your Office suite is usually the fix.
Getting the add-in installed is the first real step toward making your workflow so much more efficient. The image below gives you a nice visual overview of the core process you'll be following once everything is ready to go.
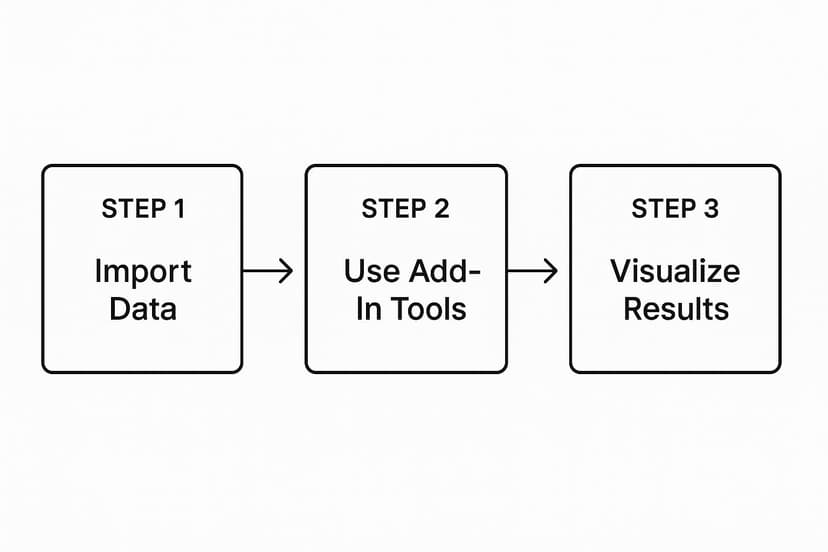
As you can see, it boils down to a simple, three-stage approach: bring your data into Excel, use the add-in's tools to work your magic, and then create compelling charts and summaries from the results.
Integrating AI Into Your Workflow
With Elyx.AI installed, the real magic happens when you start making it a natural part of your daily data-handling routine. For a deeper dive into making this happen seamlessly, this effective AI workflow automation integration manual offers some great broader strategies that I've found helpful.
The whole point is to spend less time wrestling with setup and more time uncovering insights. When the installation is done right, the add-in feels like a natural extension of Excel—always there to help you clean, summarize, or visualize data on the fly.
Here are a few personal tips for a smooth start:
- Pin the Add-in: If you know you'll be using Elyx.AI often, I highly recommend pinning the add-in pane. This keeps it open between sessions, so you don't have to re-launch it every time.
- Sign In: You’ll likely need to create a free account or sign in to get access to all the features. It only takes a moment and is well worth it.
- Explore the Interface: Before diving into a serious project, take a minute to just click around. Get a feel for the chat function, the formula generator, and the cleaning tools in the sidebar. A little familiarity goes a long way.
With the installation wrapped up, you’ve just added a powerful excel add in data analysis capability to your arsenal. You're officially ready to shift from tedious manual tasks to conversational data analysis, where you can ask questions and get answers in seconds.
Automate Tedious Data Cleaning and Preparation
If you've ever worked with data, you know the feeling. That raw data export lands in your spreadsheet, and it's a disaster. It's the biggest headache in any analysis—messy data can torpedo your results before you even get started. This is exactly where a smart Excel add in data analysis tool really proves its worth, taking the grueling cleanup work off your plate.
Let’s say you just pulled a sales report from your CRM. It's a classic mess. You’ve got duplicate entries, gaping holes in key columns, and text formats all over the place—think 'CA', 'Calif.', and 'California' all trying to represent the same state. The old-school approach meant wrestling with a chain of TRIM and PROPER formulas, then navigating the "Remove Duplicates" tool. With an AI add-in like Elyx.AI, it's more like having a conversation with your spreadsheet.

This conversational method is a huge time-saver. Instead of remembering formulas, you just tell the AI what you need in plain English.
Practical Commands for Flawless Data
So, how does this actually work? Let's get into some real-world prompts you can type directly into the add-in's chat. These examples show just how quickly you can whip a messy sheet into shape for serious analysis.
- Standardize Text: "Standardize the 'Country' column to use full country names."
- Fill Missing Values: "Fill empty cells in the 'Sales' column with the column average."
- Remove Duplicates: "Find and remove all duplicate rows based on the 'Order ID' column."
- Split Columns: "Split the 'Full Name' column into 'First Name' and 'Last Name' columns."
This isn’t a brand-new concept, of course. For years, tools like Power Query have been helping analysts streamline their work, with some studies showing it can cut preprocessing time by 40-60%. What AI add-ins do is build on that solid foundation by adding a natural language layer, making powerful data prep more intuitive than ever before.
The real win is changing your mindset from "How do I write a formula for this?" to "What do I want to accomplish?" You just describe the outcome, and the AI figures out how to get it done.
From Data Import to Final Cleanup
This approach isn't just for cleaning up data that's already in your sheet. A good AI add-in helps with the whole pipeline, starting from the moment you bring data in. Many businesses are already automating lead flow directly into spreadsheets to save time. Once that raw data is in Excel, the add-in can step in to handle the final polish.
The whole point is to make your life easier. If you want to dive deeper, we have a complete walkthrough on https://www.getelyxai.com/en/blog/automated-data-cleaning-excel. By handing off these repetitive but critical tasks to AI, you free up your time for the work that actually matters: finding those key insights and making smart, data-backed decisions.
Get Instant Answers with AI-Powered Summaries
Alright, your data is clean and prepped. Now for the fun part: getting answers. This is usually where you'd start wrestling with pivot tables for every little question that pops into your head. But with the right excel add in data analysis tool, you can skip all that tedious work and just ask your data for what you need.
Let’s say you’re staring at a big marketing dataset. It's perfectly organized, but now your boss wants to know how the latest campaigns are performing, and they need the numbers yesterday. Instead of diving into a formula-building frenzy, an AI tool like Elyx.AI lets you have a conversation with your spreadsheet.

This is a game-changer. You get to stay focused on the meaning behind the numbers, not the mechanics of making Excel spit them out. It’s a huge leap in productivity.
Ask Real Business Questions, Get Real Answers
The real magic of a good AI add-in is that it understands what you're actually asking. You don't have to think like a machine and translate your business needs into complex formulas. You just ask. This opens up serious data analysis to everyone on the team, not just the pivot table gurus.
Using that same marketing dataset, here are a few prompts I might throw at it:
- "What's the conversion rate for each marketing channel?"
- "Show me the top 5 ad campaigns by total spend."
- "What's our average cost per lead on social media?"
- "How many conversions did we get last quarter?"
The AI takes your plain-English question, does all the heavy lifting in the background, and gives you a clear, simple summary.
Go From Raw Data to Key Insights in Seconds
Think about the old way. To find the conversion rate per channel, you’d have to build a pivot table, drag fields around, maybe add a calculated field… it takes time and a lot of clicks. With an AI tool, you just ask the question and get an immediate answer.
The real win here is speed. When you can get answers in seconds instead of minutes, you start asking more questions. You can test different ideas on the fly and build a much richer understanding of what your data is telling you.
This kind of rapid analysis is what allows you to make smart decisions quickly. If you can spot an underperforming ad campaign in 30 seconds, you can shift that budget to a winner before you waste another dime. These are the kinds of practical excel data analysis tips that directly impact your results, and we dive deeper into them in our guide.
How the AI Presents Your Summaries
When you ask Elyx.AI a question, it doesn't just return a single number. The response is much more useful and typically includes:
- The Direct Answer: The specific KPI or number you asked for, front and center.
- Important Trends: It might point out that one channel is crushing the others on conversion rate or that a particular campaign is a major outlier.
- Quick Data Tables: The summary is often shown in a neat little table right in the chat window, perfect for copying straight into an email or presentation slide.
This whole process lets you operate like a seasoned analyst, pulling the most critical insights to the surface almost instantly. It’s a core feature of any modern excel add in data analysis toolkit and turns your spreadsheet from a static grid into an intelligent partner.
Create Powerful Visualizations with Simple Commands
We've all heard that a compelling chart is worth a thousand rows of data. It’s true. After you've spent the time cleaning and summarizing your dataset, the final step is to bring those findings to life visually. But this is often where the real headache begins, as you get bogged down wrestling with Excel’s chart builder and clicking through endless formatting menus.
Fortunately, modern tools like Elyx.AI completely change the game. What used to be a manual, click-heavy chore can now be done with simple, conversational commands. You can forget trying to remember which chart type works best for your data; with an AI assistant, you just have to describe the story you want to tell.

From Plain English to Insightful Charts
Let's say you're working with a regional sales dataset and need to quickly see how each area performed for an upcoming meeting. Instead of manually highlighting data ranges and navigating menus, you just type what you need into the Elyx.AI chat pane. It feels a lot more like talking to a colleague.
Here are a few prompts I've used that work incredibly well:
- "Create a bar chart of sales by region."
- "Generate a line chart showing monthly revenue for the last twelve months."
- "Show me a scatter plot of ad spend versus conversion rate."
The AI interprets your command, finds the right data, and instantly builds the chart for you. This conversational approach is a massive time-saver, letting you focus on what the chart actually means instead of getting lost in the weeds of building it. For a deeper dive on this, check out our guide on how to https://www.getelyxai.com/en/blog/create-charts-in-excel with AI.
Get Smart Recommendations on Chart Types
Here’s one of my favorite features: Elyx.AI can suggest the most effective chart type for your specific data. If you’re not sure whether a bar chart or a pie chart would better illustrate your regional sales breakdown, the AI can make an intelligent recommendation.
By analyzing the structure and relationships within your data, the AI ensures your insights are communicated clearly and with maximum impact. This removes the guesswork and helps you avoid common data visualization mistakes.
This approach builds on a long history of making analysis more accessible in Excel. I remember when Microsoft released the Analysis ToolPak back in the mid-1990s—it was one of the first major steps to bring complex statistical functions directly into spreadsheets. That move helped establish Excel as a serious analytical tool, a legacy that AI add-ins are now taking to the next level.
Ultimately, the goal is to tell a clear and persuasive story with your numbers. To truly master this, it's essential to visualize financial data effectively, a skill that turns raw analysis into real business intelligence. An AI assistant simply makes that process faster and more intuitive than ever before.
Answering Your Questions About AI Add-ins for Excel
Whenever you’re thinking about bringing a new tool into your workflow, you're going to have questions. It's only natural. When it’s an Excel add in for data analysis, you want to know how it plays with your existing tools and, most importantly, if it keeps your data safe. Let's get straight to the point and answer some of the most common questions I hear from users.
Does an AI Add-in Replace Tools Like Power Query?
Not at all. A better way to think about it is that an AI add-in like Elyx.AI is a collaborator for Power Query, not a replacement. Power Query is an absolute beast for creating detailed, repeatable data pipelines. It’s what you use for the heavy-lifting, the structured ETL (Extract, Transform, Load) work that you need to be rock-solid and run the same way every time.
An AI tool, on the other hand, excels at agile, in-the-moment analysis. It’s perfect for when you just want to ask a quick question of your data using plain English. For example, you might use Power Query to build a clean, reliable data model. Then, instead of building a bunch of pivot tables, you could turn to the AI add-in to rapidly fire off questions and get charts back instantly. They serve different but complementary purposes; the AI is all about speed and simplicity for immediate insights.
How Secure Is My Data with a Third-Party Add-in?
This is a big one, and rightly so. Data security should always be top of mind. The good news is that add-ins from the official Microsoft AppSource have already been through a vetting process by Microsoft to ensure they meet specific security and operational standards. Tools like Elyx.AI are built with strict privacy policies in mind and often use end-to-end encryption for secure processing.
My personal rule of thumb is to always review the add-in's privacy policy and the permissions it asks for before clicking 'install.' If you're working with sensitive company data, your first stop should always be your IT department. Get their blessing to make sure the tool aligns with your company's internal governance rules.
A quick check upfront ensures you can get your work done without running into any compliance headaches later.
Can I Perform Advanced Statistical Analysis?
Right now, most AI-powered add-ins are focused on streamlining the everyday data analysis tasks that eat up the most time—think data cleaning, quick summaries, and creating standard business charts. They’re fantastic for that initial exploration phase.
For highly specialized statistical work like regression analysis, ANOVA, or Fourier analysis, your traditional powerhouses are still the way to go. This is where you’ll want to stick with:
- Excel's own Analysis ToolPak: It's a reliable, built-in option for many common statistical functions.
- Dedicated software like R or SPSS: These are the gold standard for deep academic or scientific research.
What the AI add-in can do, however, is get your data ready for that advanced work. You can use it to handle all the tedious cleaning and preparation, which often takes up the most time. This makes the entire process leading up to your serious statistical modeling much faster and more efficient.
Ready to swap tedious formulas for simple, conversational commands in your spreadsheet workflow? Elyx.AI fits right into Excel, helping you clean, analyze, and visualize your data in seconds. See for yourself how much time you can get back in your day.
Discover the power of Elyx.AI today!
Reading Excel tutorials to save time?
What if an AI did the work for you?
Describe what you need, Elyx executes it in Excel.
Sign up