Embedding Excel Into PowerPoint: A Practical Guide

Embedding an Excel file directly into your PowerPoint creates a live, dynamic link between your spreadsheet and your slides. This is a huge deal. It means that when you update the numbers in your Excel file, your charts and tables in PowerPoint can update automatically with a quick refresh. Your reports stay accurate and current, without any last-minute scrambles.
Why Live Data Will Change Your Presentations
Picture this: you're minutes away from a big presentation, and you get an email with updated sales figures. Instead of panicking and manually re-doing every chart, you just open your Excel file, pop in the new numbers, and refresh your PowerPoint. Done. That’s the power of linking your data.
For anyone working in finance, sales, marketing, or research, this is more than just a convenience—it's a complete game-changer. You can finally stop the tedious, error-prone cycle of copying and pasting screenshots. A live connection saves countless hours and, more importantly, eliminates the risk of presenting outdated information. It instantly makes your reports more credible.
Spending too much time on Excel?
Elyx AI generates your formulas and automates your tasks in seconds.
Sign up →The Power of Dynamic Information
Beyond just saving time, this approach makes your entire reporting process more agile and reliable.
- Always Accurate: Your slides will always reflect the single source of truth—your original Excel file. No more embarrassing moments when someone spots a discrepancy between your chart and the latest report.
- Seriously Efficient: Think about all the time spent manually updating weekly or monthly reports. With a linked file, a single click can refresh every piece of data in your presentation.
- Looks More Professional: Presenting data that you can refresh on the fly shows a high level of competence and attention to detail. It builds trust and shows your audience you’re on top of your game.
It's clear that professionals are moving in this direction. A 2022 Microsoft survey revealed that over 78% of professionals regularly pull Excel data into PowerPoint for their reports. More tellingly, 65% preferred embedding or linking the data instead of using static images, precisely because they need that real-time accuracy.
When you're ready to do this yourself, you'll be using the "Paste Special" dialog box. It's the command center for creating these live connections.

As you can see, you get options like "Paste Link" and creating a "Microsoft Excel Worksheet Object." These are your keys to building a truly dynamic presentation.
This shift from static to dynamic content is a fundamental one. Understanding the advantages of live content delivery is about more than just data; it's about giving your audience the most current and relevant information possible, every time.
Linking vs. Embedding: Which Method is Right for You?
When you bring Excel data into PowerPoint, you have a big decision to make: should you link it or embed it? They sound alike, but the one you choose completely changes how your presentation behaves. The whole thing boils down to a simple question: Do you need your data to stay live and update automatically, or do you need a self-contained presentation that anyone can open?
Getting this right from the start will save you a ton of headaches later. Your choice affects everything from file size and portability to how you manage data updates. Let's break down the trade-offs so you can build a smarter presentation.
Deciding Between Linking and Embedding
To help you decide at a glance, here’s a quick comparison of how each method handles key aspects of your presentation.
Linking vs Embedding Excel Objects in PowerPoint
| Feature | Linking | Embedding |
|---|---|---|
| Data Updates | Automatically updates when the source Excel file changes. | Stays static; a snapshot of the data at a specific time. |
| File Size | Keeps presentation file size small. | Significantly increases presentation file size. |
| Portability | Requires sending both the PPT and the source Excel file. | Fully self-contained; only the PPT file is needed. |
| Link Integrity | Links can break if the source file is moved or renamed. | No risk of broken links. |
| Best For | Live dashboards, recurring reports, and dynamic data. | Final reports, archives, and one-time presentations. |
Ultimately, your choice depends entirely on how your presentation will be used and shared.
When to Link for Live, Dynamic Data
Linking is your go-to method when the numbers in your Excel sheet are always in flux. Think about a weekly sales dashboard, a project tracker updated by your team, or any report that needs to reflect the absolute latest information.
When you link an Excel object, you’re creating a live connection to the source file. Any change you make in that spreadsheet can be pushed to your PowerPoint with a quick refresh. This keeps your presentation nimble and its file size small because the data isn't actually stored inside it—PowerPoint just "points" to the external Excel file.
- Perfect for: Recurring reports, team dashboards, and any situation where data accuracy is critical.
- The biggest win: Your PowerPoint is always in sync with your source data.
- Heads up: If you email the presentation, you must also send the Excel file. If the source file gets moved or renamed, you'll have to deal with broken links.
When to Embed for a Self-Contained, Portable File
On the other hand, embedding is the better choice for final, static reports. This is for things like an annual financial summary, a project post-mortem, or a quarterly business review that won't be changing.
When you embed an Excel object, you’re tucking a complete, editable copy of the workbook right inside your PowerPoint slide. This makes your presentation totally self-contained. You can send the single .pptx file to anyone, and they'll have everything they need without a separate Excel sheet. The main trade-off? A much larger presentation file, which can sometimes make it sluggish. If you're exploring different ways to handle this kind of data, you might find our guide comparing various business reporting tools helpful.
The core difference is simple: Linking is all about live data and a small file size. Embedding is all about portability and creating a self-sufficient document. Pick the one that fits how your presentation needs to work in the real world.
How To Insert and Link Dynamic Excel Charts
Nothing tells a story like a chart that updates itself. When you link an Excel chart to your PowerPoint presentation, you're creating a live connection. This means any changes you make in your spreadsheet are automatically reflected on your slide. It's a game-changer, especially when you're working with data that's constantly in flux.
The secret sauce here is the Paste Special command. First, get your chart looking exactly how you want it in Excel. Nail down the design, colors, and fonts before you even think about moving it. Trust me, it’s way easier to get it right in Excel than to fiddle with it in PowerPoint later. Once it's perfect, just copy it. If you need a refresher on building great visuals, our guide on how to create charts in Excel is a great place to start.
Creating the Live Connection
With your chart copied, head over to your PowerPoint slide. Don't just hit Ctrl+V. Instead, go to the Home tab, click the little arrow under the Paste button, and choose Paste Special. This is where the magic happens.
A dialog box will pop up, giving you a few important choices. You'll see options like "Microsoft Excel Chart Object" and a choice to either "Paste" or "Paste link." The key is to select Paste link. This tells PowerPoint to look back at the original Excel file for the chart's data, rather than just dumping a static copy into your slide.
This simple infographic breaks down the core difference between linking for live updates and embedding for a self-contained file.
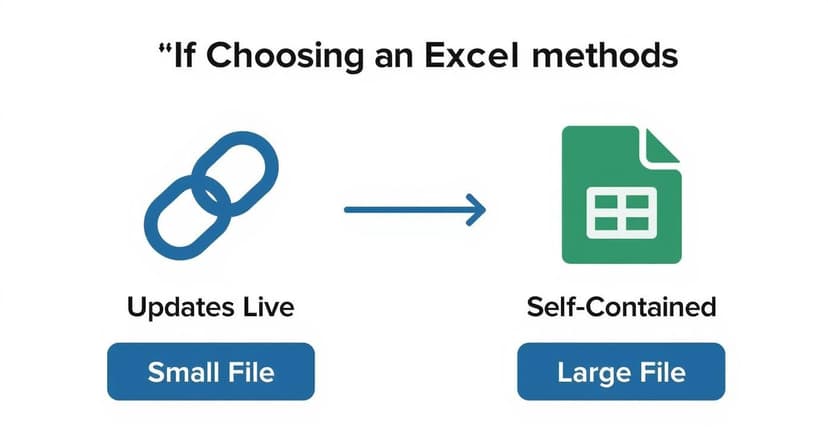
As you can see, linking is perfect when your data is fluid and you want to keep your file size down. Embedding is better when you need a static, portable presentation that won't change.
Pro Tip: After linking your chart, you can force an update at any time. Just right-click the chart in PowerPoint and select "Update Link." Any tweaks to the data or formatting in your Excel sheet will instantly appear on the slide.
This isn't just a neat trick; it's becoming standard practice. A 2023 study revealed that 82% of companies in the Asia-Pacific region are now using linked Excel charts for their high-stakes executive and client presentations. Even better, that same study found this approach slashed the average time spent updating presentations from 4.5 hours down to just 1.8 hours per week. You can dig into the full research about automating Excel data to see more of the findings.
Embedding a Full Excel Workbook for Deep Dives
Sometimes, a single chart or a snippet of data just won't do. You're in a situation where your audience needs to see the whole picture—the raw numbers, the financial model's assumptions, or the complete dataset you've tucked into an appendix. When a deep dive is required, embedding the entire Excel workbook directly into your PowerPoint is the way to go.

Think of it as packaging the whole Excel file right inside your presentation. This makes your PowerPoint a completely self-contained document. During your talk, you can have the workbook appear as a simple, clickable icon, or even display it as a live, scrollable spreadsheet on the slide. This level of transparency is fantastic for letting stakeholders dig into the data themselves, right there in the meeting.
When to Go All-In with a Full Workbook
Embedding the whole file makes the most sense when the data behind your visuals is just as critical as the summary itself. I see this a lot in technical fields or industries with heavy regulation, where every number needs to be verifiable.
For example, the practice of embedding excel into powerpoint is common in certain sectors. One report found that 55% of healthcare organizations embed full workbooks for things like clinical trial presentations and regulatory filings. Likewise, 63% of engineering firms use this exact method for detailed project reports where every calculation needs to be on hand. If you're curious about this, you can learn about data presentation trends that are becoming standard in professional reporting.
By embedding the workbook, you're not just showing a conclusion; you're providing the evidence. This builds immense trust and allows for real-time "what-if" analysis during Q&A sessions.
Now, this powerful technique does have one significant trade-off: file size. Because you're literally stuffing an entire spreadsheet file inside your presentation, the .pptx file can get bulky fast. A large file can be slow to open and a real pain to share over email.
Before you go this route, ask yourself a few questions:
- Is full access really necessary? If your audience only needs to see the highlights, a linked chart is probably a smarter, lighter choice.
- How are you sharing the file? If the presentation becomes too large, you'll likely need to use a cloud sharing service instead of attaching it to an email.
- Can you trim the fat? It's a great habit to delete any unneeded worksheets or data from the Excel file before you embed it. This can make a huge difference in your final presentation size.
Managing Your Linked Files
Once you’ve linked your Excel data to a PowerPoint slide, the magic is in keeping it current. But what happens when the source file moves, or you need to refresh the data right before a big presentation? That’s where you need a control panel for your connections.
Thankfully, PowerPoint has a built-in tool for this. Just head to File > Info. On the right side of the screen, you’ll spot a section called "Related Documents." Click on "Edit Links to Files," and you'll open a simple but powerful dashboard that shows every single external file linked to your presentation. This is your command center.
Your Data Connection Command Center
This little dialog box is surprisingly useful. It gives you direct control over how your PowerPoint presentation communicates with its source Excel files.
You can handle a few key tasks from here:
- Check Status: Get a quick, at-a-glance view to see if your links are healthy or broken.
- Update Manually: If you’ve made a last-minute change to your spreadsheet, you can pull the latest data into your slides instantly. No need to wait for an automatic prompt.
- Change Source: This one is a lifesaver. We’ve all been there—someone renames the Excel file or moves it to a different folder, and suddenly the link breaks. This button lets you easily relink your slide to the file's new location.
- Break Link: Decided you want to freeze the data as-is? Breaking the link converts the embedded object into a static picture or table, severing the connection to the source file for good.
I find the most common headache is a broken link, usually because a file was moved or renamed during a team project. The 'Change Source' button is the first place I go to fix it—it saves a ton of time.
Managing these links is just one part of the puzzle. It’s also smart to think about data protection. It’s worth reading up on ensuring robust Office 365 backup to make sure your important files are safe from accidental deletion or corruption. And if you're looking to really level up your efficiency, learning how to automate Excel workflows can make managing complex data even easier.
Answering Your Top Questions
When you start weaving Excel data into your PowerPoint slides, a few common questions always pop up. I've been there myself, so let's walk through the answers to make sure your presentations run smoothly every time.
What Happens if I Email a PowerPoint With a Linked Excel File?
This is a classic "gotcha" that trips a lot of people up. When you link a file, your PowerPoint is just holding a signpost pointing to where that Excel file lives on your computer.
If you email just the PowerPoint, the person on the other end gets the signpost but not the destination. They won't see your data. To make it work, you have to send them both the presentation and the Excel file, and they'll likely need to repair the link on their end.
If you need a presentation that's completely self-contained and just works, embedding is the way to go.
Can I Format My Excel Chart Inside PowerPoint?
You can, but I’d strongly advise against it for linked objects. While you can make small adjustments like resizing a chart inside PowerPoint, it's best to do all your heavy-lifting on formatting—like changing colors, fonts, or axis labels—directly in the original Excel file.
Why? Because the next time you refresh the data, PowerPoint pulls in not just the new numbers but all the formatting from the source file, too. Any tweaks you made in PowerPoint will probably get wiped out.
Think of Excel as your single source of truth for both the data and the design. It keeps things clean and consistent.
How Do I Stop My Data From Updating Automatically?
Sometimes you need to "freeze" your data for a report or a snapshot in time. In that case, you'll want to break the link.
It's pretty straightforward. Just head to File > Info, and look for the "Edit Links to Files" option. From there, you can select the link and break it. Once you do this, your chart or table becomes a simple, static picture in your presentation. It will no longer look for the original Excel file for updates.
Will My Embedded Excel File Slow Down My Presentation?
It certainly can. Embedding a large, complex Excel workbook will definitely increase your PowerPoint's file size. This can sometimes lead to slower load times or a bit of lag, especially on older machines.
To keep things snappy, a good rule of thumb is to only embed the specific worksheet you need, not the entire multi-tabbed workbook. If keeping the file size small is a top priority, linking is always the more lightweight choice.
Ready to make your data work feel less like work? Elyx.AI plugs right into Excel, letting you use AI to write formulas, build pivot tables, and clean up your data just by typing what you want in plain English. See how Elyx.AI can change the way you use Excel.
Reading Excel tutorials to save time?
What if an AI did the work for you?
Describe what you need, Elyx executes it in Excel.
Sign up