Decision Trees Excel: A Practical Guide to Building and Analyzing in Excel

You might think you need fancy, expensive software to map out complex choices, but that’s not always the case. Microsoft Excel is a surprisingly capable tool for building effective decision trees for business analysis and strategic planning. Its familiar grid and powerful functions make it a fantastic starting point for visualizing outcomes and weighing your options. This guide will provide you with practical, actionable steps to build and analyze decision trees in Excel, so you can leave with a new, valuable skill.
Why Excel Is Your Go-To for Decision Trees
When you’re staring down a complicated decision—like picking a new marketing strategy or deciding whether to fund a project—clarity is everything. A decision tree gives you a clear, visual map of your choices, the uncertainties you face, and where each path might lead. While specialized software certainly has its place, you’ll often find that building decision trees in Excel gives you the perfect mix of flexibility, accessibility, and analytical muscle.

Spending too much time on Excel?
Elyx AI generates your formulas and automates your tasks in seconds.
Sign up →The biggest advantage of Excel is that almost everyone already has it and knows their way around. This simple fact gets rid of the learning curve that comes with new software, letting you dive right into solving the problem. Of course, the more your team knows, the better. It’s always a good idea to help your team become Microsoft Excel experts to get the most out of it.
Understanding the Core Components
A decision tree is built from a few simple parts, and they’re all incredibly easy to create right in a spreadsheet. Each one has a specific job in laying out your analysis.
- Decision Nodes (Squares): These are your choice points. Think “Invest in Project A” versus “Invest in Project B.”
- Chance Nodes (Circles): These represent uncertainty—things you can’t control. For example, the market might experience “High Growth” (60% chance) or “Low Growth” (40% chance).
- End Nodes (Triangles or just the endpoint): This is the final outcome or payoff you get from following a specific path down the tree.
This whole structure maps beautifully onto Excel’s grid. You can use simple shapes, SmartArt, or just formatted cells to represent each node and draw lines for the branches.
The Analytical Advantage of Spreadsheets
But Excel isn’t just for drawing diagrams. Its real power comes from the numbers. You can plug values like costs, revenues, and probabilities directly into cells and then use formulas to automatically calculate the expected value for each decision branch. This transforms your visual map from a simple illustration into a dynamic, working model.
Pro Tip: Decision trees are a cornerstone of sound strategic thinking. By mapping choices and their potential outcomes, they provide a logical foundation for making informed, data-driven decisions under uncertainty. You can explore our guide on other powerful decision-making frameworks to expand your analytical toolkit.
Excel vs Specialized Software for Decision Trees
To help you decide when Excel is the perfect fit and when you might need a more advanced tool, here’s a quick comparison.
| Scenario | Recommended Tool | Reasoning |
|---|---|---|
| Quick, one-off analysis for a team presentation | Excel | It’s fast, familiar, and easy for others to understand without special training. |
| Building a highly complex, multi-layered model | Specialized Software | Dedicated tools are built to handle hundreds of nodes and complex probability distributions without performance issues. |
| You need to integrate the tree with other financial models | Excel | Nothing beats Excel for linking data across different sheets and workbooks. |
| Running advanced simulations (e.g., Monte Carlo) | Specialized Software | These tools often have built-in simulation and sensitivity analysis features that are difficult to replicate in Excel. |
Ultimately, for most business decisions, Excel provides more than enough power to get the job done right. It remains a critical data analysis tool in almost every organization, and its user-friendly nature makes it the most accessible choice for building your first—or your fiftieth—decision tree.
Building a Visual Decision Tree with SmartArt
When you need to walk a team through a complex decision, nothing beats a good visual. A well-designed diagram can make intricate choices feel instantly clear, and for that, Excel’s SmartArt feature is often the quickest way to get there. It’s a built-in tool that turns a simple text outline into a sharp, professional-looking diagram. If you need a presentation-ready visual without getting tangled up in formulas, this is the place to start.
Let’s use a common business dilemma as our example. Imagine your team is weighing whether to launch a new software feature. The whole decision really boils down to two big unknowns: how much will it cost, and will users actually adopt it? A decision tree is perfect for mapping this out.
Laying the Groundwork with a Hierarchy
First things first, pop open Excel and head to the Insert tab on the ribbon. You’ll see an option for SmartArt. Clicking it opens up a whole gallery of diagram types.
For our purposes, the Hierarchy category is what you want. A simple “Horizontal Hierarchy” layout is a great, clean starting point for a decision tree.
Once you pick a layout, a basic diagram will appear right on your spreadsheet, along with a text pane. This is where the magic happens.
Structuring Your Decision
Now it’s time to build out the logic. The text pane is your control panel; think of it like a bulleted list where each indentation creates a new branch on your tree. It’s surprisingly intuitive.
Here’s how to structure our software feature scenario:
- The Core Decision: The very first line in the text pane is your root node. Let’s call it “Launch New Feature?”
- Your Choices: Hit Enter, then Tab to indent. This creates your first branches. Label them “Launch” and “Do Not Launch.” These are your decision nodes—the paths you can actively choose.
- The Uncertainties: Under the “Launch” branch, we need to account for what we can’t control—user adoption. Indent again and add two sub-points: “High Adoption” and “Low Adoption.” These are your chance nodes, representing possible outcomes.
As you type this out, you’ll see the diagram build itself in real-time. The “Do Not Launch” path is the end of the line (it leads to $0 profit), so it doesn’t need any more branches.
Adding the Finer Details
By convention, decision trees use different shapes for different nodes: squares for decisions, circles for chance events. SmartArt lets you make this change easily. Just right-click on any shape in the diagram, go to Change Shape, and pick the one you need. It’s a small touch that makes your tree much clearer.
Now, let’s add the numbers that give the tree its meaning. You can type probabilities and financial outcomes right into the shapes via the text pane.
- For “High Adoption,” you might add text like (70% Chance, +$50k Profit).
- For “Low Adoption,” it could be (30% Chance, -$10k Loss).
A well-labeled decision tree does more than just show paths; it quantifies them. By adding probabilities and financial outcomes directly onto the diagram, you transform a simple flowchart into a powerful analytical tool that communicates risk and reward at a glance.
This manual approach with SmartArt is fantastic for visualizing and explaining a decision. Its main drawback is that it’s static—the numbers won’t update automatically if your assumptions change. For a more dynamic model, you’ll need to bring in formulas, which we’ll get into next. But for telling a clear, compelling story with your data, SmartArt is an unbeatable first step.
And if you’re looking to take your Excel visuals even further, it’s worth exploring techniques like creating 3D charts in Excel to add another layer of impact to your reports.
Creating a Dynamic Model with Excel Formulas
While drawing a decision tree with shapes is great for a PowerPoint slide, it’s not where the real work gets done. A static picture can’t help you weigh your options. To really get strategic with decision trees in Excel, you need to build a dynamic model using what Excel does best: formulas. This is how you turn a simple diagram into an interactive tool for what-if analysis.
Let’s dive into a more realistic business problem: a major capital investment. Imagine your company is weighing whether to build a new production facility. The decision is murky, clouded by things like variable costs, unpredictable market conditions (will it be strong, moderate, or weak?), and what your competitors might do. A formula-driven model is built for this kind of complexity. You can tweak one number and instantly see the ripple effect across your entire analysis.
Structuring Your Data for Success
Before you even think about writing a formula, you need to get organized. The secret is to create a clean, logical table for all your assumptions and variables. Think of this as the control panel for your decision tree. By keeping your inputs separate from your calculations, the whole model becomes far easier to understand, check for errors, and update later on.
Your input table should spell everything out clearly:
- Initial Investment Cost: The cash you need upfront.
- Market Probabilities: The chances of a strong, moderate, or weak market.
- Potential Revenues: How much you expect to make in each scenario.
- Variable Costs: The costs tied to each possible outcome.
Tucking these away in a dedicated spot on your worksheet (like cells A1:B10) is a pro move. It means any changes happen in one place, which helps prevent those sneaky errors from creeping into your formulas.
This visualization breaks down the basic flow of putting a decision tree together, from the initial decision points to the final calculated outcomes.
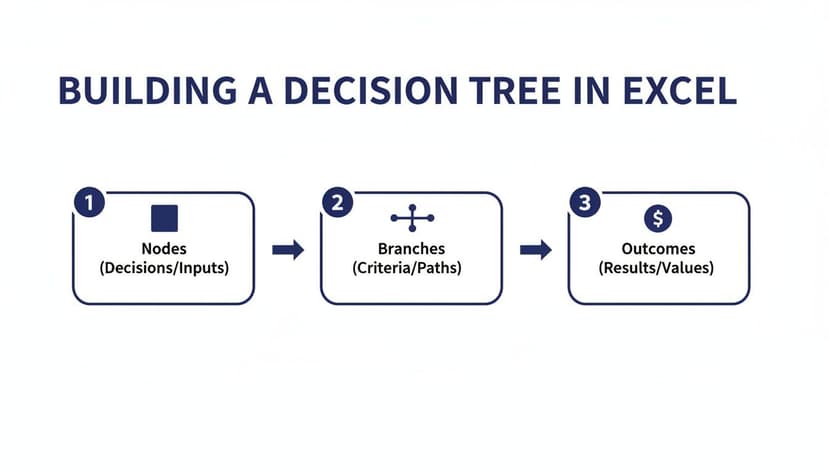
Following this simple Nodes → Branches → Outcomes structure keeps your model logical and easy for anyone to follow.
Calculating Expected Value with Core Formulas
Once your data is neatly structured, it’s time to build the engine of your decision tree. The main goal here is to calculate the Expected Value (EV) for every possible path. EV is a weighted average that helps you compare uncertain outcomes. You find it by multiplying each outcome’s value by its probability and then adding up all the results.
The SUMPRODUCT formula is perfect for this. It’s practically tailor-made for calculating EV, multiplying items in arrays and summing the results in one go.
For instance, let’s say your potential profits are in cells C2:C4 (e.g., $100,000, $50,000, -$20,000) and their respective probabilities are in D2:D4 (30%, 50%, 20%). The formula for the Expected Value is simply:
=SUMPRODUCT(C2:C4, D2:D4)
Formula Breakdown:
C2:C4: This is the first array, containing the financial outcomes.D2:D4: This is the second array, containing the probabilities for each outcome.SUMPRODUCTmultiplies the corresponding elements of these arrays (C2*D2,C3*D3,C4*D4) and then adds them all together.
This one elegant formula does all the heavy lifting—no need for a clunky (C2*D2) + (C3*D3) + (C4*D4). It’s cleaner and much less prone to error.
Weaving Logic with Nested IF Statements
Decision trees are fundamentally about conditional logic: if this happens, then that’s the result. In Excel, the IF function is your best friend for building this logic right into your cells. For more complex branches with multiple conditions, you can “nest” IF statements inside one another.
For example, imagine you are deciding between two marketing campaigns, “Campaign A” and “Campaign B”. The success depends on market response, which can be “High” or “Low”. You can model the final return with a nested IF statement. Let’s assume your decision is in cell A1 and the market response is in A2.
=IF(A1="Campaign A", IF(A2="High", 150000, 40000), IF(A2="High", 120000, 60000))
Formula Breakdown:
IF(A1="Campaign A", ...): The firstIFchecks which campaign was chosen...., IF(A2="High", 150000, 40000), ...): IfA1is “Campaign A”, this nestedIFchecks the market response. It returns150000for “High” and40000for “Low”...., IF(A2="High", 120000, 60000)): IfA1is not “Campaign A” (meaning it’s “Campaign B”), thisIFfunction runs, returning120000for a “High” response and60000for “Low”.
If you’re looking to get better at this, using an AI-powered formula generator can be a huge help, offering guidance and speeding up the process.
Key Takeaway: The real magic of a formula-based decision tree is its interactivity. When you link all your calculations back to that central input table, you create a powerful tool for sensitivity analysis. Change a probability from 30% to 40%, and watch every related EV update instantly. You see the new optimal decision right away, no rebuilding required.
This formula-driven approach has a massive impact in the real world. In high-stakes industries like finance, decision trees are indispensable for assessing risk and shaping investment strategies. By taking the time to create a dynamic model, you’re not just drawing a decision—you’re building a robust analytical machine that helps you test assumptions, quantify risk, and make smarter, data-driven choices.
Taking Your Analysis to the Next Level with Scenario Manager and Solver
Building a formula-driven decision tree is a huge step forward, but let’s be honest—the real world rarely sticks to one script. A single set of probabilities and outcomes gives you a single, static answer. What happens if the market tanks? Or if a new competitor enters the scene? This is where we move past simple calculations and start playing out different futures with some of Excel’s most powerful tools.
Instead of plugging in new numbers over and over, you can use Excel’s Scenario Manager to save and compare different sets of assumptions. Think of it as creating multiple “what-if” universes—an optimistic one, a pessimistic one, and a realistic one—to see how your decision holds up under pressure.
This kind of structured analysis is becoming more and more essential. The market for decision-making apps, which includes tools for building decision trees, is expected to hit $3.7 billion by 2033. It’s a clear sign that businesses everywhere need robust ways to look at problems from every angle. If you’re curious about the industry trends, you can read more about these decision-making market insights to see how things are evolving.
Setting Up Scenarios to Stress-Test Your Model
You can find Scenario Manager right on the Data tab, tucked inside the What-If Analysis menu. The whole idea is to tell Excel which of your input cells are variables and then save different versions of them as named scenarios.
Let’s go back to our capital investment example. The numbers you’re probably least certain about are:
- The probability of a strong market.
- The potential revenue you’d get in a weak market.
- The initial investment cost itself.
You could create a ‘Pessimistic’ scenario by dropping the strong market probability to just 10%, bumping up your costs, and slashing the revenue forecast. On the flip side, an ‘Optimistic’ scenario might have a 70% chance of a strong market with much better financial figures.
Once you have these defined, you can switch between them with a click. Excel instantly re-calculates your entire decision tree, showing you the new Expected Value (EV) for each choice. It’s incredibly fast.
Pro Tip: The Scenario Summary Report is the real magic here. After you’ve defined your scenarios, Excel can generate a brand new sheet that lays out the results in a clean, side-by-side table. This makes it incredibly easy to see how the best decision changes under different conditions and is perfect for presenting your findings to your team or stakeholders.
Finding the Absolute Best Outcome with Solver
Scenario Manager is great for comparing a few pre-defined situations. But what if you need to find the optimal answer? For instance, what’s the exact marketing budget that will maximize your project’s EV without blowing past your spending limit? For that, we need to bring in the heavy hitter: the Solver add-in.
Solver is a powerful optimization tool that adjusts your inputs to achieve a specific goal. If you don’t see it on your Data tab, you can easily enable it through File > Options > Add-ins.
To use Solver, you just need to frame your problem with three key pieces of information:
- Set Objective: This is the cell you want to influence—in our case, the final EV of your decision tree, which we want to maximize.
- By Changing Variable Cells: These are the knobs Solver is allowed to turn. This could be your marketing spend, resource allocation, or any other input you control.
- Subject to the Constraints: These are the rules of the game. You could, for example, add a constraint that the marketing budget cell must be less than or equal to your total available budget.
Once you click “Solve,” the tool crunches through countless possibilities to find the combination of inputs that gets you the best result while respecting your rules. It’s like automating the search for the perfect strategy. While Solver is built for complex optimization, if your goal is just to find an input that hits a specific target, our guide on how to use Goal Seek in Excel might be just what you need.
By layering Scenario Manager and Solver on top of your formula-driven model, your decision trees in Excel become more than just a static map. They become a dynamic lab where you can test strategies, challenge assumptions, and uncover the most resilient path forward.
Let an AI Assistant Do the Heavy Lifting
While it’s great to know how to build dynamic models with formulas and scenarios, let’s be honest—it can be a real grind. Getting the data structured just right, wrestling with nested IF statements, and double-checking SUMPRODUCT calculations takes a ton of time and focus. This is where an AI assistant comes in, changing a meticulous manual task into a quick, automated process right inside Excel.

Modern AI tools that plug into Excel, like Elyx AI, work like an expert sitting next to you. Instead of building everything by hand, you just tell the AI what you need in plain English. This simple shift drastically reduces your workload and pretty much eliminates the chance of a stray typo messing up your entire model.
From a Simple Prompt to a Full Decision Tree
Picture this: you have a table with all your data—the choices, outcomes, probabilities, and payoffs. Instead of blocking out the next hour to build your tree, you could give a single command to an AI assistant. This is the new, faster way to work with decision trees in Excel.
You could type a prompt as straightforward as this:
“Create a decision tree from the data in A1:D10. Calculate the Expected Monetary Value (EMV) for each main decision, highlight the best option, and then make a SmartArt graphic of the tree.”
A smart AI can take that request and knock out every single step. It will set up the calculations, write the formulas to find the EMV, and even build the visual diagram for you. All in just a few seconds.
This approach keeps you focused on the big picture—the strategy—instead of getting lost in the weeds of technical setup. If you’re interested in going further, our guide on how to automate repetitive tasks in Excel has even more ideas.
Your New Analytical Partner
An AI assistant doesn’t just stop at building the tree. It can also help you make sense of the results. It can summarize the key takeaways in clear language, pointing out the best path forward and explaining why it’s the optimal choice. This is a game-changer when you need to present your findings to people who don’t live and breathe spreadsheets.
For instance, after the tree is built, you could ask a follow-up question:
“Give me a short summary explaining why ‘Invest in Project A’ is the right call based on the EMV.”
The AI will generate a concise, data-driven explanation, saving you from having to write it up yourself. It makes complex analysis feel more like a conversation.
Speeding Up the Whole Process
The benefits of AI go way beyond the decision tree itself. We all know the most tedious part of any analysis is often just getting the data ready. AI can help with those initial steps, too, like leveraging AI for data preparation and analysis to automate your entire workflow.
With an AI assistant on hand, you can speed through these preliminary tasks:
- Data Cleaning: Just ask the AI to find and zap duplicates, fix weird formatting, or fill in blank cells in your source data.
- Data Structuring: Tell it to organize your messy notes into a proper table that’s ready for analysis.
- Sensitivity Analysis: Prompt the AI to create a data table to test how the EMV changes if a key probability shifts. What used to be a manual setup is now done in seconds.
This kind of end-to-end automation is changing how we work with data. By handing off the mechanical tasks to an AI, you get back your time and brainpower to focus on what humans do best: making smart, evidence-based decisions.
Frequently Asked Questions
Even after walking through a detailed guide, a few specific questions often pop up when you’re in the weeds building a decision tree in Excel. Let’s tackle some of the most common ones I hear, clearing up any lingering confusion so you can get back to your analysis.
Can I Build a Machine Learning Decision Tree in Excel?
This is a great question, and the short answer is no, not in the traditional machine learning sense. Excel is fantastic for creating the kind of decision trees we’ve discussed here—visual models for strategic planning where you map out choices, probabilities, and outcomes.
However, it’s not built for running machine learning algorithms like CART or C4.5. Those methods require training a model on massive datasets to uncover hidden patterns, which is really the domain of programming languages like Python (using its scikit-learn library) or R. Think of Excel as a tool for modeling knowns, not for machine-driven discovery.
What Is the Biggest Limitation of Using Excel?
Hands down, the biggest challenge you’ll face is scalability. When you’re dealing with just a few branches, Excel works beautifully. But as your tree gets more complex, the visual diagram becomes a tangled mess, and the nested formulas can get incredibly difficult to troubleshoot.
Trying to manage a tree with dozens of nodes is not only a headache but also a recipe for errors. One wrong reference in a deep formula can throw off your entire analysis.
The real pain point is the manual effort. If you need to update a few inputs across a large, complex model, it’s tedious and slow. While powerful features like Solver exist, they can bog down on larger models, which is when dedicated decision analysis software starts to look a lot more appealing.
How Do I Handle Uncertain Probabilities in My Model?
This is where Excel really shines. When you’re not 100% confident in your probability estimates, you need to run a sensitivity analysis, and Excel has the perfect tools for it.
Your best bets are the Scenario Manager or Data Tables. You can easily set up a few different versions of reality:
- An “optimistic” case
- A “pessimistic” case
- Your “most likely” scenario
By plugging these different probability sets into your model, you can instantly see how sensitive your final decision is to those initial guesses. It’s a fantastic way to understand the risk profile of your strategy and identify the point at which a different path becomes the better choice.
Ready to stop wrestling with formulas and start getting instant insights? Elyx AI is your autonomous colleague inside Excel. It builds your reports, cleans your data, and creates your charts from a single instruction, saving you hours of tedious work. Start your free 7-day trial and see the magic for yourself.
Reading Excel tutorials to save time?
What if an AI did the work for you?
Describe what you need, Elyx executes it in Excel.
Sign up