How to Build a Flawless DCF Model in Excel From Scratch

A Discounted Cash Flow (DCF) model is one of the most powerful tools in finance. At its core, it’s a method for determining a company's current value by forecasting its future cash generation. Building a dcf model in excel allows you to project a company's financial performance, discount those future earnings back to their present value, and arrive at a solid estimate of its intrinsic worth. This guide will provide a practical, step-by-step approach to help you master this cornerstone valuation technique.
Why Excel Is Essential for DCF Modeling
When it comes to building a professional-grade DCF model, Excel remains the undisputed industry standard. While specialized software exists, nothing offers the flexibility, control, and universal accessibility of a spreadsheet. Its grid-based layout is perfectly suited for organizing financial statements and forecasts in a clear, logical structure that is easy to build and audit.
Spending too much time on Excel?
Elyx AI generates your formulas and automates your tasks in seconds.
Sign up →The primary goal of a DCF analysis is to project performance years into the future, requiring a deep understanding of the business and the ability to test different scenarios. Excel puts you in complete control of every assumption and calculation. This transparency is critical for understanding the key drivers of a company's value, a feature often missing in "black box" financial software.
The Power of Formulas and Functions
What truly makes a DCF model effective in Excel is its vast library of built-in functions. Tools like NPV (Net Present Value) and XNPV are designed specifically for this type of financial analysis, simplifying the process of discounting future cash flows. For instance, to find the present value of a series of future cash flows, you can use a formula like:
=NPV(discount_rate, cash_flow_range)
discount_rate: This is your WACC (Weighted Average Cost of Capital), which we'll cover later. It represents the rate at which you discount future earnings.cash_flow_range: This is the series of cells containing your projected free cash flows for each year.
This function efficiently calculates the sum of all discounted cash flows, saving you from complex manual calculations. Additionally, features like Data Tables are indispensable for sensitivity analysis, allowing you to see how your valuation changes when you adjust key assumptions like the growth rate or discount rate.
Integrating AI for Enhanced Productivity
The world of financial modeling in Excel is being transformed by artificial intelligence. AI add-ins, such as Elyx AI, function as an intelligent assistant directly within your spreadsheet, automating the tedious and repetitive tasks that can bog down the valuation process.
A well-built DCF model tells a story about a company's future. Excel provides the canvas, your assumptions paint the picture, and AI tools help you paint faster and with greater precision.
Imagine generating a five-year revenue forecast with a simple text command or instantly creating a sensitivity analysis chart without navigating complex menus. This is now a reality. AI doesn't replace the critical thinking required for a robust valuation; it streamlines the process so you can focus on what truly matters. By handling the mechanical work, these tools free you up to concentrate on strategic analysis, challenging assumptions, and ultimately, making better-informed decisions.
To get a better sense of how AI can change your day-to-day spreadsheet tasks, check out these Excel use cases powered by AI.
Setting the Stage: Nailing Down Your Key DCF Model Assumptions
Any credible valuation model is built on a foundation of solid, defensible assumptions. These assumptions are the narrative behind the numbers. Without them, your DCF model in Excel is merely a collection of calculations; with them, it becomes a powerful story about a company's potential future.
Getting these assumptions right is arguably the most critical part of the entire process. It’s where you blend quantitative analysis with qualitative judgment—digging into historical data while also layering in your understanding of the industry, competitive landscape, and broader economic outlook. A model with weak assumptions will produce a precise-looking but ultimately useless valuation.
Sourcing and Justifying Your Core Inputs
So, where do you begin? The objective is to build a credible forecast, which means you cannot rely solely on the company's past performance. You need to synthesize information from various sources to construct a complete and defensible picture.
Here are the five key assumptions you must establish:
- Revenue Growth Rates: Start by analyzing the company's sales growth over the past 3-5 years. Then, contextualize this data. How does it compare to the industry average? Is the market expanding, and is the company gaining or losing market share?
- Operating Margins: Examine historical EBIT margins. Are they stable, improving, or declining? It is crucial to benchmark these against key competitors to assess whether the company's profitability is sustainable.
- Tax Rates: Use the company’s recent effective tax rate as a baseline. However, always remain vigilant for potential changes in corporate tax legislation that could impact future projections.
- Capital Expenditures (CapEx): A common method is to analyze CapEx as a percentage of sales. Is the company in a heavy investment phase to fuel growth, or is it a mature business focused on maintenance spending? Management commentary on earnings calls can be an invaluable source for this information.
- Changes in Net Working Capital: This reflects the cash required to fund day-to-day operations and growth. Analyze historical trends in receivables, payables, and inventory to project how much cash will be tied up as the company expands.
Before you begin building out your financial model, it's essential to gather these inputs. The following table summarizes what you need and why it's important.
Key DCF Model Input Assumptions
| Assumption | Description | Common Source / Driver | Impact on Valuation |
|---|---|---|---|
| Revenue Growth Rate | The projected annual increase in the company's sales over the forecast period. | Historical growth, industry reports, analyst estimates, management guidance. | High: Drives higher FCF and terminal value, increasing valuation. |
| EBIT Margin | Earnings Before Interest and Taxes as a percentage of revenue; a measure of core profitability. | Historical margins, peer company analysis, operational efficiency plans. | High: Increases operating profit and cash flow, boosting valuation. |
| Tax Rate | The effective corporate tax rate applied to pre-tax profit. | Company's historical effective rate, statutory federal and state rates. | Low: Less cash paid in taxes means higher FCF, increasing valuation. |
| Net Working Capital | The investment in short-term assets (like inventory) needed to support sales growth. | Historical ratios (e.g., DSO, DIO, DPO), industry norms. | Low: Efficient management means less cash tied up, increasing FCF. |
| CapEx % of Sales | Capital expenditures as a percentage of revenue, reflecting investment in assets. | Historical spending patterns, company's growth phase, maintenance needs. | Low: Less cash spent on assets leaves more free cash flow, raising valuation. |
Establishing these assumptions correctly from the outset will prevent future complications and enhance the credibility of your final valuation.
Why You Absolutely Need a Dedicated Assumptions Tab
Here is a non-negotiable best practice: place all your assumptions on a separate, dedicated tab in Excel. Never hard-code values like a 5% growth rate directly into a formula within your main financial model.
By centralizing all your key drivers on an 'Assumptions' tab, you create a single source of truth. This simple habit makes your model clean, easy to audit, and incredibly powerful for running scenarios.
This practice is about more than just organization; it's about building a flexible and transparent tool. When a colleague or client asks, "What happens if growth is 2% lower?" you can change a single cell and watch the entire valuation update instantly. This transforms your model from a static report into a dynamic instrument for strategic decision-making.
Of course, your projections are only as good as the historical data they’re based on. Before building out assumptions, make sure your source data is clean. If you're wrestling with messy datasets, it might be worth looking into some modern tools for AI-powered data cleaning in Excel to ensure you’re starting with a reliable foundation.
Forecasting Free Cash Flow in Your Spreadsheet
With your core assumptions established, it's time to build the heart of the DCF model in excel: projecting the company's future performance. In this section, we will construct a 5-year forecast to calculate the Unlevered Free Cash Flow (UFCF). UFCF represents the raw, operational cash a business generates before considering any financing decisions. It is the purest measure of its earning power.
Forecasting UFCF is a logical, step-by-step process. We begin with the company's operating profit and make a series of adjustments. Each adjustment serves to bridge the gap between the income statement's reported profit and the actual cash available to all capital providers—both lenders and shareholders.
Your inputs for this model won't come out of thin air. They are a blend of the company's own history, current industry trends, and the broader economic climate.
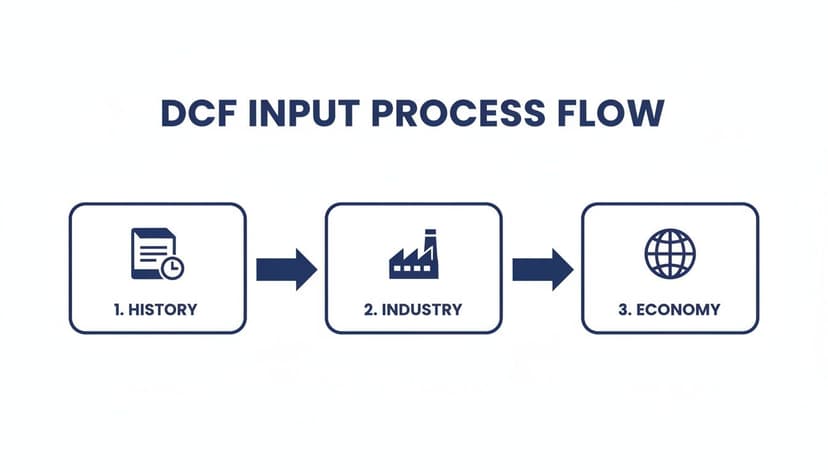
A solid forecast is always built on a foundation of comprehensive analysis, not just a simple extrapolation of last year's numbers.
Calculating NOPAT: The Starting Point
First, we calculate Net Operating Profit After Tax (NOPAT). This metric reveals the profitability of a company's core operations, assuming it had no debt. This standardizes the metric, making it easier to compare companies with different capital structures.
Calculating NOPAT in Excel is straightforward. You take the EBIT projected from your assumptions and apply the tax rate.
- Formula:
=EBIT_Cell * (1 - Tax_Rate_Cell) - Explanation:
EBIT_Cellrefers to the cell containing your projected Earnings Before Interest and Taxes for a given year.Tax_Rate_Cellpoints to the tax rate you defined on your assumptions tab. This calculation effectively removes the tax benefit of debt from the equation, giving you a pure measure of operational profit.
This number is the bedrock of your UFCF calculation.
Adding Back Non-Cash Charges
Next, we must add back expenses that were deducted for accounting purposes but did not involve an actual cash outflow. The most significant of these is Depreciation and Amortization (D&A).
While D&A is a legitimate expense reflecting the use of assets over time, it is a non-cash charge. We add it back to NOPAT because it reduced our taxable income (and thus our tax payment) without consuming any cash in the current period. In your model, you will simply link to the D&A figure you projected on your assumptions tab.
Accounting for Reinvestments in the Business
A growing company must reinvest cash back into the business to support its expansion. These reinvestments reduce the cash available to investors, so we subtract them to arrive at true free cash flow. This occurs in two primary ways:
- Capital Expenditures (CapEx): This is cash spent on long-term assets like property, machinery, and equipment. We subtract the projected CapEx from our cash flow.
- Changes in Net Working Capital (NWC): As sales increase, a company typically needs to invest more cash in items like inventory and accounts receivable. This increase in NWC is a cash outflow, so we subtract the year-over-year increase from our calculation.
A critical piece of any DCF model is getting the cash flow projections right. This means going beyond revenue and expenses to truly understand how investments in assets and working capital affect the cash available to investors. For a deeper look, especially if you're analyzing service-based businesses, it’s worth exploring resources on mastering cash flow projections.
These UFCF forecasts are the standard in corporate finance. A Deloitte benchmark report found that 92% of CFOs in the US and Europe rely on Excel DCF models for M&A valuations. These analyses often hinge on 5-year UFCF forecasts, typically discounted at a WACC between 8-10%. The significance of this analysis was evident in major deals like the $69 billion Microsoft-Activision merger, where DCF analysis supported 65% of the fairness opinion.
Once you have all the components, the formula for Unlevered Free Cash Flow is:
UFCF = NOPAT + D&A – CapEx – Change in NWC
By building this calculation for each year of your forecast, you will create the stream of future cash flows that forms the basis of your company's intrinsic value. If you're struggling to write out the formulas for these moving parts, you can get help to create complex Excel formulas with AI support.
Calculating WACC and Terminal Value
Once you have your cash flow projections laid out, you’re ready for the next crucial step: determining what those future dollars are worth today. To do that, we need two key inputs for our dcf model in excel: the discount rate, known as the Weighted Average Cost of Capital (WACC), and the Terminal Value.
WACC represents the company's blended cost of capital from all sources—both lenders and shareholders. The Terminal Value is an estimate of the company's worth beyond the explicit forecast period, based on the principle that a business is a going concern.
Nailing Down the WACC
The WACC calculation combines the cost of a company's two primary funding sources: equity (the return shareholders expect) and debt (the interest the company pays). The formula is a weighted average of these two costs.
Here’s what goes into the mix:
- Cost of Equity (Re): Typically calculated using the Capital Asset Pricing Model (CAPM). This model starts with a risk-free rate (e.g., a U.S. Treasury bond yield), adds a market risk premium, and adjusts this figure by the stock's volatility, or "beta."
- Cost of Debt (Rd): This is the interest rate the company pays on its debt. It is crucial to use the after-tax cost, as interest payments are tax-deductible, creating a "tax shield" that lowers the effective cost.
- Market Value of Equity (E) and Debt (D): These are the weights. You calculate the proportion of the company's total value (V = E + D) that comes from equity versus debt.
In your Excel sheet, the formula will pull from cells containing these inputs:
= (E/V * Re) + (D/V * Rd * (1 - Tax_Rate))
E/VandD/Vare the weights of equity and debt in the capital structure.Reis the cost of equity.Rd * (1 - Tax_Rate)is the after-tax cost of debt.
This calculation is critical, as even a small change in WACC can significantly impact the final valuation.
Estimating the Terminal Value
Realistically, no one can accurately predict a company's cash flows to infinity. This is where Terminal Value comes in. It represents an estimate of the company's value at the end of your explicit forecast period (e.g., year 5) and beyond. There are two common methods for this calculation.
The Terminal Value can often account for over 70% of a company's total estimated worth in a DCF analysis. This means the assumptions you make here are incredibly important and deserve careful consideration.
The first method is the Gordon Growth Model (GGM), also known as the perpetuity growth method. This approach is best suited for mature, stable companies with predictable, slow growth.
It assumes that free cash flows will grow at a small, steady rate forever. This perpetual growth rate (g) must be conservative, typically in line with or below long-term GDP growth (around 2-3%).
The Excel formula is:= (Final_Year_FCF * (1 + g)) / (WACC - g)
The second option is the Exit Multiple Method. This is often more practical for companies in cyclical industries or for high-growth businesses where assuming a stable growth rate is unrealistic. It works by assuming the company is "sold" at the end of the forecast period.
To calculate it, you apply a reasonable valuation multiple (like EV/EBITDA) to your final year's financial metric. The key is to select a multiple that reflects the trading values of similar public companies.
Your Excel formula would be:= Final_Year_EBITDA * Exit_Multiple
The choice between these methods depends on the company being analyzed. For a stable, mature business, the Gordon Growth Model is appropriate. For a dynamic tech company, an exit multiple based on current market conditions is likely more realistic.
If you ever find yourself wrestling with how to structure these formulas correctly in your sheet, tools like an AI formula generator for Excel can be a real lifesaver and help get it done in seconds.
Valuation and Running a Sensitivity Analysis
This is the final step where all your work culminates. The projections, WACC, and Terminal Value are now used to calculate the company's intrinsic value. The goal is to discount all future cash flows back to their present value.
From Cash Flows to Enterprise Value
First, we will discount the Unlevered Free Cash Flows (UFCFs) from your forecast period (typically years 1-5). Excel's NPV function is perfect for this. Note that despite its name, the NPV function calculates the present value of a series of cash flows, which is exactly what we need.
- The Formula:
=NPV(WACC_Cell, Range_of_UFCF_Cells) - Explanation: This formula instructs Excel to take the series of projected cash flows (
Range_of_UFCF_Cells) and discount each one using theWACC_Cellyou calculated earlier, then sum them up.
Next, we must discount the Terminal Value. Since this is a single lump sum at the end of the forecast period (e.g., year 5), we use a standard present value formula.
- The Formula:
=Terminal_Value_Cell / (1 + WACC_Cell)^Number_of_Periods
Adding these two present values together gives you the company’s Enterprise Value (EV). This represents the total value of the company’s core business operations, attributable to all capital providers.
Bridging to Equity Value
While Enterprise Value is a key metric, equity investors are primarily concerned with the value attributable to shareholders—the Equity Value. To get from EV to Equity Value, we make a few logical adjustments.
Think of it as if you were buying the entire company. The Enterprise Value is the price for its operations, but you would also assume its debt. To find the value for shareholders, you must:
- Subtract Net Debt: Net Debt is the company's Total Debt minus its Cash and Cash Equivalents. We subtract debt because a new owner must pay it off, but we add back cash because it is a non-operating asset that ultimately belongs to shareholders.
The final step is: Equity Value = Enterprise Value – Net Debt. Divide this Equity Value by the number of shares outstanding to arrive at your implied share price.
Why a Single Number Is Never Enough
Arriving at a single valuation figure is a milestone, but a professional-grade dcf model in excel should not stop there. Your result is highly sensitive to your initial assumptions. What if revenue growth is slower than expected? What if interest rates rise, increasing your WACC?
This is why sensitivity analysis is not just an optional extra—it's essential. You must systematically vary your key assumptions to see how they impact the final valuation. This process transforms your spreadsheet from a static calculation into a dynamic decision-making tool.
The real power of a DCF model isn't the single answer it produces, but the range of possible outcomes it reveals. Sensitivity analysis helps you understand the key drivers of value and the potential risks in your investment thesis.
Excel has a fantastic feature called a Data Table (found under the Data tab in the "What-If Analysis" dropdown) designed for this purpose. It lets you build a two-variable table to see, for instance, how your implied share price changes as both your WACC and perpetual growth rate fluctuate.
Getting this right is critical. A PwC survey found that simple errors in these tables led to 15% valuation differences when growth assumptions shifted from a 2.5% GDP proxy to a 1.5% recession scenario. You can learn more about these findings on discounted cash flow modeling here.
This analysis provides a clear map of your valuation under different economic scenarios, giving you a defensible range of values and a deeper understanding of which assumptions most significantly impact your investment case.
Using AI to Accelerate Your DCF Modeling
Building a robust dcf model in excel from scratch is an invaluable learning experience, but it is also filled with repetitive, time-consuming tasks. Projecting line items, debugging complex formulas, and linking everything together can bog you down in mechanics, leaving less time for high-value analysis.
This is where a smarter workflow, enhanced by an AI assistant integrated into your spreadsheet, can make a significant difference.
Imagine simply typing what you need in plain English and watching the correct formulas appear instantly. This is the new reality of financial modeling.
Automating Tedious Tasks with Simple Prompts
AI tools like Elyx AI act as an expert partner, handling the manual work so you can focus on the bigger picture. Instead of painstakingly writing and linking formulas, you can issue direct commands.
Consider how AI can automate common bottlenecks in DCF modeling:
- Generating Projections: Instead of dragging formulas, just ask, "Project revenue for the next 5 years starting in cell C5, using a 4% annual growth rate." The AI instantly builds the formula series for you.
- Handling Complex Calculations: Need to calculate the present value of your terminal value? A simple prompt like, "Discount the value in cell H10 back 5 years using the WACC in cell B12," gets it done correctly, without syntax errors.
- Visualizing Data: Once the calculations are complete, you can instruct the AI to "Create a bar chart comparing the projected UFCF for each year" to get an immediate visualization of your forecast.
This isn't about replacing your analytical skills; it's about amplifying them. When you cut out hours of tedious formula writing and formatting, you free up mental energy to actually challenge assumptions and dig into what the results mean.
Moving from Mechanics to Strategic Insights
The true power of integrating AI into your DCF workflow is the speed it brings to scenario and sensitivity analysis. Manually setting up data tables or adjusting multiple assumptions is a slow process. With an AI assistant, you can test different scenarios on the fly, making your analysis more dynamic and thorough.
This shift allows you to spend less time building the model and more time using it as a strategic tool. The model itself is just one piece of the puzzle. Understanding the broader market context is also critical. For instance, knowing who the top Artificial Intelligence investors are can provide strategic insight into how technology is influencing valuation methods across different sectors.
Ultimately, using AI in Excel transforms the modeling process from a manual grind into a strategic exercise, ensuring your decisions are driven by deep analysis rather than tedious calculations. To see more, find out how an AI assistant in Excel can completely change how you work.
Answering Your Top DCF Modeling Questions
Once you move from theory to practice, building your first DCF model in Excel is bound to bring up some questions. It's one thing to know the formulas, but it's another thing entirely to apply them in a real-world spreadsheet. Let's walk through some of the most common sticking points I see analysts run into.
How Long Should the Forecast Period Be?
A classic question is how far out to project a company's financials. You'll often hear five years as the standard, and for a good reason—it works well for stable, mature businesses. But this isn't a one-size-fits-all rule.
If you're analyzing a high-growth tech startup or a company in a volatile industry, five years might not be enough to capture its true trajectory. For these situations, extending the forecast to seven or even ten years often makes more sense. You need to give the company enough time to reach a "steady state" of growth before you apply a terminal value.
Do I Need to Project Every Single Line Item?
Another thing that trips people up is the level of detail. Do you really need to forecast every expense line from the income statement? Absolutely not. The key is to focus on the things that actually drive the company's value.
You definitely want detailed, well-researched assumptions for the big stuff: revenue, cost of goods sold (COGS), and capital expenditures. For the less critical items, you can take a simpler approach:
- Bundle smaller expenses: Things like miscellaneous administrative costs can be grouped into a single "Other SG&A" line and projected as a simple percentage of revenue.
- Think in terms of materiality: My rule of thumb is if an item is consistently less than 1-2% of revenue, a simple growth assumption will do just fine.
Remember, the point of a DCF model isn't to build a perfect replica of a company's accounting department. It's about understanding the core economic engine of the business to land on a sensible valuation. Always keep your attention on the levers that have the biggest impact on cash flow.
Why Do We Use Unlevered Free Cash Flow (UFCF)?
Finally, a lot of people wonder why we go through the trouble of calculating Unlevered Free Cash Flow (UFCF) instead of just using cash flow to equity. Using UFCF gives you a valuation of the entire enterprise, completely separate from how it’s financed.
This is crucial because it allows you to make apples-to-apples comparisons between companies with different debt levels. It’s also the standard for M&A work, where the acquirer will likely change the company's capital structure after the deal closes. It just gives you a cleaner, more fundamental picture of the business's intrinsic value.
Ready to stop wrestling with complex formulas and start focusing on strategic insights? Elyx AI is an AI-powered Excel add-in that automates your most tedious tasks, from building projections to creating charts, all from simple text prompts. Start your free 7-day trial and build your next DCF model in record time.
Reading Excel tutorials to save time?
What if an AI did the work for you?
Describe what you need, Elyx executes it in Excel.
Sign up