A Step-By-Step Guide to Building a DCF Model in Excel

At its core, a Discounted Cash Flow (DCF) model is all about figuring out what a business is worth today based on the cash it’s expected to generate in the future. It’s a forward-looking valuation method that shifts the focus from past performance to future potential.
The central question it answers is simple: What is the total value of all the cash this business will produce from now on, translated into today's dollars? This guide will walk you through how to build a practical DCF model from scratch using Microsoft Excel, showing you the key formulas and concepts needed to solve this valuation puzzle.
What Is a DCF Model and Why Does It Matter in Excel?
Think about buying a small apartment building. You wouldn't value it just on the cost of the bricks and mortar. The real value lies in all the future rent checks you expect to collect. But here's the catch: a dollar you'll get five years from now isn't worth the same as a dollar in your hand today. That's because of inflation and risk—the time value of money.
Spending too much time on Excel?
Elyx AI generates your formulas and automates your tasks in seconds.
Sign up →A DCF model applies this exact same logic to a business. It calculates the company's "intrinsic value" by forecasting all its future cash flows and then "discounting" them back to what they're worth in the present, a process perfectly suited for an Excel spreadsheet.

This process forces you to get your hands dirty and really think about the fundamental drivers of the business:
- Revenue Growth: How fast can the company realistically grow its sales?
- Profitability: What kind of profit margins can it sustain over the long haul?
- Capital Investments: How much money needs to be plowed back into the business just to keep it growing?
By answering these questions, you can estimate the company's free cash flow—the actual cash left over for investors after all business expenses and investments are paid.
The Power of a Forward-Looking Perspective
Most valuation methods look backward, relying on historical earnings or what similar companies are worth. A DCF, on the other hand, is built entirely on the company's operational future. This makes it a crucial tool for anyone making a serious financial decision, from investors to CEOs.
A DCF analysis is all about finding the intrinsic value of a business. This is the present value of all the future cash the company is expected to generate for its shareholders. If that intrinsic value is higher than the current stock price, you might just have a good investment on your hands.
This future-focused approach is particularly useful for valuing companies where today's profits don't paint the full picture, like fast-growing tech startups or businesses in a turnaround. The same logic is used to calculate rental property value, where future income is everything.
To give you a clearer picture, let's quickly summarize the key pieces that go into building a DCF model.
Key Components of a DCF Model at a Glance
This table breaks down the essential inputs and the key outputs of any solid DCF analysis.
| Component Type | Component Name | Description |
|---|---|---|
| Input | Revenue Projections | An estimate of a company's future sales growth over a specific period (usually 5-10 years). |
| Input | Free Cash Flow (FCF) | The cash a company generates after accounting for all operating expenses and capital expenditures. |
| Input | Discount Rate (WACC) | The rate used to convert future cash flows into their present-day value, reflecting the risk of the investment. |
| Input | Terminal Value | An estimate of the company's value beyond the initial forecast period, assuming stable growth. |
| Output | Enterprise Value | The total present value of all future cash flows, representing the company's entire worth. |
| Output | Equity Value | The value available to shareholders after subtracting debt and adding cash from the Enterprise Value. |
| Output | Intrinsic Value per Share | The final calculated value for a single share, found by dividing Equity Value by the number of shares. |
As you can see, a DCF model is a mix of forecasting, financial calculation, and strategic assumptions—all of which can be managed effectively in Excel.
Growing Adoption in Global Markets
The DCF model isn't just a Wall Street favorite; its influence is spreading. In Europe, it has seen a huge surge in popularity, especially within the real estate sector. As global investment becomes more standardized, the DCF has emerged as a preferred valuation method, much like it has been in the US for years.
In fact, industry surveys reveal that its use among European real estate funds has jumped by over 30% recently, which speaks volumes about its credibility. This global shift really highlights the model's power for making smart, data-driven investment decisions anywhere in the world.
How to Forecast Free Cash Flow in Excel
At the absolute core of any dcf model is Free Cash Flow (FCF). Think of it as the real cash a business generates after covering all its operating expenses and investing in its own future. It's the money left on the table that could, in theory, be handed back to its investors.
Unlike net income, which can be influenced by accounting rules, FCF is about tangible cash. That’s why getting your FCF forecast right is the single most critical step in building a trustworthy valuation. The integrity of your entire model rests on the quality of these projections.
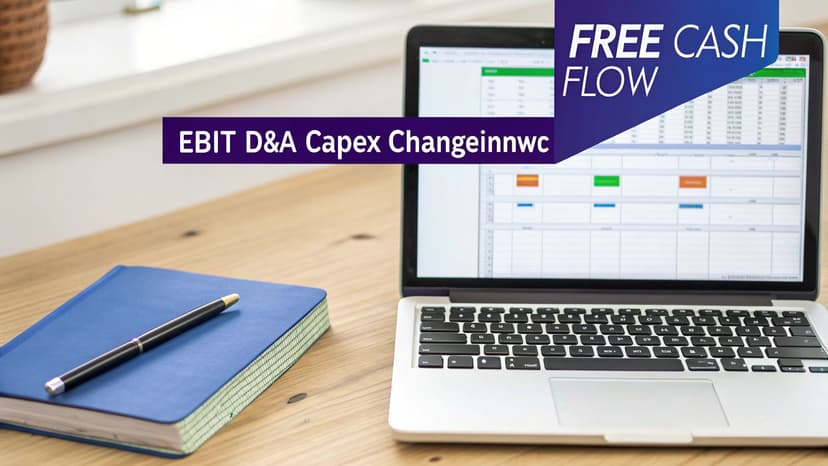
Unpacking the Free Cash Flow Formula in Excel
The goal here is usually to calculate Free Cash Flow to the Firm (FCFF), which starts with a company's operating profit and then makes a few crucial adjustments to get to a pure cash figure. In Excel, the formula for a single year is actually pretty straightforward.
You’d typically lay out your spreadsheet with each component on its own line. If your components are in cells B2 through B6, the Excel formula would look like this:
=B2*(1-B3) + B4 - B5 - B6
Let's break down each component and what it means in plain English:
- EBIT (Earnings Before Interest and Taxes) (Cell
B2): This is the company’s profit from its core business operations. It gives us a clean look at profitability before financing and tax decisions come into play. - Tax Rate (Cell
B3): We multiply EBIT by (1 – Tax Rate) to find the Net Operating Profit After Tax (NOPAT). This step accounts for the cash taxes the business has to pay. - D&A (Depreciation & Amortization) (Cell
B4): This is a non-cash expense. A company never actually writes a check for "depreciation," so we have to add it back to get a true picture of cash flow. - CapEx (Capital Expenditures) (Cell
B5): This is the cash the company spends on big-ticket items like new machinery or buildings. It’s a real cash drain required for growth, so we subtract it. - Change in NWC (Net Working Capital) (Cell
B6): This tracks cash tied up in day-to-day operations, like inventory. If NWC increases, more cash is being used, so we subtract that amount.
From Historical Data to Future Projections
The real trick isn't memorizing the formula; it's forecasting each of those inputs for the next five or ten years. A good projection isn’t a wild guess. It's an educated estimate backed by solid evidence, where you build a realistic narrative about the company's future.
To do this well, you’ll need to dig into a few key sources:
- Historical Performance: Pull up the company’s financial statements from the last three to five years. Calculating past growth rates for revenue, margins, and CapEx gives you a solid baseline to start from.
- Company Guidance: Public companies often release their own forecasts for things like revenue and major investments. This is gold—it’s the management team telling you exactly what they expect.
- Industry Trends: Is the industry growing or shrinking? Big-picture factors like new technologies or regulatory shifts will have a direct impact on the company’s ability to generate cash.
The core of a great dcf model is not complex mathematics, but a well-researched story about a company's future. Each number in your forecast should have a clear justification tied to the business's strategy and its market environment.
Building Projections with Excel Formulas
With your assumptions in hand, you can start building out the forecast in Excel. For example, to project next year’s revenue, you might take the most recent year's revenue (say, in cell B2) and apply your assumed growth rate (e.g., 8% in cell C1). For more complex scenarios, you can learn about using different Excel formulas to make your models more powerful.
The Excel formula for the next year's revenue (in cell C2) would be simple:
=B2 * (1 + C$1)
B2is the revenue from the previous year.C$1is the cell containing your assumed growth rate. The$symbol makes the row reference "absolute," so when you drag the formula across to other columns (for Year 2, Year 3, etc.), it will always refer to the growth rate in row 1.
You'll do the same for every other component of your FCF calculation, linking each one back to your core assumptions. This creates a living model where changing one number—like the tax rate—instantly ripples through and updates your entire valuation.
Calculating WACC and Terminal Value
Once you've mapped out your Free Cash Flow (FCF) projections, the next crucial step is to figure out what that future cash is worth today. This is where two key—and often intimidating—components come into play: the Weighted Average Cost of Capital (WACC) and the Terminal Value.
Think of them as the final, powerful pieces that complete your valuation puzzle. WACC is your "discounting tool," telling you how to translate future dollars into today's value. Terminal Value, on the other hand, captures all the company's worth beyond your initial forecast period.
Demystifying the Weighted Average Cost of Capital (WACC)
The Weighted Average Cost of Capital (WACC) sounds a lot more complicated than it is. At its core, it’s simply the average rate of return a company needs to generate to keep all its investors happy—both its shareholders (equity) and its lenders (debt). It's the minimum return required to make the whole enterprise worthwhile.
In your DCF model, the WACC acts as the discount rate. A higher WACC signals higher risk, which shrinks the present value of those future cash flows. A lower WACC implies less risk and, you guessed it, a higher valuation.
Calculating WACC in Excel involves a single, but multi-part, formula. Assuming your inputs are in cells B1 through B5:
=((B1 / (B1+B2)) * B3) + ((B2 / (B1+B2)) * B4 * (1 - B5))
Let’s quickly break that down:
B1(E – Market Value of Equity): The company's total market capitalization.B2(D – Market Value of Debt): The total value of all company debt.B3(Re – Cost of Equity): The return shareholders expect for taking on the risk of investing. This is often calculated using the Capital Asset Pricing Model (CAPM).B4(Rd – Cost of Debt): The effective interest rate the company pays on its debt.B5(Tax Rate): The company’s corporate tax rate.
Each of these inputs can be found or calculated from a company’s financial statements. You just plug them into your Excel model to get that all-important discount rate.
Capturing Long-Term Value with Terminal Value
A standard DCF usually forecasts cash flows for about five to ten years. But a good business doesn’t just stop existing after year five. The Terminal Value (TV) is our best guess at the company's value for all the years beyond the forecast period, all wrapped up into a single number.
The Terminal Value is often the single biggest driver of a DCF valuation. It operates on the assumption that the business will settle into a stable, predictable growth pattern forever after the initial forecast.
There are two main ways to calculate this critical figure.
1. The Gordon Growth Model
This is the classic, most widely used approach. It assumes the company will grow at a steady, sustainable rate into perpetuity. The Excel formula looks like this:
=(B1 * (1 + B3)) / (B2 - B3)
B1is your Final Year's Free Cash Flow.B2is the WACC (discount rate).B3is the perpetual growth rate (g).
It's vital to be conservative with the growth rate—think 2-3%, or roughly in line with long-term economic growth. Anything higher would imply that the company will one day be bigger than the entire economy, which is a bit of a stretch!
2. The Exit Multiple Method
This method takes a different angle, assuming the company is sold at the end of the forecast period. You calculate the Terminal Value by applying a valuation multiple, like EV/EBITDA, to the final year's relevant metric.
=B1 * B2
B1is the Final Year Metric (e.g., EBITDA).B2is the chosen Exit Multiple.
This is a great approach for industries where acquisitions are common, as it grounds your valuation in real-world market transactions.
How Risk Shapes WACC and Terminal Value
The WACC you choose and the weight of the Terminal Value can look wildly different depending on the company's age and stability. A DCF for a startup versus an established giant tells two completely different stories about risk.
Mature companies like Coca-Cola have predictable cash flows, justifying a WACC in the 8-12% range. Startups, on the other hand, are a different beast. Their unpredictable futures demand a much higher WACC—often 15-25%, and sometimes even over 50%—to compensate for the massive risk. For these high-growth ventures, the terminal value can represent a staggering 70-90% of the total valuation, showing just how critical that long-term assumption is.
With these concepts in hand, you can use tools for AI in Excel to speed up the calculations and test different assumptions on the fly. This frees you up to think strategically about your inputs instead of getting bogged down in the mechanics of formula writing.
Building Your First DCF Model in Excel
Alright, you’ve got the theory down—Free Cash Flow, WACC, and Terminal Value. Now it's time for the fun part: putting it all together in Excel to build a working DCF model. This is where we turn abstract concepts into a concrete valuation tool. Let's walk through how to build a simple but solid model from a blank spreadsheet.
Before diving in, remember that a good DCF model is built on a solid foundation. If you're new to this, it's worth taking time to learn how to properly build financial models in the first place. A clean, well-organized spreadsheet isn't just for looks; it prevents errors and makes your analysis a whole lot easier for you (and others) to understand.
Setting Up Your Assumptions Tab
Every great financial model starts with a dedicated "Assumptions" tab. Think of this as your model's control panel. It’s where you’ll list all the key drivers of your valuation in one tidy spot. Keeping all your inputs here is crucial for clarity and makes running different scenarios a breeze later on.
Your assumptions tab should include inputs for things like:
- Revenue Growth Rate: How much you expect sales to grow each year over your forecast period (say, the next 5 years).
- Operating Margin (EBIT Margin): The percentage of revenue left after covering operational costs but before interest and taxes.
- Tax Rate: The company's effective corporate tax rate.
- Capital Expenditures (as % of Revenue): How much the company needs to reinvest in assets to keep growing.
- Change in Net Working Capital (as % of Revenue): The cash tied up in day-to-day operations.
- WACC (Discount Rate): Your calculated Weighted Average Cost of Capital.
- Perpetual Growth Rate (g): The forever growth rate you assume for calculating the Terminal Value.
Projecting Free Cash Flows for Years 1-5
Next, open a new tab for the actual DCF calculation. Start by laying out your forecast period in columns, from Year 1 to Year 5. Each row will be a line item in your Free Cash Flow calculation, and the key is to link every input back to your assumptions tab.
For example, to project Revenue for Year 1, you'd reference the prior year's actual revenue and the growth rate from your assumptions. The formula might look like this:=PreviousYearRevenue * (1 + Assumptions!B2)
From there, you just build down the income statement to calculate EBIT, then adjust for taxes, and ultimately arrive at Unlevered Free Cash Flow for each of the five years. By linking everything back to the assumptions sheet, your model becomes dynamic—tweak one assumption, and the entire forecast updates instantly.
Calculating Present Value and Terminal Value
With your five-year FCF forecast complete, you need to pull those future cash flows back to today's value. This is where your WACC comes into play. The Excel formula for the present value (PV) of a future cash flow is pretty straightforward:= B2 / (1 + $B$1)^C1
B2is the future Free Cash Flow for a given year.$B$1is the cell containing the WACC (discount rate), locked with$signs.C1is the year number (1, 2, 3, etc.).
Next up is the Terminal Value, which you'll calculate using the Gordon Growth Model. The formula grabs the cash flow from your final forecast year (Year 5) and projects it into perpetuity:= (Year5_FCF * (1 + g)) / (WACC - g)
But don't forget—this Terminal Value is a lump sum at the end of Year 5. You still need to discount it back to its present value today. The formula is almost the same as before:= TerminalValue / (1 + WACC)^5
This flow diagram gives you a great visual of how WACC, future cash flows, and Terminal Value all come together to determine a company's total worth.
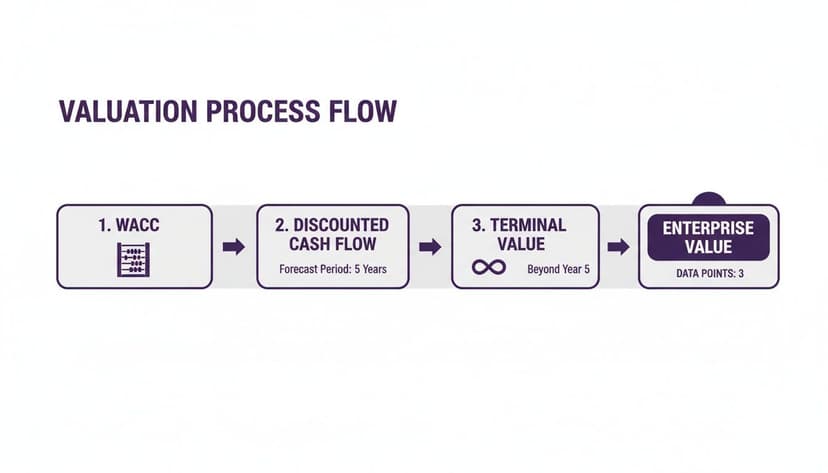
As the visual shows, once WACC and Terminal Value are figured out, you can discount all future cash to land on the Enterprise Value.
Arriving at the Enterprise and Equity Value
The final step is to add it all up. The company's Enterprise Value is the sum of the present values of your five projected cash flows plus the present value of the Terminal Value. In Excel, you can use the SUM function to add these values together.
Enterprise Value = PV(FCF Year 1) + … + PV(FCF Year 5) + PV(Terminal Value)
From there, getting to Equity Value is simple. You just subtract the company's debt and add its cash. To get the final prize—the intrinsic value per share—you divide the Equity Value by the number of shares outstanding. That’s the number your DCF model was built to find.
This whole process is especially powerful for valuing high-growth companies. Think about Amazon in its early days; traditional metrics just couldn't capture its potential. A DCF model, however, could use a longer forecast period of 7-10 years to properly account for its explosive growth phase. In fact, studies show that for fast-growing companies, DCF valuations align 20-25% better with long-term stock performance than simpler valuation methods.
If you're looking to get more comfortable applying these ideas to different financial problems, checking out various Excel use cases can give you great examples of how to build more sophisticated and automated models.
Testing Your Assumptions with Sensitivity Analysis
Let’s be honest: the single valuation number your DCF model spits out is precise, but it's almost guaranteed to be wrong. That’s okay. The real magic of a DCF isn't in that one number, but in understanding how it changes when you poke and prod your key assumptions. This is where you stress-test your model in Excel to find its breaking points.
The entire valuation really boils down to a couple of powerful inputs, mainly your discount rate (WACC) and the long-term growth rate. A tiny nudge to either of these can send your final enterprise value swinging wildly. Sensitivity and scenario analysis are your tools for mapping out these swings, helping you move from a static number to a dynamic range of possibilities.
Using Excel's Data Table for Sensitivity Analysis
Excel has a fantastic, built-in feature for this called a Data Table. It’s designed to show you how a final output—in our case, the company's valuation—changes as two key inputs shift at the same time. Instead of manually plugging in a dozen different WACC and growth rate combinations, a Data Table does it all for you and lays out the results in a neat grid.
Here's a quick, actionable guide to setting it up:
- Create a Matrix: List a range of WACC assumptions along the top row and a range of terminal growth rate assumptions down the first column.
- Link the Output: In the top-left corner cell of the matrix, create a direct link to your final valuation output (e.g.,
=D25). - Launch the Tool: Select the entire table, then navigate to the
Datatab >What-If Analysis>Data Table. - Assign Inputs: For the "Row input cell," select the original WACC cell in your assumptions. For the "Column input cell," select the original growth rate cell.
- Click OK. Excel will instantly populate the entire matrix with the corresponding valuations for each combination.
A sensitivity table turns your DCF from a black box into an interactive dashboard. You can see at a glance which assumptions are really driving the valuation, showing you exactly where the biggest risks and opportunities are hiding.
Building Best, Base, and Worst-Case Scenarios
While a sensitivity table is perfect for tweaking two variables, scenario analysis lets you adjust a whole bundle of assumptions at once. This is how you paint a much richer picture of what could happen by building out different stories for the company's future.
Most analysts stick to three core scenarios:
- Best Case: The everything-goes-right story. Think higher revenue growth, expanding margins, and lower capital investment.
- Base Case: This is your most likely, well-researched forecast—the one you've already built.
- Worst Case: The pessimistic outlook. Growth sputters, costs balloon, or the economy takes a nosedive.
By modeling these different versions of the future, you get a clear view of the full range of potential valuations. This is absolutely critical for making smart decisions because it forces you to confront uncertainty and truly understand the risk you're taking on. You can even find practical examples of how to conduct this type of AI data analysis to help automate the creation of these scenarios.
How to Speed Up Your DCF Analysis with Elyx AI
Building a solid DCF model is a rewarding skill, but let's be honest—it can be a serious time sink. The manual grind of writing formulas, structuring data, and checking for errors is where most analysts get bogged down. Once you've got the concepts down, the real game-changer is learning to work smarter. This is where an AI assistant inside Excel, like Elyx, comes in. Think of it as having an expert financial analyst sitting next to you.
Instead of wrestling with nested IF statements or VLOOKUPs, you can just tell the tool what you need in plain English. This shift lets you spend less time being a spreadsheet mechanic and more time thinking like an investor.
From Manual Drudgery to AI-Powered Insight
Let's make this real. Imagine you need to project a company's revenue for the next five years. The old way involves typing out a formula, locking the right cells, and dragging it across the row, hoping you didn't miss a parenthesis.
With an AI assistant, you could simply type:
"Forecast the next five years of revenue with a 10% annual growth rate."
Elyx instantly builds the projection for you—correct formulas and all. This isn't just about simple tasks, either. Take something more complex, like building a sensitivity table to see how changes in your key assumptions impact the valuation. That's usually a fussy, multi-step process. Now, you can just instruct it directly:
"Build a sensitivity table based on WACC in cell B10 and terminal growth in cell B11."
Just like that, the tool does the heavy lifting, creating the entire table in seconds.
By letting AI handle these tedious but critical steps, you're not just saving time; you're significantly cutting down the risk of manual errors. That frees up your mental energy to focus on what actually matters: challenging your assumptions, interpreting the results, and telling a compelling story with the numbers.
You can see how an AI assistant completely changes the game for your entire Excel workflow, from cleaning messy data to building complex models from the ground up. It’s all about letting the machine handle the mechanics so you can focus on the high-level strategic thinking that drives smart decisions.
Common Questions About DCF Models
Even after you get the mechanics down, you'll find that building a DCF model in the real world brings up a lot of practical questions. Let's tackle some of the most common ones I hear, so you can build your models with more confidence.
What Is the Biggest Limitation of a DCF Model?
Hands down, the biggest challenge with any DCF is that it's incredibly sensitive to your assumptions. The entire valuation is built on a foundation of your predictions—future growth rates, profit margins, and especially the WACC and terminal growth rate.
Change one of those inputs by a tiny fraction, and your final valuation can swing wildly. This is why people often say a DCF is "precisely wrong." It spits out a specific number, but that number is only as good as the forecasts you feed it. That’s exactly why running sensitivity and scenario analyses isn't just a nice-to-have; it's a mandatory part of the process.
How Many Years Should You Forecast Cash Flows?
As a rule of thumb, a five-to-ten-year forecast is standard practice. The main goal here is to project cash flows until the company hits a "steady state"—a point where you can reasonably expect it to grow at a stable, predictable rate forever.
For a big, stable company, five years is probably plenty. But for a fast-growing startup or a business in the middle of a major turnaround, you'll want to extend that out to ten years. That longer runway gives you the time to properly model the high-growth chaos before things settle down into a more sustainable pattern.
Think of the forecast period as a bridge to stability. You need enough years to realistically capture the company's journey from its current state to a mature, predictable enterprise before applying the Terminal Value.
Can You Use a DCF Model for Unprofitable Companies?
Yes, absolutely. It's a common misconception that you can't. Valuing unprofitable startups or turnaround situations with a DCF is done all the time, but you have to be extra careful.
Remember, a DCF is all about future cash flow. Your model needs to tell a believable story about how and when the company will finally turn a profit and start generating positive cash. This means your projections have to map out a clear path to positive margins and eventual stability.
Naturally, the uncertainty is much higher here, so you'll use a significantly higher discount rate to account for that extra risk. In these cases, you'll also find that the valuation is heavily skewed toward the Terminal Value, which represents the company's worth once it finally matures and becomes profitable.
Ready to build faster, more accurate financial models without the manual grind? Elyx AI acts as your expert assistant inside Excel, handling everything from forecasting and formula generation to chart creation from a single command. Start your free trial today and see how much time you can save.
Reading Excel tutorials to save time?
What if an AI did the work for you?
Describe what you need, Elyx executes it in Excel.
Sign up