A Practical Guide to Data Analysis for Small Business Using Excel & AI

Running your small business without looking at your data is like trying to drive a car blindfolded. Sure, you might be moving, but you have no idea where you're headed. This guide isn't about needing a Ph.D. in statistics. It's about solving a concrete problem: how to make smarter, more confident decisions using a tool you already own, Microsoft Excel, and leveraging the power of artificial intelligence (AI) to turn raw numbers into a real roadmap for growth. By the end of this article, you will have a clear, actionable framework to analyze your own data.
Why Data Is Your Most Valuable Asset

So many small business owners tell me they feel like they're just running on gut feelings. And while that intuition is a huge part of being an entrepreneur, flying solo on instinct alone is a massive gamble. Data is what gives you the hard evidence to back up those feelings, turning a good guess into a solid strategy.
Spending too much time on Excel?
Elyx AI generates your formulas and automates your tasks in seconds.
Sign up →Think of your data as a GPS for your business. It tells you exactly where you are, helps you pinpoint where you want to go, and shows you the quickest way to get there.
This isn't about becoming a data wizard overnight. It’s simply about asking the right questions and using the information you already have to find the answers. Approached this way, data analysis for small business stops being an intimidating chore and starts feeling like a secret weapon.
Understanding Your Business Landscape
Let's be real: the world of small business is crowded. In the United States alone, there are around 36.2 million small businesses. That's a mind-boggling 99.9% of all businesses in the country, and they employ 46% of the entire private workforce. You can read more about these stats on Bankrate.com.
What do these numbers mean for you? They mean you're operating in a world where tiny advantages can make a world of difference, especially when you're working with tight margins.
Data analysis is your key to finding those advantages. When you dig into your own numbers, you start to spot hidden opportunities and see potential problems long before they blow up.
The Power of Informed Decisions
So what does this actually look like day-to-day? It means you get to answer the big questions that directly affect your bank account. Instead of guessing, you can actually know:
- Who are my best customers? Your data can point out which group of customers spends the most, so you know exactly where to aim your marketing budget.
- Which products are flying off the shelves? A quick look at sales data helps you keep your bestsellers in stock and stop wasting money on duds.
- When are we busiest? Knowing your peak hours helps you nail your staffing schedule, so you're never caught short-staffed or overpaying for labor.
Data transforms uncertainty into opportunity. It gives you the confidence to act decisively, whether that means launching a new product, adjusting your prices, or investing in a new marketing channel.
Ultimately, when you embrace data, you stop just reacting to what happened yesterday and start actively building the future you want for your business. And the best part? The tools to do this are right at your fingertips. Simple programs like Microsoft Excel, especially with its newer AI features, can turn a boring spreadsheet into a powerful engine for discovery and growth.
Finding the Goldmine of Data You Already Own

A lot of small business owners think you need a massive, complicated database to even think about data analysis. But the truth is, you're probably already sitting on a goldmine of valuable information.
This isn't some hidden treasure locked away in a complex system. It’s right there, tucked inside the everyday tools you use to run your business.
Think about it. Every sale you ring up, every customer you email, every person who clicks on your website—they all leave behind a digital footprint. These little bits of data are the raw ingredients for powerful insights. The trick is to stop seeing them as just records and start seeing them as clues that can help you understand and grow your business.
Uncovering Your Internal Data Sources
So, where is all this valuable data hiding in plain sight? You don't need fancy software to get at it. In fact, most of it can be easily exported into a tool you already know, like Excel.
Here are the most common places to start digging:
- Point-of-Sale (POS) System: This is so much more than a digital cash register. It's a log of every single transaction. It tells you which products fly off the shelves, what your busiest times of day are, and even which items people tend to buy together.
- Customer Email List: Your email platform is a goldmine. You've got names and emails, sure, but you might also have purchase history, customer zip codes, and clear data on who opens your newsletters and clicks on your links.
- Website Analytics: Tools like Google Analytics give you a front-row seat to who's visiting your website. You can see how they found you, what pages they linger on, and where in the world they're browsing from.
- Social Media Pages: Your business’s Facebook or Instagram page is constantly collecting data on follower demographics, how people engage with your posts (likes, shares, comments), and the best times to post for maximum reach.
These sources are the bedrock of data analysis for small business. Together, they paint a surprisingly detailed picture of your operations and how customers interact with you.
Don’t underestimate the power of the simple data you collect every day. A list of customer zip codes can guide your local ad spending, while tracking popular product pairs can inspire a new, profitable bundle.
Turning Raw Numbers Into Real-World Strategy
Knowing where your data is hiding is just the first step. The real magic happens when you start asking that data specific questions about your business. When you do that, you stop seeing a spreadsheet full of numbers and start seeing stories and opportunities.
For example, a local bakery owner could pull their POS data into Excel and notice that croissant sales spike every single Tuesday morning. Armed with that insight, they could run a "Two-for-Tuesday" promotion to lean into that trend and boost sales even more.
Or maybe an e-commerce shop sees in Google Analytics that a ton of website traffic is coming from a single city. What's the next move? A targeted social media ad campaign aimed right at that location.
This whole process of finding and using the information you already have builds momentum and confidence. For a deeper look at this, our guide on small business data analysis provides more strategies. When you start appreciating the data you already have, you turn everyday information into your most powerful tool for making smarter decisions.
Your Simple Four-Step Data Analysis Framework in Excel
The phrase "data analysis" can sound a little intimidating, right? It might bring up images of statisticians in lab coats, but the reality is much simpler. Think of it less like complex mathematics and more like being a detective for your own business—asking the right questions and following the clues hidden in your numbers.
To make data analysis for small business feel less like a chore and more like a secret weapon, we can break it down into a simple, repeatable four-step framework. This approach turns what seems like a huge task into a series of manageable steps, which is perfect when you're already juggling a dozen other things.
We'll follow a single, relatable example from start to finish: a local coffee shop trying to make smarter decisions using Excel.
This process is all about moving from raw, messy numbers to clear, confident actions.
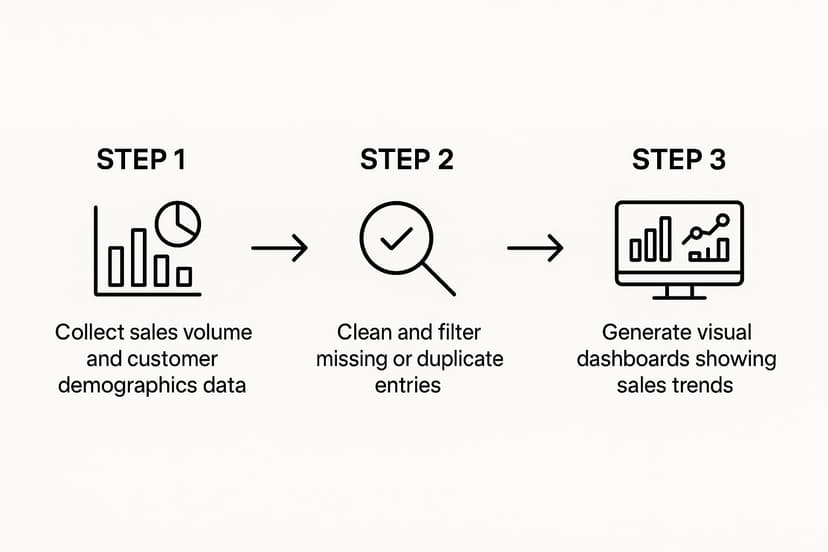
As you can see, the journey follows a logical path. Each step builds on the last, making sure your final decisions are based on solid, reliable information, not just guesswork.
Step 1: Start With A Clear Question
Before you even think about opening a spreadsheet, you need a mission. Without a clear question, you’re just swimming in a sea of numbers with no direction. This is easily the most critical step because it gives your entire analysis a purpose and helps you avoid the dreaded "analysis paralysis."
Your question needs to be specific and tied directly to a business goal. For our coffee shop owner, a vague goal like "increase sales" is pretty useless. A much more powerful question would be: "Which of our specialty drinks generates the most profit on weekdays versus weekends?"
Now that's a question. It's focused, it's measurable, and the answer will directly help with things like marketing and inventory.
Step 2: Gather And Clean Your Data in Excel
Okay, you have your question. Now it's time to gather the evidence.
Our coffee shop owner would start by exporting sales data from their point-of-sale (POS) system into Excel. This raw data would probably include columns for the date, time, item sold, price, and the cost to make it.
But here's the catch: raw data is almost never perfect. You’ll find typos ("Latee" instead of "Latte"), duplicate entries, or blank cells where there shouldn't be. This is where data cleaning comes in. It's like prepping your ingredients before you start cooking—it’s not the most glamorous part, but it ensures the final result is accurate.
In a spreadsheet, this is easier than it sounds:
- Remove Duplicates: In Excel, go to the
Datatab and clickRemove Duplicates. This one-click function gets rid of identical rows. - Find and Replace: Press
Ctrl + Hto quickly fix common misspellings or standardize terms. - Filter: On the
Datatab, clickFilterto quickly spot blank cells or weird entries that need to be fixed or removed.
Think of data cleaning as tidying up your workspace before a big project. A clean, organized dataset is the foundation for trustworthy insights. If you rush this step, it's like building a house on a shaky foundation—it’s bound to fall apart.
Step 3: Analyze And Uncover Insights with PivotTables
With your data all clean and tidy, the real detective work can begin. This is where you start slicing, dicing, and arranging your information to find the answer to your question. For our coffee shop, the goal is to compare the profitability of specialty drinks on weekdays versus weekends.
Excel actually makes this surprisingly simple with a feature called a PivotTable. It sounds technical, but it’s an incredibly powerful tool that lets you summarize huge amounts of data in just a few clicks, without writing a single formula.
To create one, select your data, go to the Insert tab, and click PivotTable. Our owner can then drag and drop fields to group all their sales by the day of the week and by the specific drink, calculating the total profit for each. Suddenly, patterns that were completely invisible in the raw data start to pop out.
The analysis might reveal that a high-margin drink like the "Caramel Macchiato" is a huge bestseller on weekends but barely sells during the week. That’s a powerful insight. It’s not just a number anymore; it's a story about what your customers want and when they want it.
Step 4: Visualize And Take Action Using Excel Charts
Let's be honest, a big table of numbers is hard for anyone to get excited about. The final step is to turn your findings into a simple, visual story that points directly to a decision. In Excel, a basic bar chart or line graph can make your insights instantly clear and impossible to ignore.
Our coffee shop owner could highlight their PivotTable summary, go to the Insert tab, and choose a Bar Chart to compare the profitability of their top three drinks, showing the difference between weekday and weekend performance. Seeing it visually makes the takeaway land with much more impact.
And this leads directly to action. Based on this one chart, the owner could decide to:
- Run a "Weekday Special" on the Caramel Macchiato to boost its sales from Monday to Friday.
- Feature a different drink on their menu board that's already popular during the week.
- Adjust their ingredient orders to avoid wasting supplies on drinks that don't sell well on certain days.
This entire framework turns a simple sales report into a smart, profitable business strategy. The process is logical, it's repeatable, and it proves that you don't need a Ph.D. to make data work for you.
This whole process can be boiled down into a simple table. Think of this as your cheat sheet for turning data into decisions.
Four-Step Data Analysis Framework for Small Businesses
| Step | Key Question | Example Action in Excel | Desired Outcome |
|---|---|---|---|
| 1. Ask | What specific business problem am I trying to solve? | Define the question: "Which drinks are most profitable on weekdays vs. weekends?" | A focused, measurable goal for your analysis. |
| 2. Gather & Clean | Where is my data, and is it accurate? | Export POS data, use "Remove Duplicates" and "Find & Replace" for typos. | A clean, reliable dataset ready for analysis. |
| 3. Analyze | What patterns or trends can I find in the data? | Create a PivotTable to group sales by drink and day of the week. | A clear insight, like "Caramel Macchiatos sell best on weekends." |
| 4. Act | How can I turn this insight into a business decision? | Create a bar chart visualizing the profit difference and brainstorm promotions. | A concrete, data-backed action plan to improve the business. |
By following these four steps, any small business owner can move from feeling overwhelmed by data to feeling empowered by it.
Putting Excel and AI to Work for You
Once your data is clean and you have a clear question in mind, it's time to find the answers. This is where you can really see the power of data analysis for small business, turning a familiar tool like Microsoft Excel into your personal data expert. You don't need a degree in data science; you just need to know which features to use and when.
We'll start with the fundamentals that help you organize information quickly. From there, we'll get into the real game-changer that makes sophisticated analysis accessible to everyone—artificial intelligence.
Mastering the Essentials in Excel
Before you jump into the deep end, mastering a few core Excel functions can make a massive difference. Think of these as the workhorses of data organization. They can bring order to thousands of rows of data in just a few clicks.
- Sorting: This simple function lets you arrange your information in a way that makes sense. For instance, you could sort sales records by date to spot chronological trends or by sale amount to instantly see your biggest transactions.
- Filtering: Filtering is like putting on special glasses that only let you see the data you care about. Want to see only the clients from Chicago? Or view product sales from last month? Filtering gets it done.
- Conditional Formatting: This feature is a visual lifesaver. It automatically highlights cells based on rules you create. For example, you can make any inventory level below 10 units turn bright red, immediately drawing your attention to what needs reordering.
These basic tools are the building blocks of any good analysis, helping you spot initial patterns before you dig deeper.
Uncovering Deeper Insights with PivotTables
When you're ready to move beyond simple organization, PivotTables are your next step. A PivotTable is an incredibly powerful feature that summarizes huge datasets in seconds. It allows you to group, count, and total your data without writing a single formula.
Imagine you have a spreadsheet with 5,000 sales records from the past year. Trying to manually figure out which product was your bestseller each month would be a complete nightmare.
With a PivotTable, you can answer that question in less than a minute. You just drag and drop the "Product" field into the rows area and the "Sales Amount" into the values area. Instantly, Excel generates a clean summary table showing total sales for each product. This tool transforms an overwhelming amount of data into a clear, digestible summary.
A PivotTable acts like a data microscope, letting you zoom in on specific parts of your business to see the patterns hidden inside. It bridges the gap between raw numbers and actionable insights.
The Real Game-Changer: AI in Excel
While PivotTables are fantastic, the next leap forward in spreadsheet analysis is bringing in artificial intelligence. AI acts like a smart assistant, automating tedious tasks and making complex analysis as simple as asking a question in plain English. This is where tools like Elyx.AI really shine.
For many small businesses, adopting advanced tools is still a huge opportunity. Research suggests that most haven't fully integrated AI or advanced analytics yet. Millennial business owners are often leading the charge, recognizing that technology can unlock both cost savings and new revenue. You can find more details on this trend in the report on small business technology adoption at Vena Solutions.
AI add-ins for Excel completely change the game. Instead of having to remember complex formulas or navigate confusing menus, you can just type what you need.
Here’s how AI can transform everyday data analysis tasks:
- Instant Projections: Type "forecast my sales for the next three months based on last year's data," and the AI can generate a projection backed by your numbers, complete with a chart.
- Automated Summaries: Ask "what were my top 5 products last quarter by revenue?" and get a perfectly formatted table or chart answering your question in seconds.
- Formula Generation: Stuck trying to build a complicated formula? Just describe what you need, like "create a formula to calculate the average sale price for products in the 'Electronics' category," and the AI will write it for you.
This conversational approach makes data analysis for small business accessible to everyone. It knocks down technical barriers, letting you focus on the business questions you want to answer, not on the tricky steps to get there. To learn more about how this works, check out our guide on using AI for data analysis. By combining the familiar environment of Excel with the power of AI, you can unlock insights that were once out of reach for anyone but a seasoned data analyst.
Key Metrics That Actually Drive Business Growth

Jumping into data analysis for small business without a clear plan is a lot like starting a road trip with no destination in mind. You can drive for hours, burning fuel and wasting time, but you’ll never get anywhere meaningful. The secret isn't tracking everything—it's about tracking the right things.
These vital signs for your company are called Key Performance Indicators (KPIs). They’re the numbers that cut through the noise and show you exactly how your business is doing in the areas that truly matter.
Instead of getting swamped by endless spreadsheets, let's focus on a handful of powerful metrics you can calculate right in Excel. We'll group them into three crucial categories: financial health, customer insights, and marketing performance.
Gauging Your Financial Health
The financial stability of your business is its bedrock. Tracking these metrics ensures you're not just making sales, but building a profitable company that can last. Knowing how to manage small business cash flow is an essential skill, and these numbers will tell you the real story.
- Gross Profit Margin: Think of this as the profitability of your core product or service. It's the percentage of money left over from a sale after you've paid for the direct costs of what you sold. A healthy margin means you have more cash to cover rent, salaries, and other operating expenses.
- Customer Acquisition Cost (CAC): How much does it cost you, on average, to win a single new customer? This number is critical. It helps you decide if your marketing campaigns are actually making you money or just costing you.
Gross Profit Margin Formula in Excel:
=(Total Revenue - COGS) / Total RevenueTo see this as a percentage, just click the "%" button on the Home tab.
Understanding Your Customer Insights
Your customers are the heart of your business. If you can get a handle on how they behave, you can keep them happy, encourage them to come back, and find more people just like them.
- Customer Lifetime Value (CLV): This is a forecast of the total amount of money you can expect to earn from a single customer over their entire relationship with you. A great business model is one where your CLV is much higher than your CAC.
- Customer Churn Rate: What percentage of your customers stop doing business with you over a given time? A high churn rate is a red flag, pointing to potential issues with your product, service, or overall customer experience.
You don't need fancy software to get started. Calculating these in Excel can be as simple as organizing your customer purchase data into columns and using basic formulas to track averages and totals.
Measuring Your Marketing Performance
Marketing can often feel like guesswork, but data turns it into a science. These KPIs show you whether your marketing dollars are delivering real results.
- Conversion Rate: Of all the people who visit your website or see your ad, what percentage actually takes the action you want them to? Whether it's making a purchase or signing up for a newsletter, this metric tells you how persuasive your marketing is.
- Return on Ad Spend (ROAS): For every dollar you put into advertising, how many dollars do you get back in revenue? ROAS gives you a straight answer, helping you double down on the ads that work and cut the ones that don't.
As you rely more on digital tools, keeping your data safe becomes non-negotiable. Small businesses are a huge target for cyberattacks—in fact, 43% of all cyberattacks are aimed at them. This vulnerability often comes down to limited investment in security, which can lead to data breaches with devastating financial costs.
Got Questions? We’ve Got Answers.
Jumping into the world of data analysis for small business can feel a bit like learning a new language. It's exciting, but it's natural to have questions. Let's walk through some of the most common ones we hear from entrepreneurs, so you can start your data journey with confidence.
"Is Data Analysis Too Complicated If I'm Not a Tech Whiz?"
Absolutely not. You don't need a degree in computer science to get started. Honestly, the most important tool you have is your own curiosity about your business.
The secret is to start small, often with a program you're already familiar with, like Excel. The goal isn't to become a data scientist overnight. It’s about learning to ask better questions and letting your own business data provide the answers.
And today’s tools are built for the rest of us. AI assistants like Elyx.AI work right inside Excel and do the heavy lifting. You can literally just type a question like, "Which region had the highest sales last quarter?" and it will pull the analysis together for you. It's more about asking the right questions than knowing the right formulas.
"How Much Data Do I Actually Need to Start?"
You probably have enough to get meaningful insights right now. A customer email list, a few months of sales figures, or some basic website traffic reports are more than enough to begin. The key is to start with what you have, not wait for the "perfect" dataset.
Think about it this way: analyzing your last 100 sales is far more useful than waiting a year to collect a massive, messy database you never touch. Those first 100 transactions can tell you which products are flying off the shelves or what your busiest days are. As your business grows, your data will grow with it, allowing your analysis to get deeper over time.
Start small and build momentum. The insights you pull from your first simple analysis will often point you toward what data you should be collecting next. It's a natural, evolving process.
"What's the Biggest Data Mistake Small Businesses Make?"
It’s a classic trap: "analysis paralysis." This happens when you get so caught up in collecting data that you never actually use it. You have spreadsheets full of numbers but no real plan for what to do with them.
Another common pitfall is chasing "vanity metrics"—things like social media likes or page views that look impressive but don't really move the needle on your actual business goals, like profit or customer loyalty.
The best way to sidestep this is to stick to a simple, focused process:
- Ask a specific question first (e.g., "Why did sales dip in March?").
- Gather only the data needed to answer that one question.
- Analyze it to find a clear, simple insight.
- Take action based on what you found.
This keeps you from getting lost in the weeds and ensures your efforts are always tied to real-world results.
"How Do I Keep My Customer Data Secure?"
This is a big one, and it’s non-negotiable. Protecting customer information is fundamental to building trust. The good news is that you don't need a cyber-fortress; you just need good habits.
Start with the fundamentals. Use strong, unique passwords for all your accounts and turn on two-factor authentication whenever it's an option. If you're working with sensitive customer info in an Excel file, you can even password-protect the file itself.
Make it a habit to regularly back up your data, either to a secure cloud service or a separate physical drive. And finally, be strict about who has access. Only team members who absolutely need customer data to do their job should be able to see it. These simple steps are the foundation of a smart, modern data strategy.
Ready to stop guessing and start making data-driven decisions? Elyx.AI integrates directly into Excel, turning your familiar spreadsheets into a powerful analysis tool. Ask questions in plain English, generate charts instantly, and uncover the insights you need to grow your business—no complex formulas required.
Unlock the power of your data with Elyx.AI today!
Reading Excel tutorials to save time?
What if an AI did the work for you?
Describe what you need, Elyx executes it in Excel.
Sign up