How to Build a Powerful Cost Benefit Analysis Template in Excel (with AI)

A cost benefit analysis template is a structured framework for weighing the total expected costs of a project against its potential benefits. The goal is to determine if an investment is financially sound, providing a clear, data-driven basis to proceed—or reconsider. It’s about moving beyond intuition to a quantifiable assessment of potential returns, all within the familiar environment of Excel.
This guide will walk you through building a practical template from scratch, populating it with realistic data, and using Excel's built-in formulas and AI tools to extract powerful insights. By the end, you'll have a reusable tool to solve the concrete problem of evaluating project viability.
Why Smart Decisions Start with a Solid Excel Template
Great ideas can fail if the financial implications aren't thoroughly vetted from the start. A well-constructed cost benefit analysis template in Excel acts as a financial roadmap, guiding your decisions past emotional bias and overly optimistic projections.
Spending too much time on Excel?
Elyx AI generates your formulas and automates your tasks in seconds.
Sign up →At its core, a cost-benefit analysis is a cornerstone of evidence-based decision making. It compels you to meticulously consider every financial angle, from significant upfront investments to the subtle, ongoing operational costs that can accumulate over time.
Moving Beyond Guesswork with a Structured Framework
Without a structured framework, it’s easy to overlook critical variables. Imagine a marketing team considering new automation software. They might focus on the monthly subscription fee but neglect to factor in:
- Implementation Costs: The total person-hours required for setup and configuration.
- Training Expenses: The cost to bring the entire team up to speed on the new platform.
- Integration Challenges: Potential hidden costs associated with making the new software compatible with your existing tech stack.
An Excel template provides dedicated cells for these items, ensuring they are not overlooked. This structured approach isn't just theoretical. Research suggests that organizations using a formal cost-benefit analysis can improve project success rates by up to 35%. A systematic process ensures every cost is evaluated against its potential gain.
Before building the template, let's outline the key data points you'll need to gather.
Core Components of a Cost Benefit Analysis
| Component Type | Description | Excel-Friendly Examples |
|---|---|---|
| Direct Costs | Tangible, upfront expenses directly tied to the project. | Software licenses, new equipment, consultant fees, raw materials. |
| Indirect Costs | Overhead or operational costs necessary for the project but not directly linked. | Increased utility bills, rent for extra space, administrative support. |
| Intangible Costs | Non-monetary costs that can impact the business. | Dip in team morale during transition, disruption to workflow. |
| Direct Benefits | Tangible, measurable financial gains resulting from the project. | Increased sales revenue, cost savings from automation. |
| Indirect Benefits | Positive outcomes that aren't directly financial but add value. | Improved brand recognition, better customer satisfaction scores. |
| Intangible Benefits | Non-monetary advantages that are hard to quantify but valuable. | Enhanced employee morale, stronger company culture. |
Organizing these categories in Excel from the start ensures you capture a holistic view, not just the most obvious figures.
Gaining Clarity and Confidence
Ultimately, this exercise is about making decisions with confidence. A robust analysis in Excel doesn't just produce a "yes" or "no" answer; it provides a clear view of the potential ROI and payback period, translating a complex evaluation into an actionable summary.
A cost benefit analysis isn't about predicting the future with 100% accuracy. It's about making the most informed decision possible with the available data, creating a solid, defensible rationale for your strategic choices.
Excel is the ideal tool for this type of structured analysis.

Its grid layout is perfect for organizing costs and benefits into distinct categories. This structure sets the stage for the powerful formulas and AI-driven insights we will explore next.
Building Your Template Framework in Excel
Let's begin building our cost benefit analysis template. Open a blank worksheet in Excel. Our goal is not just to enter numbers but to create a logical framework that tells a clear and convincing financial story.
A poorly organized spreadsheet can lead to flawed conclusions. A major project management study found that inadequate planning contributes to a staggering 29% of project failures. We can mitigate this risk by setting up distinct, clearly labeled sections for all costs and benefits. This simple step makes your analysis professional, comprehensive, and easy for stakeholders to understand.
Structuring Costs and Benefits in Separate Tables
First, create the main categories. I recommend dedicating separate tables for costs and benefits. This visual separation is critical for clarity.
In your "Costs" table, set up these columns:
- Cost Item: A specific name for the expense (e.g., "New CRM Software," "Onboarding Training").
- Category: Group the cost (e.g., "One-Time Capital," "Recurring Operational").
- Description: A brief note for context.
- Amount: The specific monetary value.
Next, create a similar table for your "Benefits":
- Benefit Item: Name the positive outcome (e.g., "Increased Sales Revenue," "Reduced Customer Churn").
- Category: Classify it (e.g., "Direct Revenue," "Productivity Gain").
- Description: Briefly explain the source of the benefit.
- Amount: The projected financial value.
This basic structure provides a solid foundation. Now, let's add the details that will transform this spreadsheet into a powerful analytical tool.
Adding Granularity for a Complete Picture
To elevate your template from a simple list to a strategic instrument, you must account for less obvious financial impacts. Under your main "Costs" table, create sub-sections or use filters for different cost types—direct, indirect, tangible, and intangible. This level of detail is what separates a superficial analysis from one that drives intelligent decisions.
The best templates force you to confront costs you might otherwise overlook. Don't just consider the purchase price; factor in maintenance, training hours, and the short-term productivity dip as the team adapts. These hidden costs often determine a project's true ROI.
Here is an example of where we are headed. This is an Excel data table used for modeling different scenarios—a powerful technique we can later enhance with AI.
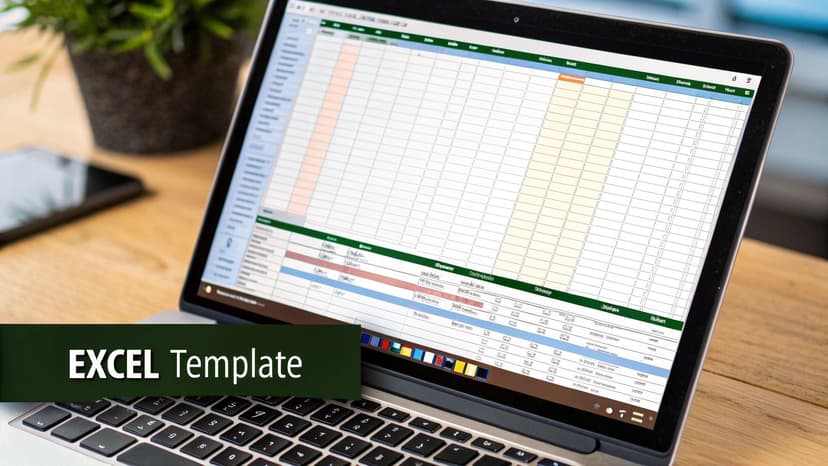
This screenshot shows a "What-If Analysis" data table, which is perfect for exploring how changes in one variable—like sales volume or material costs—affect the overall financial outcome. By building a solid, well-organized framework now, you enable this kind of dynamic analysis later. It allows you to plug in new variables and instantly see the results without rebuilding your spreadsheet.
Populating Your Excel Template with Realistic Data
Your cost-benefit analysis template is built, but it's currently an empty shell. Its value—its ability to guide smart decisions—is entirely dependent on the quality of the data you input.
The principle of "garbage in, garbage out" is paramount here. An analysis based on guesswork will yield a worthless conclusion, potentially steering a critical business decision in the wrong direction.
This is where the detailed work begins. To ensure your analysis is credible, every number must be grounded in reality. This involves sourcing accurate, defensible figures for every line item.
Finding Solid Numbers for Your Costs
Let's say you are considering a new project management software subscription. How do you find the real costs?
- Go Straight to the Source: Request official quotes from vendors for software licenses, implementation fees, and mandatory training.
- Use Industry Benchmarks: To estimate labor costs, research average hourly rates for the specific roles involved in your project.
- Dig into Your Own History: Analyze similar past projects. Your company's historical data is an invaluable resource for realistic forecasting.
Before entering these numbers into Excel, ensure the data is clean and standardized, especially if it comes from multiple sources. For a practical guide on this crucial step, see our article on how to clean data in Excel. This ensures your analysis is built on a reliable foundation.
How to Forecast Benefits (Without Getting Carried Away)
Assigning a dollar value to benefits, particularly intangible ones, requires both analytical rigor and sound judgment. The most common pitfall is over-optimism. The key is to link every benefit to a measurable, concrete outcome.
Returning to our software example, instead of a vague entry like "Improved Productivity," you must quantify it.
Suppose the new tool is projected to save each of your 10 team members an average of 2 hours per week. You can calculate the financial benefit in Excel:
=10 * 2 * 52 * 50 (where $50 is the average loaded hourly rate)
This formula yields a tangible benefit of $52,000 per year.
This same logic can be applied to "improved team morale" by linking it to a projected decrease in employee turnover, which has a calculable cost saving.
Pro Tip: In your Excel sheet, use the "Notes" feature or an adjacent column to document the assumptions behind your figures. Explaining how you arrived at a number is as important as the number itself. This practice makes your analysis defensible and easy to adjust as new information becomes available.
This structured approach is essential for large-scale projects. Major infrastructure or technology rollouts in the United States and the European Union often involve billions in upfront costs, with benefits realized over 20 to 30 years.
Government audits show that projects employing a thorough cost-benefit analysis are 15-20% more likely to adhere to their budgets and deliver the promised outcomes. Why? Because the framework compels planners to account for all variables, including indirect and intangible benefits. You can learn more about these cost-benefit analysis findings. This is a powerful reminder of why populating your template with carefully considered data is a worthwhile investment.
Making the Numbers Work for You with Formulas and AI
Your cost benefit analysis template is now populated with solid, realistic data. The next step is to make it work for you. Manually crunching these numbers is not only tedious but also prone to errors that can undermine your entire decision. Automation through Excel formulas and AI transforms your static spreadsheet into a dynamic analytical tool.
Migrating from manual calculations to an automated template is a significant upgrade. Studies indicate that teams using digital CBA templates can reduce their evaluation time by up to 40%. By letting formulas handle the computations, you can focus on interpreting the insights.
The Essential Excel Formulas Your Template Needs
Let's integrate some of the most critical financial metrics directly into your Excel sheet. These three formulas form the bedrock of any serious cost-benefit analysis.
- Net Present Value (NPV): NPV is essential because it accounts for the time value of money—a dollar today is worth more than a dollar tomorrow. The formula
=NPV(discount_rate, range_of_cash_flows) - initial_investmentcalculates the total current value of your project. - Benefit-Cost Ratio (BCR): This provides a direct comparison of benefits to costs. You can calculate it by dividing the total present value of benefits by the total present value of costs. A BCR greater than 1.0 indicates that the benefits outweigh the costs.
- Payback Period: This formula answers the question: "How long until we recoup our initial investment?" A simple calculation is
Initial Investment / Annual Net Cash Flow. It offers a quick assessment of how soon the project will generate a positive return.
To become more proficient with these and other powerful functions, our guide to the most important financial formulas in Excel is an excellent resource.
Key Financial Metrics for Your Template
Understanding what each metric signifies is crucial for interpretation. This table breaks down the essentials.
| Metric | What It Measures in Excel | Simple Interpretation |
|---|---|---|
| NPV | The total value of all future cash flows (positive and negative), discounted to their present value. | Positive NPV? The project is expected to be profitable. The higher, the better. |
| BCR | A ratio comparing the financial benefits of a project to its costs. | Greater than 1.0? Benefits exceed costs. Less than 1.0? Costs outweigh benefits. |
| Payback Period | The time it takes for the initial investment to be recovered through net cash flows. | A shorter payback period generally indicates lower risk and a faster return on investment. |
The true power of an Excel template lies in these metrics updating automatically as you adjust your assumptions.
Taking Your Analysis to the Next Level with AI
Formulas are powerful, but what if you could simply ask Excel to perform the analysis for you? AI-powered Excel add-ins like Elyx.AI make this possible, transforming your spreadsheet into an intelligent analytical partner.
Instead of wrestling with complex functions, you can generate entire models with simple, plain-English prompts.
Imagine typing: "Create a sensitivity analysis table showing how NPV changes if my initial costs increase by 5%, 10%, and 15%." Elyx.AI can build that entire table for you, saving you the time and effort of manually setting up Excel's "What-If Analysis" tools.
This represents the natural evolution of financial analysis—from manual calculations to sophisticated, AI-driven insights.
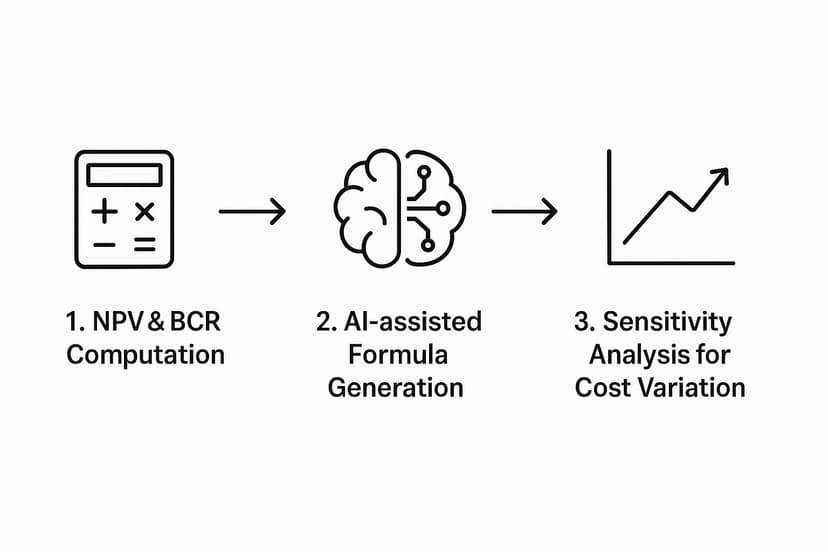
As this infographic illustrates, the journey of analysis begins with basic calculations and progresses toward complex risk assessments, which AI now makes accessible to all Excel users. The growing AI's role in the accounting profession is not about replacing human expertise but about augmenting it with better tools for smarter, faster decision-making.
By integrating an AI tool into Excel, you move beyond mere automation. You can analyze data, create charts, and run scenarios through conversational commands. Your template evolves from a simple calculator into a true decision-making dashboard.
Turning Your Analysis into a Confident Decision

You have built a robust cost benefit analysis template, populated it with high-quality data, and automated the calculations. The numbers are in, but they don't make the decision for you—they inform it. This final step is about translating that raw data into a clear, strategic recommendation.
The metrics from your template are the core of your argument. A Benefit-Cost Ratio (BCR) of 1.8 tells a simple story: for every dollar invested, the project is expected to return $1.80. A positive Net Present Value (NPV) confirms that the project is projected to be profitable over its lifecycle, accounting for the time value of money.
However, context is critical. Is a three-year payback period good? For a major infrastructure project, it’s excellent. For a short-term marketing campaign, it may be too long. Your role is to frame these numbers within the context of the project's specific goals and your organization's risk tolerance.
Presenting a Compelling Narrative with Excel Visualizations
No one wants to decipher a raw spreadsheet. Stakeholders need a clear, compelling story that explains what the numbers mean. Excel’s visualization tools are perfect for this.
You can make your findings more accessible by creating a few simple charts:
- Bar Chart: Ideal for a direct, side-by-side comparison of total costs versus total benefits.
- Line Chart: Use this to plot cumulative cash flow over the project's life, clearly illustrating the payback period.
- Pie Chart: Excellent for showing a breakdown of the largest cost categories.
If you have an AI tool like Elyx.AI, you can simply ask it to create these for you: "Create a bar chart comparing total costs and total benefits."
These visuals transform abstract numbers into tangible insights, making your final recommendation far more persuasive.
Your final recommendation should be more than a simple "yes" or "no." It should be a confident, data-backed statement. For example: "We recommend proceeding with Project X. Our analysis indicates a positive NPV of $104,925, a BCR of 1.18, and a payback period of just under four years. This investment is financially sound and aligns with our strategic objectives."
From Analysis to Action
Ultimately, a cost-benefit analysis is your best defense against uncertainty. It provides a structured framework for making a calculated strategic move rather than a guess.
To further strengthen your business case, especially when dealing with uncertainty, consider running a sensitivity analysis. Our guide on performing a sensitivity analysis in Excel will show you how to test your assumptions and build an even more resilient financial model.
Have Questions? We Have Answers
Even the most straightforward template can raise questions. Here are answers to common queries about performing a cost-benefit analysis in Excel.
What Are the Biggest Mistakes People Make?
The most frequent error is underestimating true costs. It's easy to focus on major expenses and forget "hidden" costs like initial setup, team training hours, and ongoing maintenance. These can significantly impact the final ROI.
Another common mistake is excessive optimism when forecasting benefits. Ground every benefit projection in reality by tying it to a specific, measurable outcome. Also, remember to account for intangible costs, such as a temporary dip in team morale during a major transition, which has a real, albeit hard-to-quantify, impact.
How Can You Possibly Put a Price on Intangible Benefits?
This is challenging but crucial for a complete analysis. To assign a dollar value to something like "improved customer satisfaction," find a proxy metric you can measure in Excel.
For instance, you can link higher customer satisfaction to increased customer retention.
- If your project is expected to reduce customer churn by 2%, you can calculate the annual revenue saved from retaining those customers.
- For a benefit like "enhanced productivity," estimate the time saved per employee each week and multiply that by their fully-loaded hourly rate.
The goal isn't perfect accuracy but to base your estimates on logical, defensible assumptions that you can explain to stakeholders.
Pro Tip: Document your assumptions for intangible benefits directly in your Excel template using comments or a dedicated notes column. This transparency builds credibility and simplifies future adjustments if better data becomes available.
How Often Should I Update My Analysis?
A cost-benefit analysis is not a static document. It is a living tool that should evolve with your project. For any project lasting more than a few months, plan to revisit and update your analysis at major milestones or at least quarterly.
This practice allows you to compare your initial forecasts against actual performance. Are costs higher than anticipated? Are benefits materializing more slowly? Identifying these deviations early enables you to adjust the project's course before committing further resources, transforming your template from a planning document into an active project management tool.
Ready to stop wrestling with formulas and start getting instant insights? With Elyx.AI, you can generate complex analyses, create charts, and clean your data just by asking. Transform your Excel workflow and make data-driven decisions faster than ever.
Explore what you can do with Elyx.AI today.
Reading Excel tutorials to save time?
What if an AI did the work for you?
Describe what you need, Elyx executes it in Excel.
Sign up