7 Ways for Converting Rows to Columns in Excel (2026 Guide)

You open a workbook, see months spread across the top, regions down the side, and immediately know the layout is wrong for the next step. Maybe you need a chart, maybe Power BI wants a normalized table, maybe your colleague pasted a report from an ERP and called it “raw data.” The numbers are fine. The shape is the problem.
That’s why converting rows to columns in Excel matters. It isn’t cosmetic. It changes whether your data can be filtered cleanly, charted properly, or loaded into another tool without extra cleanup. Excel gives you several ways to flip data, but the right method depends on one question most tutorials skip: Is this a quick one-time fix, or part of a repeatable workflow?
Some jobs need a two-click answer. Others need a live formula. Others need Power Query because the file is too large or too messy for manual handling. And if you’re working inside broader reporting workflows, it helps to understand where transposition fits into the larger idea of data preprocessing in Excel workflows.
Spending too much time on Excel?
Elyx AI generates your formulas and automates your tasks in seconds.
Sign up →Why You Need to Convert Rows to Columns
A common example is a sales export where each month sits in a separate column: Jan, Feb, Mar, Apr, and so on. That format looks readable in a spreadsheet, but it often breaks the next task. Charting tools usually prefer one date column and one value column. Pivoting, filtering, and grouping also get easier when repeated categories run vertically instead of horizontally.
Another frequent case is reporting templates. Finance teams receive a file where business units are listed across columns, but the dashboard expects them in rows. Operations teams get survey data where questions run left to right, but they need a vertical structure to analyze responses. The issue isn't that the source is wrong. It’s that the source was built for viewing, not analysis.
Data layout decides how much work comes next. A clean transpose can remove half the friction from reporting.
Excel has supported this kind of restructuring for a long time. The Transpose option arrived in Excel 5.0 in 1993, and at a time when Excel held over 90% market share in spreadsheet software, the feature became widely relevant for spreadsheet users across major markets. Gartner estimated 20 to 30% time savings in data preparation for finance teams compared with manual re-entry, as noted in Microsoft’s guidance on transposing data in Excel.
What usually triggers the need
- Reporting tools reject the layout because time periods or categories are spread across too many columns.
- Charts become awkward when series names are where labels should be.
- Formulas get harder to maintain because horizontal data often expands in ways templates didn’t expect.
- Manual reformatting creeps in and people start copying, pasting, and rebuilding the same structure every week.
In practice, transposing data is one of those small Excel skills that keeps larger workflows moving. Once you know when to use a static method, when to use a dynamic one, and when to step up to Power Query, the task stops feeling like spreadsheet repair and starts feeling like normal data work.
2 Quick Methods for One-Off Data Flips
When the job is small and you just need the layout fixed now, use a manual method. These are the fastest options for converting rows to columns in Excel when you don’t need a live connection back to the source.

1 Paste Special with Transpose
This is the classic move. It’s still the best choice when you have a small block of data and want a quick, static result.
Use it like this:
- Select the source range.
- Copy it with Ctrl+C.
- Click the top-left cell of the destination area.
- Right-click and choose Paste Special.
- Select Transpose.
Excel flips rows into columns and columns into rows. If your source is a 5 by 4 block, the result becomes a 4 by 5 block. Many users make their first mistake: they paste into an area that doesn’t have enough space. The destination must be empty and sized for the flipped shape.
When Paste Special works well
- Small, clean ranges that won’t need updating later
- Quick presentation fixes before sending a file
- Ad hoc analysis where speed matters more than automation
Where it falls short
Paste Special creates a static copy. If the source changes, the transposed result won’t update. It also doesn’t work directly on Excel tables, so you may need to convert the table to a normal range first.
Practical rule: If you expect the source data to change even once, don’t build a recurring report on top of Paste Special.
A second limitation is scale. Static transpose is fine for modest ranges, but it becomes less reliable as the data grows. That’s one reason experienced Excel users treat it as a convenience tool, not a workflow engine.
This short walkthrough is useful if you want to see the clicks before trying it yourself.
2 PivotTable as a restructuring shortcut
A PivotTable is not a true one-to-one transpose. It reshapes and summarizes data. Still, it’s useful when the core problem isn’t just orientation, but how fields are arranged.
For example, if months are across columns and you want a compact summary by region, product, or category, a PivotTable may get you closer to the layout you need than a literal transpose.
Try it when:
- you want aggregation, not just flipping
- you need to group values
- the raw data is technically usable, but poorly organized for reading
A simple approach is to create a PivotTable from the source, then drag the fields so the categories that were acting like column headers become row labels instead. This won’t preserve the original cell-for-cell arrangement, but it often creates a better report.
Which quick method to choose
| Method | Best use | Updates automatically | Main trade-off |
|---|---|---|---|
| Paste Special Transpose | Small one-off flips | No | Static output |
| PivotTable | Summaries and field rearrangement | Yes, with refresh | Not a true transpose |
If you only need the data flipped once, Paste Special is usually faster. If you’re already moving toward summarization or reporting, a PivotTable can save a step.
2 Dynamic Methods Using Excel Functions
Static copies solve immediate problems. Dynamic formulas solve recurring ones. If the source range changes and you want the transposed output to stay in sync, formulas are the better tool.
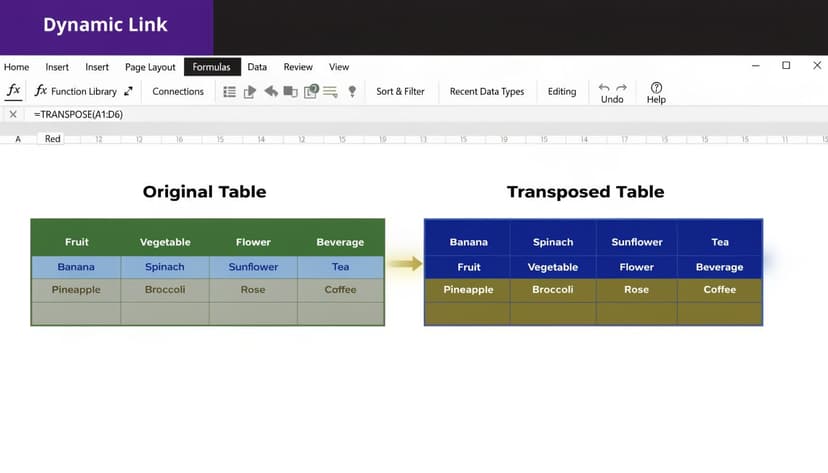
3 The TRANSPOSE function
The direct formula is:
=TRANSPOSE(A1:D5)
It flips the selected array so rows become columns. In modern Excel, especially Excel 365, the result can spill automatically into the necessary cells. In older versions, you must first select the full destination range, type the formula, and confirm it with Ctrl+Shift+Enter.
That version difference matters. A lot of frustration with TRANSPOSE comes from legacy Excel behavior, not the function itself.
Use this method when:
- the source range is stable in shape
- you want the output to update when source values change
- the transposed range feeds a dashboard, chart, or linked report
For a deeper formula reference, Elyx has a practical guide to the Excel TRANSPOSE formula.
How to set it up correctly
Suppose your source data is in A1:D5. That means:
- the source has 4 columns
- the source has 5 rows
- the destination must therefore be 5 columns by 4 rows
In Excel 365:
- click one starting cell
- enter
=TRANSPOSE(A1:D5) - press Enter
In older Excel:
- select the entire destination block first
- type
=TRANSPOSE(A1:D5) - press Ctrl+Shift+Enter
If the destination size is wrong in legacy Excel, the result fails or fills incorrectly.
Common problems with TRANSPOSE
The function is useful, but it has trade-offs. According to the referenced guidance on how to transpose data with Excel functions, dimension mismatches cause 45% of errors in user forums, and the function’s volatility can slow files larger than 1MB by 20 to 30% because it recalculates on any sheet change.
That’s why I treat TRANSPOSE as a strong reporting tool for moderate workloads, not a default answer for every workbook.
If the workbook already feels heavy, adding volatile array logic usually makes it feel heavier, not smarter.
4 INDEX with ROW and COLUMN for more control
When TRANSPOSE is too rigid, INDEX gives you a more customizable pattern. This approach is especially useful when you want to copy the transposed layout down and across with regular formulas instead of one array formula.
A common setup looks like this:
=INDEX($A$1:$D$5,COLUMN(A1),ROW(A1))
Detailed explanation:
- INDEX($A$1:$D$5, row_num, column_num) returns a value from the range.
- COLUMN(A1) returns
1. As you copy the formula across, it becomes2,3,4, and so on. - ROW(A1) returns
1. As you copy the formula down, it becomes2,3,4, and so on. - By swapping row and column logic, you effectively flip the orientation.
This method is helpful when:
- you want to fill formulas manually
- you need to wrap the transpose inside additional logic
- you want to handle blanks or formatting conditions more precisely
Comparing the 2 function-based methods
| Formula method | Best for | Strength | Weakness |
|---|---|---|---|
| TRANSPOSE | Fast dynamic flipping | Direct and readable | Can be rigid and volatile |
| INDEX with ROW/COLUMN | Controlled layouts | Flexible and copyable | Harder to build |
What works in real files
For a dashboard or lightweight reporting model, TRANSPOSE is usually enough. For more custom work, INDEX is safer because it gives you control cell by cell.
What doesn’t work well is forcing formula-based transposition onto messy source data with blanks, merged cells, or changing dimensions every week. At that point, formulas stop being elegant and start becoming maintenance.
The Power Query Method for Large Datasets
When the data is large, recurring, or messy, Power Query is the method that scales. This is the option I recommend when the transpose is part of a repeatable process rather than a one-time correction.
Why Power Query changes the decision
Power Query was introduced in Excel as a PowerPivot add-in in 2010 and became natively integrated in 2016. It can process datasets up to 1 million rows without memory issues, while Paste Special often freezes on arrays over 10,000 cells. In the same context, Excel powers 80% of Fortune 500 data analysis, and 75% of analysts prefer Power Query for cleaning and reshaping messy data, based on the DataCamp summary of Excel transpose methods in its Power Query tutorial.
That isn’t just about size. It’s about repeatability. Power Query stores the transformation steps, so you can refresh the result instead of rebuilding it.
How to transpose with Power Query
The cleanest workflow is:
- Turn the source range into a table if needed.
- Go to Data.
- Choose Get Data or From Table/Range.
- In Power Query Editor, go to Transform.
- Click Transpose.
- Review headers and data types.
- Choose Close & Load.
If the first row should become headers after the transpose, use the header tools inside Power Query after the flip. That order matters in messy files. In many cases, I transpose first, then promote headers, then clean blanks.
Why it works better on recurring reports
Power Query saves each action as a transformation step. That means next week’s file can follow the same pipeline with a refresh. If your source keeps arriving in the same awkward orientation, converting rows to columns in Excel then stops being a repetitive task and becomes a reusable process.
A few strong use cases:
- Monthly exports from ERP or CRM systems
- Wide operational files with too many period columns
- Messy source tables that need cleanup before analysis
- Shared reporting workflows where consistency matters more than speed of first setup
What to watch for
Power Query is stronger, but not magical.
- Header handling matters. After transpose, what used to be the first column may become the first row, so inspect headers before loading back.
- Refresh is manual or scheduled. The output won’t update just because someone typed in the source sheet unless your workflow includes refresh.
- Cell-level formatting isn’t the goal. Power Query is built for data structure, not presentation polish.
The moment you repeat the same transpose every week, Power Query usually beats formulas and manual copy-paste.
If you’re building repeatable spreadsheet operations beyond transpose, this broader guide to Excel automation workflows helps frame when Excel should act like a reporting tool and when it should act like a process engine.
Choosing the Right Method and VBA Automation
Once you’ve seen several options, the practical question is simple: which one should you use today, in this workbook, for this type of data?
A working decision rule
Use Paste Special when the task is small and disposable. Use formulas when the output must stay linked to the source. Use Power Query when the dataset is large or the task repeats. Use VBA when transpose is only one step inside a larger automated routine.
That last category matters more than many people think. Sometimes the transpose itself isn’t the hard part. Often, the overall requirement is: import file, clean headers, transpose, add formulas, export result. That’s where VBA or a broader data pipeline ETL mindset becomes useful, because the shape change is just one stage in a larger flow.
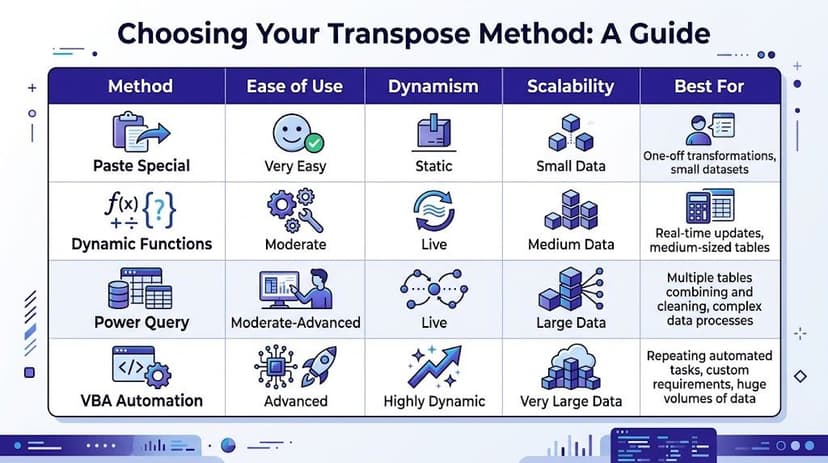
Comparison of Excel Transpose Methods
| Method | Best For | Data Updates | Performance | Complexity |
|---|---|---|---|---|
| Paste Special | Fast one-time flips | Static | Fine for small ranges | Low |
| Dynamic Functions | Linked report outputs | Live | Good for moderate files, weaker in heavy models | Medium |
| Power Query | Recurring and large data jobs | Refresh-based | Strong for scale | Medium |
| VBA Automation | Custom multi-step workflows | Depends on macro design | Good when well-structured | High |
6 VBA for custom automation
VBA is useful when you want a button-driven process or need to embed transpose inside a broader macro. A very simple example is:
Sub TransposeRange()
    Range("A1:D5").Copy
    Range("F1").PasteSpecial Paste:=xlPasteAll, Transpose:=True
End Sub
What this does:
Range("A1:D5").Copycopies the source blockRange("F1").PasteSpecialpastes starting in cellF1Transpose:=Trueflips the orientation during the paste
This is not the most advanced macro you’ll ever write, but it shows the core idea. You can wrap this inside file import routines, reporting macros, or formatting sequences.
When VBA is worth it
- You repeat the same workbook actions often
- You need one-click execution for non-technical users
- The transpose is part of a bigger scripted process
When VBA isn’t worth it is just as important. If you only need a transpose once in a while, writing code adds more maintenance than value. For examples of where macros do make sense, this collection of Excel macro samples is a good next stop.
The 7th Method Full Automation with ElyxAI
There’s a point where knowing every method isn’t the same as wanting to execute every method. You know the data needs to be flipped, maybe cleaned, maybe re-labeled, maybe loaded into a report. The question becomes whether you should spend time doing mechanics or move straight to analysis.
That’s where an AI agent changes the workflow. Instead of choosing between Paste Special, TRANSPOSE, Power Query, or VBA yourself, you can describe the outcome in plain language and let the system handle the execution. In practical terms, that means a request like “put months into rows instead of columns, clean blanks, and prepare this for charting” can trigger the actual spreadsheet work rather than just an explanation of what to click.
The appeal isn’t only speed. It’s consistency. Manual transpose work often breaks on edge cases like odd headers, blank cells, mixed formatting, or files that don’t quite match last week’s version. An execution-focused AI tool reduces the need to remember which Excel feature fits which scenario.
If you want to see how that works inside Excel, this overview of AI for Excel workflows shows the broader model.
If you’re tired of spending time on the mechanics of Excel instead of the analysis, try Elyx AI. It works inside Excel as an autonomous agent, so you can ask for outcomes in plain English, like restructuring a report, cleaning the data, building a pivot, or formatting the result, and let the tool execute the workflow for you.
Reading Excel tutorials to save time?
What if an AI did the work for you?
Describe what you need, Elyx executes it in Excel.
Sign up