What is Data Normalization? A Simple Guide for Excel Users

Think of data normalization as a way of getting all your data to speak the same language. It’s a technique for organizing and scaling information to get rid of inconsistencies and make sure everything is structured logically. This is a crucial step for anyone who wants to perform accurate analysis in Microsoft Excel.
Imagine you're comparing apples and oranges—literally. If one is measured in grams and the other in pounds, you can't make a fair comparison until you convert them to a common unit. Data normalization does the same thing for your numbers, ensuring every data point is on a level playing field so your analysis in Excel is accurate and reliable.
Understanding the Core Concept

Spending too much time on Excel?
Elyx AI generates your formulas and automates your tasks in seconds.
Sign up →Let's say you're analyzing sales figures from two different stores in an Excel spreadsheet. One store reports its sales in individual dollars ($50, $200, $500), while the other reports in thousands of dollars (0.2, 0.8, 1.5). If you just plugged those numbers into an Excel chart, it would be a complete mess. The first store's performance would look wildly inflated just because the scales are mismatched.
This is exactly the kind of problem data normalization solves. By applying a simple formula in Excel, you can rescale both datasets to a common range, like 0 to 1. Suddenly, you get a true apples-to-apples comparison, and real trends start to emerge from the noise. This is a fundamental part of good data hygiene and a key step in the wider process of data modeling. If you want to dive deeper, you can learn more in our guide on what data modeling is.
The Purpose Behind Normalization
The main goal here is to cut down on redundant data and boost consistency. When you normalize a dataset in Excel, you structure it so that every piece of information lives in just one place. This isn't just about saving a bit of storage; it's about preventing the kind of errors that creep in when you're trying to add, update, or delete records.
This isn't some new-fangled idea. It’s been a bedrock principle of database design since the 1970s. In fact, around 85% of relational databases use normalization to at least the third normal form (3NF), which can reduce data redundancy by up to 70% in large-scale systems. Skipping this step can have real financial consequences—some reports show businesses lose an average of $15 million a year from poor data quality alone.
To get a clearer picture, here’s a quick overview of what data normalization is all about.
Data Normalization at a Glance
This table breaks down the essential "who, what, why, and how" to give you a straightforward summary.
| Concept | Description | Example in Excel |
|---|---|---|
| Who | Anyone who works with data—analysts, marketers, finance pros, and researchers. | A financial analyst comparing revenue streams that have vastly different value ranges. |
| What | The process of scaling and structuring data to a common range or format. | Taking a column of employee salaries from $30k to $150k and transforming it to a scale of 0 to 1. |
| Why | To ensure fair comparisons, improve model accuracy, and prevent data integrity issues. | Making sure marketing spend and sales figures contribute equally to a performance analysis model. |
| How | By using mathematical formulas like Min-Max Scaling or Z-Score Normalization. | Applying the STANDARDIZE function to a dataset to calculate Z-scores for each value. |
As you can see, normalization is a practical tool that makes your data cleaner, more reliable, and ultimately more useful for making smart decisions.
Why Normalizing Data Is a Game Changer for Your Business
So, we've covered what data normalization is. But why should you actually care? The simple truth is that clean, well-organized data is the foundation of any smart business decision. Without it, you’re essentially flying blind. It's like trying to navigate a new city with a map where all the streets are jumbled up.
Normalization cuts right through the clutter that messes up your spreadsheets and poisons your analysis. Its biggest win is eliminating redundant information. This doesn't just save a bit of storage space; it's about preventing the kind of inconsistencies that can silently sabotage your work. When you have the same piece of information scattered across multiple rows, every single update becomes a game of chance.
Preventing Costly Data Anomalies
Think about a classic Excel headache: a customer's address is listed just slightly differently across several of their order records. One row says "123 Main St," another has "123 Main Street," and a third has a typo like "123 Mian St." It seems minor, but these little differences can lead to big problems—costly shipping errors, failed deliveries, and ultimately, unhappy customers.
This is a perfect example of an update anomaly. If that customer moves and you only manage to update one of those records, the others stay wrong. Just like that, your data is corrupted. Normalization fixes this by giving that customer's address a single, dedicated home and linking it to all their orders. Now, one update fixes it everywhere, instantly.
By structuring your data to get rid of these inconsistencies, you create a single source of truth. This means your pivot tables, charts, and reports aren't just faster to build—they're actually trustworthy. You can finally make decisions with confidence because you know the data behind them is solid.
Boosting Analysis and AI Performance
The benefits of data normalization go way beyond just tidying up your data entry. If you're using Excel for any kind of serious analysis, a normalized dataset is a dream to work with. Your operations will run faster, formulas become simpler, and the chance of a miscalculation drops dramatically. This structured approach is also absolutely essential when you're getting data ready for more powerful tools.
Take machine learning, for example. Normalization is a non-negotiable first step. It puts all your different data features on the same scale, which gives your model's accuracy a massive boost. In fact, some studies have shown that unnormalized data can lead to a 20-30% drop in performance for common algorithms. It's no wonder that a survey of 15,000 data professionals found that 88% of them consistently normalize their data. You can discover more insights about normalized data for advanced analytics and see how the pros put it to work.
At the end of the day, it doesn't matter if you're pulling together a simple sales report or training a complex predictive model. The principle is the same: normalization turns messy, unreliable data into a powerful, strategic asset. And with tools like Elyx.AI stepping in to automate the process within Excel, you can spend less time cleaning and more time finding those game-changing insights.
A Look at Common Normalization Techniques
Now that we've covered why normalization is so important, let's get into the how. While it might sound a bit technical, the most common methods are surprisingly easy to grasp. We'll walk through the three go-to techniques you'll encounter in Excel and data analysis, explaining how they work and when to use each one.
Think of each technique as a different lens for looking at your data. The best one for the job really depends on what you're trying to achieve with your analysis. Getting a feel for their distinct purposes is the first step to producing clean, reliable insights.
Min-Max Scaling: Bringing Everything to a 0-to-1 Scale
Min-Max Scaling is probably the most popular method out there, mostly because it’s so intuitive. The goal is simple: take all the values in your dataset and rescale them so they fit neatly into a specific range, usually 0 to 1.
Imagine you’re comparing customer age (ranging from 18 to 75) with their total purchases (ranging from 1 to 500) in your Excel sheet. The scales are wildly different. Min-Max Scaling fixes this by transforming both columns. The lowest value in each column becomes 0, the highest becomes 1, and everything else is adjusted proportionally in between. This is perfect when you need to compare features measured in different units without letting the bigger numbers overshadow the smaller ones.
In Excel, you can do this with a straightforward formula. For a value in cell A1 within a dataset in column A, it looks like this:
=(A1-MIN(A:A))/(MAX(A:A)-MIN(A:A))
Here’s a detailed breakdown of this formula:
A1is the individual cell you want to normalize.MIN(A:A)finds the smallest value in the entire column A. By referencing the whole column, you ensure you get the true minimum.MAX(A:A)finds the largest value in the entire column A, giving you the upper bound of your range.- The formula subtracts the minimum from your value and then divides by the total range (max minus min). This calculates where your specific value sits proportionally within the dataset's range.
Z-Score Normalization: Measuring Distance from the Average
Next up is Z-Score Normalization, which you might also hear called standardization. Instead of squeezing data into a 0-1 range, this technique re-frames each data point based on its distance from the dataset's average (mean). The result, or "Z-score," tells you exactly how many standard deviations a value is from that average.
A Z-score of 0 means the data point is perfectly average. A score of 1 means it’s one standard deviation above the average, while -1 means it's one standard deviation below. This method is fantastic for spotting outliers and getting a better sense of your data's distribution, as it clearly shows how typical or unusual each value really is. Getting this right is a cornerstone of solid data modeling best practices.
For a step-by-step guide on doing this in Excel, check out our tutorial on how to use the STANDARDIZE function—it makes the whole process much simpler.
Decimal Scaling: A Quick and Simple Shift
Decimal Scaling is a simpler technique that normalizes data just by moving the decimal point. How many places you move it depends on the largest absolute value in your dataset. The idea is to make sure all the scaled values fall somewhere between -1 and 1.
For instance, if the biggest number in your list is 450, you'd divide every number by 1000 (which is 10 to the power of 3) in a new Excel column. This turns 450 into 0.45, 25 into 0.025, and so on. It’s a fast method, but it’s less common than the other two because it's very sensitive to that single largest value.
Choosing the right method can feel tricky, so here’s a quick comparison to help you decide which approach best fits your needs in Excel.
Comparison of Normalization Techniques
This table gives a side-by-side look at the three techniques, helping you pick the right tool for your specific data and analysis goals.
| Technique | Best For | Output Range | Excel Formula Example |
|---|---|---|---|
| Min-Max Scaling | When you need a fixed, bounded range (e.g., 0 to 1) and your data has no significant outliers. Ideal for algorithms like neural networks. | Typically 0 to 1 | =(A1-MIN(A:A))/(MAX(A:A)-MIN(A:A)) |
| Z-Score Normalization | When your data follows a normal distribution and you need to handle outliers or compare values based on their distribution. | Not bounded; typically ranges from -3 to 3. | =STANDARDIZE(A1, AVERAGE(A:A), STDEV.P(A:A)) |
| Decimal Scaling | Simple, quick scaling when you just need to bring values into a smaller range. Less commonly used in complex analyses. | -1 to 1 | =A1 / (10^k) where k is the smallest integer such that `max( |
Ultimately, picking the right technique comes down to understanding your data and what you want to learn from it. Each method prepares your dataset for a more meaningful and accurate analysis.
Your Step-by-Step Guide to Normalizing Data in Excel
Theory is great, but the real learning happens when you roll up your sleeves and get your hands dirty. Let's walk through a practical example using a typical messy sales report in Excel. I'll guide you from figuring out which columns actually need normalizing to writing the formulas yourself.
Picture a common sales report. You've got columns for Salesperson, Units Sold, and Total Revenue. The Units Sold might be anywhere from 10 to 150, but Total Revenue could stretch from $5,000 to $250,000. If you try to compare these two columns as-is, the huge revenue numbers will completely overshadow the units sold in any analysis. This is a classic case where normalization is needed.
Identifying and Preparing Your Data
Before you even think about formulas, the first job is to pinpoint which columns need this treatment. The golden rule is to only normalize numerical data that you plan to compare or use together, especially in things like predictive models.
Categorical data, like the names of your salespeople or product lines, should be left alone—normalizing them doesn't make sense.
Once you’ve picked your targets—in our case, Units Sold and Total Revenue—it's a good idea to create two new, empty columns right next to them. Name them something obvious, like Units Sold (Normalized) and Total Revenue (Normalized). This simple step keeps your original data safe and sound while you work.
Applying the Min-Max Scaling Formula
For this walkthrough, we'll use the Min-Max Scaling technique. It’s a popular choice because it neatly squishes all your values into a consistent 0-to-1 range, making everything comparable without messing up the relationships between the original numbers.
Let's say your Units Sold data lives in column B (from B2 down to B100) and Total Revenue is in column C (C2 to C100). Here’s how you'd set up the formulas for the very first row of data:
- For
Units Sold (Normalized): In cell D2 (your new column), type this formula:=(B2-MIN($B$2:$B$100))/(MAX($B$2:$B$100)-MIN($B$2:$B$100)) - For
Total Revenue (Normalized): In cell E2, you’ll do the same for the revenue data:=(C2-MIN($C$2:$C$100))/(MAX($C$2:$C$100)-MIN($C$2:$C$100))
A Quick Tip on the Formula:
See those dollar signs ($)? They create what's called an absolute reference. This is a non-negotiable part of the formula. It locks theMINandMAXfunctions to the entire dataset range ($B$2:$B$100), so when you drag the formula down to fill the column, Excel always references the correct, complete range instead of a shifting one.
Once the formulas are in, just grab the little square at the bottom-right corner of cells D2 and E2 and drag it down. Excel will automatically apply the normalization to all your rows.
The infographic below gives a great visual overview of the most common normalization techniques, including the Min-Max method we just used.
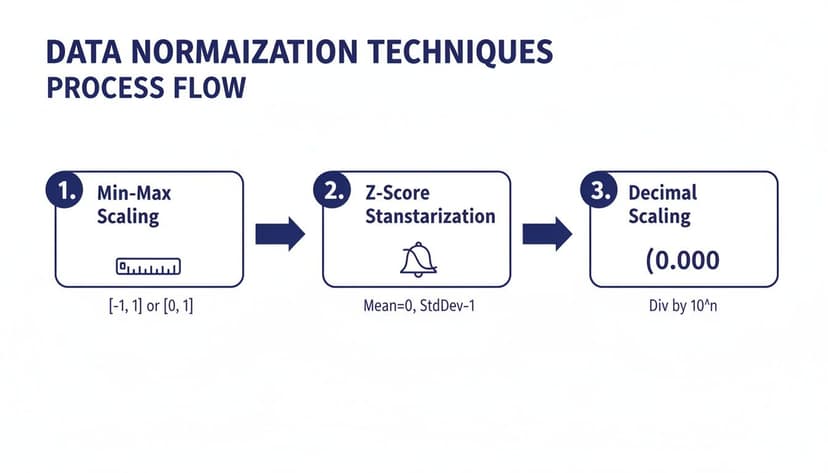
This visual breaks down how each technique—Min-Max, Z-Score, and Decimal Scaling—takes raw data and standardizes it for analysis. While doing this manually in Excel is perfectly fine for smaller tasks, it can get repetitive fast. For bigger or more frequent projects, checking out some of the best data transformation tools can be a huge time-saver.
How AI Makes Normalization Effortless
Once you've wrestled with normalization manually, you know the drill. It works, but it's not exactly fun. Doing it by hand in Excel is repetitive, a minefield for formula errors, and a huge time sink, especially when you're dealing with big datasets. We've all been there—one misplaced dollar sign in a formula can wreck an entire analysis, sending you down a rabbit hole of troubleshooting.
This is where modern AI tools built right into Excel are a total game-changer. Forget about building complicated formulas and manually dragging them down thousands of rows. You can get the same, or even better, results in a fraction of the time with a simple, plain-English instruction.
From Tedious Formulas to Simple Commands
Think about this: instead of messing with formulas, you just type, "Normalize the marketing spend and revenue columns using Z-score." That’s it. An AI assistant like Elyx.AI understands what you want, applies the right calculations instantly, and creates the normalized columns for you. No manual effort needed.
This isn't just about saving a few minutes; it's about drastically cutting down the risk of human error. The AI takes care of everything—finding the right data, applying the correct statistical functions, and making sure it's all done accurately and consistently. Behind the scenes, many AI solutions use advanced data systems, like a feature store, to manage and serve up this prepared data for machine learning models.
An Intelligent Assistant for Data Prep
The real power of AI in Excel goes way beyond just applying one formula at a time. It works like a smart data assistant that can handle your entire data preparation workflow from start to finish.
An AI agent can manage the whole process, from cleaning up your raw data to creating the final charts. This gets you out of the weeds of mechanical data prep, so you can spend your brainpower on strategic analysis and figuring out what the numbers actually mean.
You can give it a multi-step command that covers everything. For example: "Remove the duplicates in the sales data, normalize the 'Order Value' column using Min-Max scaling, and then make a bar chart to show the results." The AI just does it, step by step, turning what used to be a long, tedious chore into a single, effortless action.
If you want to see what else you can automate, our guide on using AI in Excel has a ton of other ideas.
Common Normalization Mistakes and How to Avoid Them

It’s easy to stumble when you’re normalizing data, even with the best intentions. A few common missteps can easily derail the whole process. Knowing what these pitfalls are is the first step toward building your analysis on a solid foundation, not shaky assumptions.
One of the most common mistakes is trying to normalize non-numeric data. Normalization is purely a mathematical operation—it only works on numbers. If you try to apply it to categorical data like 'Product Category' or 'Region,' you’ll just end up with corrupted, meaningless values.
Another big one is picking the wrong technique for your data’s specific distribution. Imagine using Min-Max scaling on a dataset that has a few extreme outliers. This will squash most of your data points into a very narrow range, which can seriously distort your results and hide the very patterns you're looking for.
Keeping Your Normalization Consistent
A more subtle but equally damaging error is the inconsistent application of rules, especially when new data comes in. Let's say you normalized your original sales data based on its initial minimum and maximum values. You absolutely must use those same original min/max values to normalize any new sales data you add later.
Forgetting to apply the original normalization parameters to new data is like changing the rules of a game halfway through. It breaks the consistency of your scale, making comparisons between old and new data completely unreliable and invalidating your analysis.
Finally, failing to document your work can create major headaches down the road. Always keep a record of which columns you normalized, the specific technique you used, and the key parameters (like the original min, max, mean, and standard deviation). Good documentation is non-negotiable for keeping your data reliable over time. For more tips, check out our guide on data cleaning best practices.
A Few Final Questions About Data Normalization
Let's wrap up by tackling some of the most common questions people have when they're first getting the hang of data normalization.
What's the Real Difference Between Normalization and Standardization?
It's easy to mix these two up, but they do different jobs.
Think of normalization as squishing your data into a specific, predictable range—most often between 0 and 1. It’s like taking everyone’s height and converting it to a scale where the shortest person is 0 and the tallest is 1.
Standardization, on the other hand, doesn't care about a fixed range. Instead, it re-centers your data around a mean of 0, measuring everything in terms of standard deviations. It tells you how far each data point is from the average, which is perfect for algorithms that assume your data follows a bell curve.
Can I Normalize Data Inside a Pivot Table?
Not directly, no. A Pivot Table is designed for summarizing data that's already prepared, not for changing the underlying values on the fly.
The best approach is to add a new column to your source data, run your normalization formula there first, and then refresh your Pivot Table. You can then pull that shiny new normalized column right into your analysis.
How Often Should I Be Normalizing My Data?
You'll want to re-normalize any time you add fresh data to a dataset you're actively using for analysis.
The crucial part here is consistency. Make sure you apply the exact same parameters (like the original minimum and maximum values you calculated) to the new data. Otherwise, a "1" in your old data won't mean the same thing as a "1" in your new data, and your models will get confused.
Ready to stop wrestling with manual formulas and let AI handle the heavy lifting? Elyx.AI acts as your personal data assistant directly within Excel, executing complex tasks like data normalization, cleaning, and charting from a single command. Start your free 7-day trial and transform your workflow today!
Reading Excel tutorials to save time?
What if an AI did the work for you?
Describe what you need, Elyx executes it in Excel.
Sign up