Master Sales Forecast Template Excel: 5 Methods

Your manager asks for an updated forecast before end of day. You open last quarter’s workbook and find five tabs with similar names, broken links, hardcoded overrides, and comments like “temp fix” that are now permanent. Someone changed a formula in March. Nobody remembers why.
That is the moment a proper sales forecast template excel setup stops being a nice-to-have and becomes part of how you run the business. A forecast should be quick to update, easy to audit, and strong enough to defend in a sales review or budget meeting.
The mistake I see most often is starting with formulas. The better move is to build the file like an operating model. First define the data you trust. Then pick the forecast method that matches the business. Then make the workbook resilient enough that monthly updates do not turn into spreadsheet archaeology.
Spending too much time on Excel?
Elyx AI generates your formulas and automates your tasks in seconds.
Sign up →Your Guide to a Stress-Free Sales Forecast in Excel
A good forecast removes drama from routine reporting.
When the request lands late in the day, you should not be rebuilding assumptions from memory. You should be dropping in fresh data, refreshing calculations, scanning variances, and sending a view that leadership can understand in one pass.
That only happens when the template is designed for repeat use. In practice, that means your workbook needs:
- A clean input area for historical sales and pipeline data
- A visible assumptions tab so changes are explicit
- A calculation layer that separates raw data from formulas
- An output view for management, with baseline and scenario ranges
The payoff is not only speed. It is credibility.
If a sales leader challenges the number, you can point to the logic. If finance asks why the quarter changed, you can show which deals moved, which assumptions changed, and which method produced the forecast. That is very different from saying, “We adjusted it based on feel.”
Practical rule: If a new analyst cannot update your forecast file without asking where to paste data, the template is not finished.
The rest of this guide focuses on building that kind of workbook from scratch, not downloading a generic sheet and hoping it fits your business.
Laying the Foundation with 3 Essential Data Points
Most forecast errors start before Excel does anything wrong. They start with incomplete inputs.

Historical sales data
Start with what occurred.
For a working sales forecast template excel model, I prefer one clean table with one row per period and enough dimensions to slice the business properly. At minimum, keep date, product line, sales channel, region, owner, units, and revenue. If your business is service-based, swap units for billable hours, projects, or retained accounts.
Do not mix actuals and projections in the same raw table. Keep actuals untouched.
A solid historical table lets you do three useful things:
- Spot trend direction across months or quarters
- Separate signal from noise when one product line behaves differently from another
- Build methods that can be defended instead of guessed
If your team also sends proposals before deals close, upstream commercial data matters too. A sales forecast gets stronger when it reflects how opportunities enter the pipeline, how they progress, and where they stall. That is also why process improvements like increase your quote acceptance rate can matter to forecasting quality, because better quote conversion changes what should realistically enter your committed view.
Current pipeline data
Historical data tells you what patterns existed. Pipeline data tells you what is in play now.
Export current opportunities from your CRM into a separate input tab. Structure the table with fields such as account, opportunity name, deal amount, expected close date, owner, stage, and probability. Keep stage names standardized. “Proposal Sent” and “Proposal sent” should not coexist.
For teams using weighted forecasting, this structure is not optional. It is the backbone of the model.
Here is the minimum checklist:
| Field | Why it matters |
|---|---|
| Opportunity amount | Gives the value base for calculations |
| Probability | Enables weighted expected value |
| Close date | Places revenue in the right month or quarter |
| Stage | Adds context and supports review discipline |
| Product or segment | Helps split forecast by line of business |
Business assumptions and market signals
Some forecast inputs are not in the CRM and not in last year’s sales.
A pricing change, a planned campaign, a new territory rep, a delayed product release, or a known seasonal demand pattern can all shift the outlook. These do not belong buried inside formulas. Put them in an Assumptions tab.
Use plain labels. “Price increase effective month.” “Expected launch month.” “Seasonality comment.” “Channel priority.” The purpose is transparency, not elegance.
Key takeaway: If leadership asks why the forecast moved, your assumptions tab should answer the question faster than your inbox can.
That combination of historical data, pipeline data, and explicit assumptions is what turns a spreadsheet into a workable forecasting system.
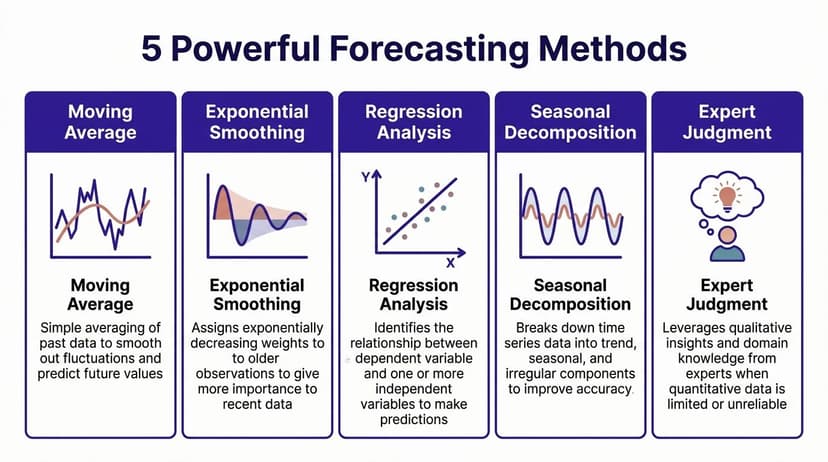
Building Your Template with 5 Powerful Forecasting Methods
Different businesses need different methods. Stable recurring sales respond well to trend-based approaches. Deal-driven teams need pipeline weighting. Newer businesses often need a driver model.
Method 1 historical run rate
This is the simplest starting point.
If sales are relatively stable, project forward using recent actual performance. In Excel, the core formula is often just an average over recent periods:
=AVERAGE(B2:B4)
If cells B2:B4 contain the last three months of sales, Excel returns the mean. You can then use that value as the next month’s run rate.
Why it works:
- It is easy to explain
- It avoids overreacting to one unusual month
- It is useful when you need a quick baseline
What it misses:
- Sudden market changes
- seasonality
- pipeline-specific movement
This method is best for businesses with repeatable demand and low month-to-month volatility.
Method 2 moving average
A moving average is a cleaner version of the run rate because it rolls forward as new data arrives.
Suppose your monthly sales sit in column B. For a rolling three-period average in row 5, use:
=AVERAGE(B2:B4)
Then copy the pattern downward as each new period appears. The logic stays the same, but the window keeps moving.
A more dynamic setup is to convert the range into an Excel Table and use structured references. That reduces broken formulas when rows are added.
This method is good for smoothing noise. It is weak when the business has clear acceleration or strong seasonal spikes.
Method 3 linear regression
When sales follow a broader trend rather than a flat average, Excel’s regression tools help.
The common function is:
=FORECAST.LINEAR(x, known_y's, known_x's)
Example structure:=FORECAST.LINEAR(A14, B2:B13, A2:A13)
How it works:
A14is the future period you want to predictB2:B13contains historical salesA2:A13contains the matching time index
Excel fits a straight-line trend through the historical data and returns the projected value for the future period.
Use this when demand is growing or declining in a fairly consistent pattern.
Do not use it blindly if the business is strongly seasonal. In that case, exponential smoothing can be more suitable. If you want a deeper Excel explanation of seasonal forecasting functions, this guide on FORECAST.ETS in Excel is a useful companion.
Method 4 weighted pipeline forecasting
For many B2B sales teams, this is the method that matters most.
The core formula architecture is Forecast = Sum of (Opportunity Amount × Probability), which is the reliable structure described by Coefficient in its Excel forecasting guide at https://coefficient.io/forecasting-sales/sales-forecasting-excel.
In Excel, if amount is in column C and probability is in column D, the row formula is:
=C2*D2
Then total the weighted values:
=SUM(E2:E50)
If your probabilities are stored as percentages, Excel handles them correctly as decimal values behind the scenes.
A simple example appears in weighted pipeline templates discussed by K38 Consulting. A 50% close rate on $50,000 monthly sales yields a $25,000 weighted forecast, and with monthly updates this approach can achieve a gold standard accuracy of 5% according to that source: https://k38consulting.com/sales-forecast-template-simple-accurate-free/
Why this method works:
- It forces discipline around deal stages
- It reduces pure optimism
- It ties the forecast to active commercial reality
Where teams fail:
- They use arbitrary probabilities
- They do not update close dates
- They let stale deals remain in forecast categories too long
Tip: Keep probabilities on a lookup tab tied to stage names. Do not let each rep type their own percentage.
Method 5 multi-variable driver model
Sometimes neither averages nor pipeline weighting are enough.
A newer business, a retail launch, or a complex commercial model often needs a driver-based build. In Excel, that means forecast logic based on the factors you control, such as traffic, lead flow, conversion, sales capacity, product mix, or pricing.
The formula itself depends on your business. A simple structure might look like:
=Leads*Conversion_Rate*Average_Deal_Value
In a workbook, those terms usually point to assumption cells or named ranges rather than literal text. For example:
=B2*C2*D2
Where:
B2is leadsC2is conversion rateD2is average deal value
This method is useful when historical data is thin or when management wants to see the operating logic behind the top-line number.
A practical build order
Do not build all five methods into one tangled sheet.
Use this workbook structure instead:
- Raw_Actuals for historical sales
- Raw_Pipeline for CRM exports
- Assumptions for editable inputs
- Calc_Methods for side-by-side formulas
- Summary for baseline, scenario range, and commentary
That setup lets you compare outputs instead of arguing over one “magic” formula. Frequently, the best answer is not one method. It is one baseline method plus one cross-check.
Avoiding 4 Common Pitfalls in Excel Forecasting
Bad forecasts rarely fail because the math is advanced. They fail because the process is loose.

Over-optimism in deal forecasts
This is the classic problem. Reps believe deals will close because the account “sounds positive,” but the file has no mechanism to discount that optimism.
The fix is structural. Use weighted probability and scenario planning.
Coefficient’s forecasting guidance recommends combining weighted probability with a three-scenario view: baseline, best-case (+20%), and worst-case (-20%) for contingency planning: https://coefficient.io/forecasting-sales/sales-forecasting-excel
That forces the conversation away from wishful thinking and toward range management.
Frozen assumptions
A workbook can look current and still contain last quarter’s thinking.
If the business changed pricing, shifted product focus, or saw slower deal progression, but your assumptions tab stayed untouched, the forecast is already stale. Assumptions must be reviewed on a calendar cadence, not only when results disappoint.
A good habit is to add a visible “last reviewed” cell at the top of the assumptions tab and require comments for material changes.
Messy data entry
If one column uses text dates, another uses real dates, and opportunity stages are manually typed six different ways, your formulas become fragile.
Use data validation lists for stage names. Use Excel Tables so ranges expand automatically. Lock formula cells and leave input cells unlocked. Add conditional formatting to catch blanks in required fields.
If you want a stronger process for tightening forecast discipline, this article on improving forecast accuracy is a sensible reference for the operational side, not just the spreadsheet side.
Cascading formula errors
One broken reference in a forecasting workbook can distort an entire quarter.
This usually happens when analysts overwrite formulas, insert columns in the middle of legacy ranges, or copy tabs that contain hidden references. The fix is not just “be careful.” The fix is design.
Use:
- Named ranges for major assumptions
- Structured references in Excel Tables
- Separate raw data from calculation tabs
- Audit checks that compare totals across sheets
Practical rule: Add one small control section that checks whether total weighted pipeline equals the sum of weighted rows and whether summary totals match detailed tabs. It catches more errors than people expect.
Customizing Your Template for 3 Real-World Scenarios
A good forecast template changes shape based on the sales model. The same workbook structure should not be used for SaaS, retail, and an early-stage startup without modification.
SaaS revenue planning
SaaS forecasting usually fails when teams treat bookings as the final answer. Leadership cares about recurring revenue, renewal risk, expansion potential, and how those pieces change month by month.
Set the template up in layers. Track new logo ARR or MRR in one section, expansion in another, downgrades and churn in a third, then roll those into starting and ending recurring revenue. Add renewal month, contract term, and go-live timing if implementation delays affect revenue recognition. That gives you a forecast the CFO can use, not just a pipeline view for the sales meeting.
Keep one tab focused on customer movements, not just opportunities. Cohort-level visibility helps explain whether growth came from fresh acquisition, stronger retention, or larger existing accounts. If your team relies heavily on stage-based forecasting, this guide to sales pipeline management best practices is useful alongside the template work.
Retail and store-led forecasting
Retail needs a more operational model. A clean trend line is not enough if weather, promotions, staffing, local events, and stock levels all affect weekly sales.
Break the sheet down by store, product category, and time period. Then decide where to use formulas and where to use management input. Core categories with stable history can use a trend or seasonal pattern. Promotional lines usually need overrides because planned discounts or launch calendars change demand in ways historical averages miss. Inventory also needs its own check. If a store can only receive a certain amount of stock, the forecast should cap sales accordingly.
I have seen teams build highly detailed retail models that collapse because store managers stop updating them. A simpler file with clear override fields and a disciplined review rhythm usually holds up better. If you are standardizing this process across teams, retail forecasting often belongs in the same conversation as other essential business automations, especially when data has to be refreshed on a fixed schedule.
Startup and low-history forecasting
Early-stage companies rarely have enough clean history for Excel to project anything reliably. For them, a bottom-up model is usually the safer choice.
Build from controllable inputs. Start with lead volume, conversion by stage, sales cycle length, rep capacity, and average deal size. Then pressure-test each assumption against hiring plans and actual pipeline creation. A founder may want a top-line target, but the model should show what has to happen operationally for that target to be realistic.
This type of template also benefits from a manual-plus-automation approach. Analysts can build the driver logic in Excel first, then use a tool such as ElyxAI later to speed up data refreshes and keep assumptions current without rebuilding the model every month.
Key takeaway: Customize the template around revenue mechanics, operational constraints, and the level of historical data you can trust.
Automating Your Forecast in 60 Seconds with ElyxAI
Manual setup is worth learning because it teaches you the mechanics. Manual updates are a different story.

Once the workbook exists, the recurring work is usually the same. Export data. Clean fields. paste into the right tabs. Check whether formulas extended properly. Refresh visuals. Fix formatting someone accidentally broke last month.
That repetition is exactly where automation helps. If you are already thinking about wider essential business automations, forecasting is a strong candidate because the process repeats on a fixed cadence and errors are expensive.
One concrete example comes from historical averaging. Revenue Velocity Lab’s example shows quarterly revenue moving from Q1 2024 at $300,000 to Q1 2025 at $360,000, producing an average QoQ growth of 12% and a Q2 2025 forecast of $403,200 using historical averaging. The same source notes that users of ElyxAI can automate that kind of trend analysis and save 3+ hours weekly compared with manual calculations: https://optif.ai/media/articles/sales-forecasting-methods-templates/
What automation should do
Useful automation is not a chatbot explaining formulas back to you. It should execute the workbook tasks.
That means:
- cleaning imported sales exports
- matching columns to your existing template
- updating calculations
- extending formulas or table structures
- generating charts or summary views
- preserving formatting standards
If you work inside Excel often, the practical gain is consistency. You stop relying on memory for repetitive steps.
A more detailed view of this operating style appears in this article on how to automate repetitive tasks, especially for recurring spreadsheet workflows.
A quick demo helps make that concrete:
The key shift is this. You still own the model logic. Automation handles the mechanical work so you can spend your time reviewing outliers, questioning assumptions, and deciding what the number means.
From Manual Template to Automated Insight
A strong sales forecast template excel workflow is less about one formula and more about good design choices.
You need clean historicals, a disciplined pipeline input, visible assumptions, and a method that matches the business. You also need a workbook structure that survives handoffs, monthly updates, and leadership scrutiny.
Many teams get stuck in one of two places. Either they stay manual and waste time every cycle, or they automate too early without understanding the logic. The better path is to build the model once with care, then automate the recurring work around it.
If you want a starting point for that workbook design, this guide on how to create Excel templates is a practical place to begin.
3 Frequently Asked Questions
1. How often should I update my sales forecast?
Monthly is the standard rhythm for many teams because it is frequent enough to reflect current pipeline and recent actuals without turning the forecast into constant admin work. If deals move quickly, a more frequent review can make sense.
2. Can I use this template for a service-based business?
Yes. Replace unit sales with the operating drivers that matter in your business, such as projects, billable hours, signed retainers, or active client work. The structure stays the same. Only the inputs and logic drivers change.
3. My business is brand new. Which forecasting method is best?
Use a bottom-up driver model. If history is thin, trend formulas can create false confidence. Build from controllable inputs, stress-test the assumptions, and keep revising the model as real data arrives.
If you work in Excel every week and want the repetitive parts handled inside the workbook, Elyx AI is an Excel add-in that executes multi-step spreadsheet tasks from natural language prompts, including data cleaning, chart creation, formatting, and trend analysis.
Reading Excel tutorials to save time?
What if an AI did the work for you?
Describe what you need, Elyx executes it in Excel.
Sign up