How to Track Inventory in Excel: A Practical Guide

You can absolutely track your inventory in Excel. The trick is moving beyond a simple list of products and building a real system with separate tabs for your items, suppliers, and all your ins and outs—your sales and purchases. Using formulas like SUMIF and XLOOKUP, you can make Excel do the heavy lifting, automatically calculating your stock levels and creating reports that are always up-to-date.
Why Your Simple Spreadsheet Is Costing You Money
That basic spreadsheet you’re using for inventory might feel like a free and easy win, but it’s probably costing you more than you realize. So many businesses start there—a simple list of products and quantities. It works for a while, but it doesn't take long before it becomes a major source of headaches and, worse, a drain on your profits.
When your inventory data is messy, you're flying blind. You end up selling an item you don't actually have, which means an angry customer and a canceled order. Or, you miss the boat on reordering a hot-selling product because you didn't realize you were running low until it was too late. These aren't small slip-ups; they hit your bottom line directly.
Spending too much time on Excel?
Elyx AI generates your formulas and automates your tasks in seconds.
Sign up →The Hidden Costs of Manual Tracking
The heart of the problem is that a basic spreadsheet just can't give you an accurate, real-time view of what you own. This gap between what the sheet says you have and what's actually sitting on the shelf leads to all sorts of expensive problems:
- Surprise Stockouts: Nothing stings more than realizing a popular item is gone right when a customer wants it. That's a lost sale, and maybe a lost customer for good.
- Expensive Overstocking: Without good data on how fast things are selling, it’s far too easy to tie up cash in products that just sit there collecting dust.
- Costly Data Entry Errors: A single typo can wreck your entire count. This leads to placing the wrong orders and spending hours trying to figure out where the mistake happened. Keeping your data clean from the start is crucial, so it's worth reviewing some essential data cleaning best practices.
These aren't just theoretical problems. It’s pretty shocking, but even with all the modern tools available, 39% of small businesses still use manual methods or don't track inventory at all. This leads to an average inventory accuracy rate of only 66%. Think about that—one-third of their data is wrong. The fallout is real: 35% of businesses admit to shipping orders late because they sold a product that wasn't actually in stock. You can find more of these eye-opening inventory management statistics here.
The goal here isn't just to get organized; it's to turn your inventory from a source of stress into a competitive advantage. A well-built Excel system gives you the clarity to make smart, profitable decisions.
Building Your Inventory System Foundation
A solid inventory system in Excel isn't about cramming everything into one giant, overwhelming worksheet. A powerful system is built on a clean, structured foundation with a few interconnected tables, each with a specific job.
We're going to set up three core worksheets that will form the backbone of your entire tracking operation. This multi-sheet approach is the secret to tracking inventory in Excel efficiently. It neatly separates your master data—like product info and supplier details—from your day-to-day transactional data, like every sale and purchase. This separation keeps your formulas simple, your data clean, and the whole system ready to grow with your business.
Designing Your Core Worksheets
First, create three new worksheets in your Excel file. To keep things organized, name them Products, Inventory Log, and Suppliers. Each will hold specific columns designed to make tracking seamless.
- Products: Think of this as your master catalog. It holds all the static information about every item you stock—things that don't change often, like its name, SKU, and your cost.
- Inventory Log: This is where the action happens. It’s a running history of every single inventory movement, whether it’s an item received from a supplier, sold to a customer, or adjusted for any reason.
- Suppliers: This sheet is your address book for vendors. It keeps all their contact information in one place, making reordering quick and painless.
This simple diagram shows how quickly small mistakes in manual tracking can snowball into stockouts and lost revenue.
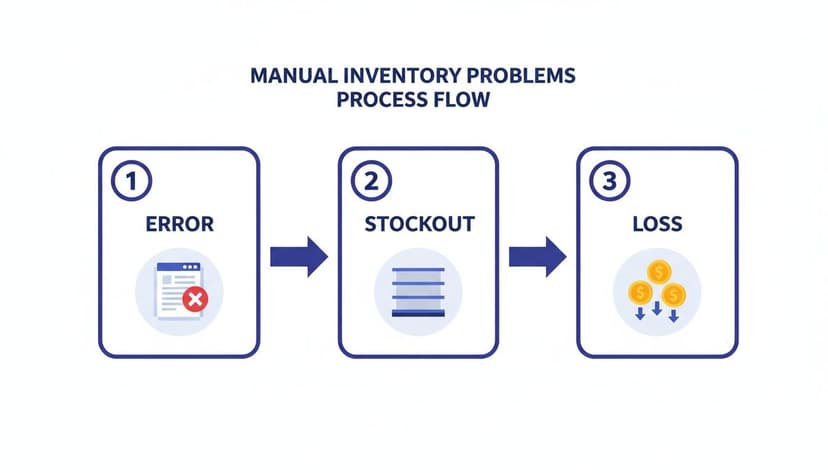
Without a structured system like the one we're building, it’s not a matter of if a data entry error will cause a problem, but when.
The Power of Excel Tables
Before we dive into the specific columns, let's talk about one of the most important (and often overlooked) features in Excel: Tables. Once you've laid out your columns and added your first row of data, you need to turn that range into an official Excel Table. It’s easy—just click any cell in your data and press Ctrl + T (Cmd + T on a Mac).
Why is this so critical? Excel Tables are dynamic. When you add a new sale or product, the table automatically expands. Any formula referencing that table instantly includes the new data. This completely eliminates the need to manually update formula ranges, which is where so many spreadsheet errors come from.
By converting your data into Tables, you're not just formatting it; you're transforming it into a structured database that Excel can understand and manage far more intelligently. This single step is the difference between a static list and a dynamic tracking system.
To get the most out of your setup, it helps to be familiar with general inventory management best practices that can guide your decisions.
Essential Columns for Your Worksheets
Now, let's get specific and define the columns for each of our three tables. Getting this structure right from the start is the key to accurate reporting and easy automation down the line.
The following table breaks down the fields you’ll need for your Products, Inventory Log, and Suppliers worksheets. These columns are designed to work together, creating a robust system where data flows logically from one table to the next.
| Worksheet | Column Name | Description & Example | Data Type |
|---|---|---|---|
| Products | SKU | Unique product code. This is essential. Ex: TSHIRT-BL-LG | Text |
| Products | Product_Name | Clear, descriptive name. Ex: Men's Blue T-Shirt, Large | Text |
| Products | Category | Group for analysis. Ex: Apparel, Drinkware | Text |
| Products | Unit_Cost | Your cost for one unit. Ex: 8.50 | Currency |
| Inventory Log | Date | The date of the transaction. Ex: 2024-10-26 | Date |
| Inventory Log | SKU | Links to the Products table. Ex: TSHIRT-BL-LG | Text |
| Inventory Log | Transaction_Type | Defines the movement. Ex: Sale, Purchase, Adjustment | Text |
| Inventory Log | Quantity | Units moved. Ex: 15 (for Purchase), -5 (for Sale) | Number |
| Inventory Log | Notes | Optional details. Ex: Damaged in transit | Text |
| Suppliers | Supplier_ID | Unique identifier for the vendor. Ex: SUP-001 | Text |
| Suppliers | Supplier_Name | The company's name. Ex: Quality Apparel Inc. | Text |
| Suppliers | Contact_Person | Your main contact. Ex: Jane Doe | Text |
| Suppliers | Contact_Email | Email for reordering. Ex: [email protected] | Text |
With these columns in place, you’ve built a solid, relational database right inside Excel. Your SKU and Supplier_ID columns are the glue that holds everything together.
The next step is to bring this data to life with formulas that connect these tables and give you real-time insights. As you start populating these sheets, you'll quickly realize how tedious manual entry can be. It’s worth looking into how to automate data entry to speed things up and cut down on human error.
Powering Your System With Key Formulas
With the groundwork laid, it's time to let a few smart Excel formulas do the heavy lifting. These functions will turn your static data into a dynamic system that calculates stock levels, pulls product details, and flags items for reorder automatically.
This is where Excel begins to work for you. Instead of manually counting and cross-referencing, these formulas provide the real-time insights you need to manage your inventory effectively.
Calculating Current Stock with SUMIF
The most fundamental question is, "How many of these do I have right now?" For that, the SUMIF function is your go-to tool. It scans your entire Inventory Log, finds all transactions for a specific product, and adds up the quantities.
To implement this, you'll add a new column called Stock_on_Hand to your Products table.
Pro Tip: When you log transactions, enter sales as negative numbers (e.g., -5) and purchases as positive numbers (e.g., 20). This trick simplifies your stock calculation down to a single, elegant
SUMIFformula.
With this method, the formula for the Stock_on_Hand column is:=SUMIF(Inventory_Log[SKU], [@SKU], Inventory_Log[Quantity])
Let's break it down:
Inventory_Log[SKU]: This is the range where the formula will look for a match (the SKU column in your log).[@SKU]: This is the specific SKU from the current row in the Products table that you want to find.Inventory_Log[Quantity]: This is the range of numbers to add up. Because sales are negative and purchases are positive, this single function calculates the current total.
Pulling Product Details with XLOOKUP
Manually copying product names or prices from one sheet to another is a recipe for error. XLOOKUP is an essential function that lets you find a value in one table (like an SKU) and pull related information from another (like the product name or supplier).
Imagine you're building a quick sales report and only have a list of SKUs. Instead of flipping between sheets, XLOOKUP can populate product names automatically.
The syntax for XLOOKUP is:=XLOOKUP(lookup_value, lookup_array, return_array, [if_not_found])
Let's see it in action. If you have an SKU in cell G2 and want to find its name from the Products table, the formula would be:=XLOOKUP(G2, Products[SKU], Products[Product_Name], "Not Found")
Here's the detailed explanation:
lookup_value: The value you're looking for (G2).lookup_array: The column where Excel should search for that value (Products[SKU]).return_array: The column containing the information you want back (Products[Product_Name]).[if_not_found]: An optional argument that displays a message like"Not Found"if the SKU doesn't exist, preventing errors.
Creating Automated Reorder Alerts with IF
Knowing you're low on stock is one thing; having to manually check is another. A simple IF formula can build an automatic alert system that flags items as soon as their stock level dips below a certain threshold.
To set this up, add two columns to your Products sheet: Reorder_Point and Reorder_Status.
- Reorder_Point: A number you set for each product. For a hot-selling item, it might be 20 units; for a slower one, maybe 5.
- Reorder_Status: This is where the automation happens. An
IFformula will check ifStock_on_Handis less than or equal to theReorder_Point.
The formula is as simple as this:=IF([@Stock_on_Hand]<=[@Reorder_Point], "Reorder", "OK")
Here's a detailed breakdown:
[@Stock_on_Hand]<=[@Reorder_Point]: This is the logical test. The formula checks if the value in theStock_on_Handcolumn is less than or equal to theReorder_Pointin the same row."Reorder": This is the value returned if the logical test is TRUE."OK": This is the value returned if the logical test is FALSE.
Now, you can see at a glance which products need attention. Even better, you can combine this with Excel's Conditional Formatting to automatically highlight any row with a "Reorder" status in red.
To take your system even further, check out our guide on essential inventory management formulas that can save you hours of work.
Making Your System Smarter with Automation and AI

With a solid, formula-driven system in place, it's time to make it truly intelligent. We can now combine native Excel tools with the power of artificial intelligence to prevent mistakes, guide actions, and automate repetitive tasks.
This approach makes your inventory tracker more robust and less vulnerable to the simple human errors that can disrupt your entire system.
Stop Errors Before They Happen with Data Validation
A single typo can break formulas and throw off your stock counts. The Transaction_Type column in your Inventory Log, for instance, is critical. Mistyping "Slae" instead of "Sale" will cause your SUMIF function to miss that transaction. Excel's Data Validation feature prevents this.
Think of it as setting rules for your cells. You can create a dropdown menu to force a choice between "Sale," "Purchase," or "Adjustment."
Here's how to set it up:
- Select the entire
Transaction_Typecolumn. - Go to the Data tab and click Data Validation.
- Under "Allow," choose List.
- In the "Source" box, type:
Sale,Purchase,Adjustment
Now, data entry in this column is restricted to the predefined list, ensuring consistency and keeping your formulas accurate. You can apply the same logic to your SKU column by linking its source directly to the SKU column in your Products table, making it impossible to log a transaction for a non-existent item.
Make Important Data Jump Off the Page with Conditional Formatting
We already built a basic "Reorder" flag with an IF formula, but it's easy to overlook plain text. Conditional Formatting makes these alerts impossible to ignore by changing a cell's appearance based on its value.
For example, you can set a rule on your Products sheet to instantly highlight an entire row in red the moment its Reorder_Status changes to "Reorder."
This is a game-changer. It turns your passive list of numbers into an active dashboard that practically screams for attention right when it's needed. It's a simple visual trick that helps you dodge costly stockouts.
This feature adds a powerful layer of at-a-glance insight, helping you identify critical issues like low stock or slow-moving products immediately.
Put Your Tasks on Autopilot with an AI Assistant
While Excel's built-in features are powerful, the next leap in efficiency comes from integrating an AI assistant directly into your workflow. Tools like Elyx.AI act like a data analyst sitting next to you, ready to handle complex tasks that normally consume hours.
Instead of struggling with complex formulas or manually cleaning data, you can simply ask the AI for what you need in plain English. This makes advanced Excel functions accessible to everyone and saves a tremendous amount of time.
Consider these practical examples:
- "Write an
XLOOKUPformula to get the supplier's email for SKU TSHIRT-BL-LG from the Suppliers table." - "Clean the imported sales data: remove all duplicate rows and format the 'Order Date' column to DD-MM-YYYY."
- "Build a pivot table summarizing total sales quantity by product category for Q3."
An AI agent executes these requests in seconds. It writes the formulas, cleans the data, and builds the reports for you. This not only slashes the chance of error but frees you up to analyze what the data is telling you, rather than wrestling with the spreadsheet itself.
Creating Your Interactive Inventory Dashboard

All the structured data and formulas we've built are the engine of your inventory system. But to truly understand what’s happening, you need to visualize your data. An interactive dashboard turns your spreadsheet into a command center for making smarter, faster decisions.
A good dashboard provides key metrics at a glance, allowing you to spot trends, identify top-selling products, and monitor the overall health of your stock. The best tool for this job is already built into Excel: the Pivot Table.
Building Your First Inventory Reports
Pivot Tables are your secret weapon for making sense of large datasets. They let you quickly summarize, group, and analyze your Inventory Log to answer important business questions—all by dragging and dropping fields instead of writing complex formulas.
Let's build a few essential reports. Click anywhere inside your Inventory Log table, go to the Insert tab, and select PivotTable. Excel will open a new sheet, ready for you to start analyzing.
Here are three foundational reports you can create in minutes:
- Best-Selling Products: Drag
Product_Nameto the Rows area andQuantityto the Values area. Instantly, you have a summarized list of every item sold. - Sales Trends by Month: Put
Datein the Rows field andQuantityin Values. Excel automatically groups the dates by month, giving you a clear view of sales performance over time. - Total Inventory Value: This requires data from multiple tables. If you’ve set up a Data Model, you can drag
Categoryfrom your Products table to Rows and use a calculated measure forTotal_Valuein the Values area.
These reports are the building blocks of your dashboard. If you want to dive deeper, our comprehensive Excel Pivot Table tutorial is a great next step.
Making Your Dashboard Interactive with Slicers
Static reports are good, but an interactive dashboard is a game-changer. Slicers are user-friendly filter buttons that allow anyone to slice and dice the data in your Pivot Tables without needing to be an Excel expert.
Let’s say you have a Pivot Table showing sales by product. You can add a Slicer to filter it by category.
- Click inside your Pivot Table.
- Go to the PivotTable Analyze tab and click Insert Slicer.
- A dialog box will appear. Check the field you want to filter by, such as Category or Supplier_Name.
Excel will create a clickable menu. Now, when you click "Apparel," every connected chart and table instantly updates to show data for only apparel items. It transforms a simple report into a powerful, self-service analytical tool.
The real value of an interactive dashboard is its ability to provide instant answers. When you can filter your entire inventory's performance with a single click, you empower your team to explore data and uncover insights on their own.
The AI Shortcut to Instant Visualization
While building Pivot Tables and charts is a valuable skill, it can be time-consuming. An AI assistant like Elyx.AI can change the game, allowing you to focus on the insights rather than the process.
Instead of clicking through menus, you can simply ask for what you need.
For example, open the Elyx.AI chat panel in Excel and type a simple prompt:
"Create a pivot chart showing sales quantity by product category for the last quarter."
The AI gets to work. It analyzes your Inventory Log, identifies the relevant columns (Date, Quantity, Category), filters for the correct timeframe, builds the Pivot Table, and generates a professional chart—all in seconds. This fundamentally shifts your role from report builder to decision-maker, letting you act on insights the moment you find them.
Answering Your Top Excel Inventory Questions
Once your Excel inventory system is operational, you'll encounter real-world challenges. It’s one thing to have a clean spreadsheet, but another to manage the day-to-day complexities of a business. Let's address some common questions.
A frequent issue is handling product returns. The best approach is to treat a return as a standard transaction. In your Inventory Log, create a new transaction type called "Return." When a customer returns an item, you log it with a positive quantity, just as you would with a purchase. This simple practice ensures your inventory counts remain accurate.
How Do I Manage Stock Across Multiple Locations?
What happens when you store products in more than one place, like a main warehouse and a retail shop? This is a great problem to have, as it signifies growth. Your existing system can handle this with a minor tweak.
Simply add a "Location" column to your Inventory Log. From then on, every transaction—sale, purchase, or adjustment—is tagged with both an SKU and a location. This small change unlocks powerful reporting capabilities. You can now build Pivot Tables that show stock levels for any product, broken down by location, preventing you from selling an item from one location that is actually stored in another.
My best advice is to add complexity only when you absolutely need it. It’s far easier to add a ‘Location’ column when the time comes than to build an overly complicated system from day one that you don’t even use.
When Have I Outgrown Excel?
Excel is incredibly powerful, but it has its limits. So, how do you know when it’s time to switch to dedicated inventory management software? The decision usually comes down to two factors: scale and collaboration.
It's likely time for a new tool if you relate to these points:
- You need real-time updates. If multiple people need to update inventory simultaneously from different locations, Excel becomes a bottleneck.
- Your spreadsheet is slow. When your transaction log grows to tens of thousands of rows, Excel can become sluggish and prone to crashing.
- You need advanced features. Dedicated systems offer features like barcode scanner integration, direct connections to e-commerce platforms like Shopify, and seamless integration with accounting software—features that are difficult to replicate in Excel.
For those who need more power without becoming formula experts, AI tools can be a fantastic bridge. A simple, plain-English prompt like, "Show me the total stock for SKU 12345 at the warehouse location," can pull the exact data you need, no complex formulas required.
Ready to stop wrestling with formulas and let an AI do the heavy lifting? Elyx.AI is an autonomous agent that executes complete workflows inside your spreadsheets from simple text commands. Clean data, build reports, and get insights in seconds. Start your free trial at https://getelyxai.com and see how much time you can save.
Reading Excel tutorials to save time?
What if an AI did the work for you?
Describe what you need, Elyx executes it in Excel.
Sign up