How to Manage Business Expenses with Excel and AI

Taming your business expenses boils down to three key steps: setting clear rules, tracking everything meticulously in Excel, and then analyzing the data to understand what it tells you. This framework takes you from reacting to bills to strategically managing your cash flow. It also sets the stage for using artificial intelligence to automate tasks and find deeper insights directly within your spreadsheets.
Build Your Expense Management Foundation in Excel
Managing expenses can feel like sorting a mountain of random receipts and messy spreadsheets. But getting control doesn't require expensive, complex software. The first step is building a solid foundation with a clear policy and a well-organized Excel workbook. Think of this workbook as your command center for every dollar spent.
This process is a logical flow. You start with the rules, organize your spending data according to those rules, and then analyze that clean data to make smarter decisions.
Spending too much time on Excel?
Elyx AI generates your formulas and automates your tasks in seconds.
Sign up →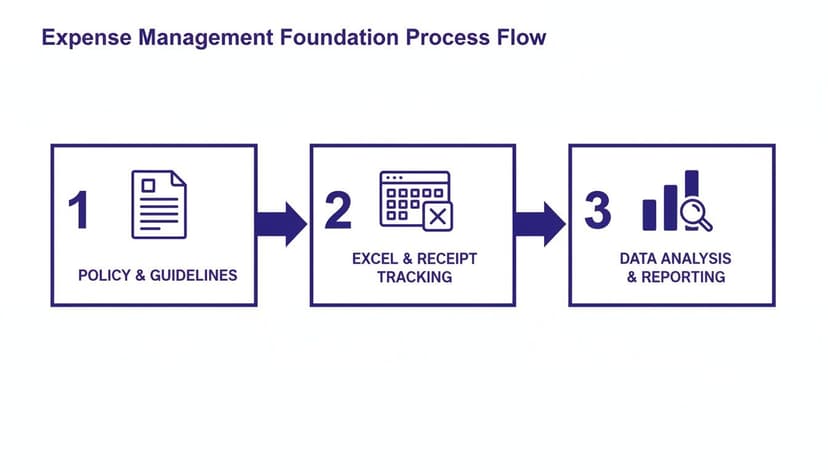
Each part builds on the one before it, ensuring that when you get to the analysis stage, you're working with information that's accurate, consistent, and follows company guidelines. This is crucial for both manual analysis and for getting reliable results from AI tools.
Define Your Expense Management Policy
Before you open a new spreadsheet, you need a rulebook. A simple, practical expense policy is your best friend for eliminating confusion and ensuring everyone is on the same page, whether you're a solopreneur or leading a team. A great policy isn't about length; it's about clarity.
At a minimum, your policy should spell out:
- What counts as a reimbursable expense? Be specific about what the company will cover, from software tools and office supplies to client dinners.
- What are the spending limits? Put clear dollar caps on common categories like meals, airfare, and hotels. This is a simple way to prevent overspending.
- What's the submission process? Explain exactly how and when expenses need to be submitted. What documentation is required? Digital receipts? Physical copies?
A well-defined policy is your first line of defense against uncontrolled spending. It sets expectations and creates a culture of financial accountability, making the Excel tracking process much smoother.
Set Up a Centralized Excel Workbook
With your policy in hand, it's time to build your tracking system in Excel. This workbook is more than a simple list of transactions; it's a structured database you'll use for analysis. The effort you put into getting your data entry right at this stage will pay off massively when you want to pull insights, especially when using AI.
Creating this "single source of truth" means no more hunting for spending data scattered across random files or emails. Consistency here is everything. Make sure every entry follows the same format. For example, decide on one date format, like YYYY-MM-DD, and stick to it. Standardize vendor names so "Acme Inc." and "Acme Incorporated" don't show up as two different suppliers.
This kind of data discipline is non-negotiable for accurate reporting. For a deeper dive, our guide on data cleaning best practices is a lifesaver and will prevent headaches later on. Getting the data structure right is the single most important step for enabling future automation.
Create a Dynamic Expense Tracker from Scratch
Off-the-shelf templates are a decent starting point, but they rarely fit the way your business actually works. To really get a handle on your expenses, you need a system that adapts to you. We're going to build a smart, dynamic expense tracker right in Excel that’s both powerful and easy to maintain.
This isn't just about making a digital list of what you've spent. We're building a tool with built-in safeguards to prevent common mistakes, giving you a real-time snapshot of your company's financial health.
Laying the Groundwork: The Columns That Matter
The foundation of any good tracker is its structure. If you pick the right columns from the get-go, your data will be clean, organized, and ready for analysis. Miss a key data point now, and you’re setting yourself up for a reporting headache later on.
To build a tracker that gives you clarity, you need key columns to capture the full story of each transaction. Here’s a breakdown of the essential fields for your spreadsheet.
Essential Columns for Your Excel Expense Tracker
This table outlines the crucial data points to include in your expense tracking spreadsheet for effective analysis and reporting.
| Column Name | Data Type | Purpose & Example |
|---|---|---|
| Date | Date | The exact date the expense was incurred. Example: 10/26/2023 |
| Category | Dropdown List | A predefined list for consistent grouping. Example: Software, Marketing, Travel |
| Vendor/Supplier | Text | The name of the company or person you paid. Example: Adobe Inc. |
| Description | Text | A brief note about the specific purchase. Example: Annual Creative Cloud subscription |
| Amount | Currency | The total cost of the expense, including any taxes. Example: $650.00 |
| Payment Method | Dropdown List | How it was paid. Example: Company Card, Bank Transfer, Petty Cash |
| Employee/Project | Text/Dropdown | Identifies who incurred the expense or the project it belongs to. Example: John Doe / Q4 Launch Campaign |
| Receipt Link | Hyperlink | A link to a digital copy of the receipt (e.g., in Google Drive). Example: View Receipt |
Getting this structure right means you can answer the critical questions—who, what, where, when, and why—for every dollar you spend.
Stop Errors Before They Start with Data Validation
One of the biggest headaches in expense management is messy, inconsistent data. One person logs an expense under "Software," another uses "SaaS," and a third types "Monthly Subscriptions." These differences make accurate reporting nearly impossible.
This is where Excel's Data Validation feature is a game-changer.
By creating dropdown lists for columns like 'Category' and 'Payment Method,' you force everyone to use the same terms. No more typos or creative variations. Every entry is clean and standardized from the start.
Here’s how to set it up:
- First, create a new sheet in your workbook and name it 'Lists.' In column A, type out your expense categories (Software, Marketing, Travel, etc.).
- Now, go back to your main tracker sheet and select the entire 'Category' column.
- Head to the Data tab and click on Data Validation.
- Under 'Allow,' choose List. For the 'Source,' enter the formula referencing your new list, like
=Lists!$A$1:$A$10.
Just like that, anyone entering data in that column now has to choose from your approved list. The hours you'll save on manual cleanup are massive. If you're looking for more ways to cut down on manual work, our guide on how to automate data entry in Excel is a great next read.
Build a Live Summary Dashboard with Formulas
A long list of expenses is just raw data. The magic happens when you summarize it into something useful. You can build a simple dashboard right at the top of your sheet (or on a separate tab) that updates automatically as new expenses are added.
Your go-to tool for this is the SUMIFS formula.
Unlike a basic SUM, SUMIFS lets you add up numbers that meet several conditions at once. For example, you can instantly see the total spent on "Marketing" that was paid with the "Company Card."
Here’s a practical formula to calculate your total marketing spend:=SUMIFS(E:E, B:B, "Marketing")
Here is a detailed explanation of the formula:
E:Erefers to the entire column E, which is the range you want to sum (your 'Amount' column).B:Brefers to the entire column B, which is the range Excel will check for your criteria (your 'Category' column)."Marketing"is the specific text Excel looks for in column B. The formula will only sum the amounts in rows where the category is "Marketing".
You can create a small table listing all your categories and use this formula for each one. Suddenly, you have a live summary of spending by department that's always up to date.
Your goal is to build a system that works for you, not one that creates more work. By using Excel's built-in tools like data validation and formulas, you transform a static spreadsheet into an active financial management tool.
Make Important Data Pop with Conditional Formatting
Finally, let’s make the crucial information jump right off the page with Conditional Formatting. This feature automatically changes a cell's appearance based on its value, making it a fantastic tool for spotting trends, outliers, or problems at a glance.
You can set up simple rules to:
- Flag big-ticket items: Automatically highlight any expense over $500 in red.
- Spot missing receipts: Color cells in the 'Receipt Link' column yellow if they're empty, creating a visual to-do list.
- Identify unusual payments: Highlight transactions with vendors that aren't on your pre-approved list.
This visual layer turns your spreadsheet from a passive record into a proactive monitoring system, drawing your attention exactly where it's needed most.
Use AI to Automate Your Expense Analysis in Excel
Once you have a clean, well-structured expense tracker, you’ve done the heavy lifting. The next step is to move from logging data to analyzing it. This is where artificial intelligence can turn your spreadsheet from a simple logbook into a powerful analytical partner. Forget the steep learning curve of pivot tables or complex formulas; the real magic happens when you can use plain English to get instant answers from your data.
This shift changes how you approach expense management. Instead of spending hours sifting through rows and columns, you can simply ask for insights. It’s not just about saving time—it’s about turning a historical record into a tool that helps you make smarter decisions.
From Data Entry to Data Conversation
The new way to handle Excel analysis feels more like having a conversation with your data. AI tools like Elyx.AI work as an intelligent assistant right inside your spreadsheet, understanding what you ask and getting it done instantly. This means you can literally chat with your expense report.
Let's say you need a quick breakdown of your spending for the third quarter. The old way involved manually filtering data, building a chart, and formatting it. Now, you can just type a simple prompt.
Prompt Example: "Generate a pie chart of expenses by category for Q3 and format it with a professional color scheme."
The AI takes care of everything—it filters the dates, groups the categories, calculates the totals, and creates a polished, ready-to-use chart. A task that used to take 15 minutes is now done in seconds. This speed means you can ask more questions and dig deeper into your data without getting bogged down by manual work.
Asking Smarter Questions for Deeper Insights
An AI assistant really shines when you start asking it more complex questions. As you get more comfortable, you can ask for sophisticated analysis that would have been a headache to do by hand.
For example, identifying your biggest cost centers is a critical task. You could ask:
- "Which vendor did we pay the most last month, and what was the total?"
- "Show me our top 5 expense categories by total spending for the year."
- "List all travel expenses for the sales team in Q4 and calculate the average cost per trip."
Each of these questions gives you immediate, actionable information. You can spot budget overruns, see which supplier relationships are most important, and understand spending patterns across departments without writing a single formula. You can also ask follow-up questions. You might start by finding your top vendor and then ask, "Now, break down our spending with that vendor by month."
Automating Complex Workflows with a Single Prompt
The biggest impact AI has in Excel is its ability to automate entire workflows from just one command. This is where you go beyond simple analysis and start thinking about strategic data management. Imagine you've just imported a raw data file from your bank—it's usually a mess.
Here’s a look at what an AI-powered assistant can pull off.
This screenshot shows how you can ask the tool to perform a series of tasks in one go, just by typing it out.
You could give it a multi-step instruction like this:
Advanced Prompt Example: "Clean this imported expense data by removing duplicates and standardizing date formats. Then, flag all transactions over $500 and create a summary report formatted for our weekly meeting."
In a flash, the AI gets to work: it removes duplicates, formats dates, highlights large transactions, and generates a clean summary table. This is autonomous data processing. You've effectively handed off the most tedious parts of expense management, freeing yourself up to focus on what the numbers actually mean.
If you want to dig deeper, understanding the core ideas behind using AI in Excel can unlock even more ways to automate your work.
The Business Impact of AI-Driven Expense Management
Bringing AI into your Excel workflow is more than just an upgrade; it’s a strategic advantage. According to the Expense Management Trends Report 2025, businesses that automate their expense management slash processing times by 60% and cut overall costs by 35%.
By letting an AI handle the repetitive grind of cleaning, analyzing, and reporting on data, you empower your team to focus on work that actually matters. They can spend their time interpreting trends, questioning anomalies, and delivering the strategic insights that help the business grow.
From Tedious Task to Strategic Tool: Nailing Reconciliation and Reporting
Reconciliation is the part of expense management most people dread. It’s the painstaking process of ensuring your Excel records line up with your bank statements. But this is where all your hard work pays off. A solid reconciliation process isn't just about catching errors; it's about turning raw data into real business intelligence.
We're going to move past the painful, line-by-line manual checks and use smart Excel and AI techniques to get this done quickly and accurately.

This way, you spend less time being a financial detective and more time understanding what the numbers are actually telling you.
Spotting Discrepancies in Minutes, Not Hours
The foundational step is comparing your expense tracker against your monthly bank and credit card statements. Doing this by hand is a recipe for missed transactions and headaches. This is a perfect job for automation.
First, get your data into one Excel workbook. Put your expense tracker records on one sheet and your downloaded bank statement on another. From there, a simple prompt to an AI assistant can do the heavy lifting. And remember, simplifying starts even before this step; getting some insights on company expense cards for efficient spending can help consolidate transactions, making this whole process cleaner.
A Prompt That Works: "Compare 'Sheet1' (my expense tracker) with 'Sheet2' (my bank statement). Match transactions based on the 'Amount' and 'Date' columns. Highlight any transactions that appear in one sheet but not the other."
This one command tells the AI to do what used to take hours of manual ticking. It will instantly flag any rogue transactions, duplicate charges, or missing entries. For anyone who prefers to stick with formulas, our guide on how to compare two Excel sheets breaks down the more traditional methods.
Generate Reports with Simple English
Once your data is clean and reconciled, getting the reports you need should be the easy part. Forget wrestling with pivot tables from scratch every month. Instead, you can just ask for what you need using plain language.
This isn't just a time-saver; it’s a strategic shift. The global expense management software market is expected to reach nearly $17 billion by 2032, a clear sign that businesses are scrambling for the efficiency that manual methods can't deliver.
Think about the reports you run all the time:
- How much did the marketing team spend this month?
- Are we over or under budget for Q2?
- What's the total cost for Project Alpha so far?
Now, picture getting those answers just by asking.
AI Reporting Prompt Example: "Prepare a monthly expense summary for the Marketing department, compare it to the budget column, and highlight any variances over 10% in red."
The AI can pull the right data, run the numbers, and format the report exactly as you asked—instantly. This gives you the power to check in on your financials whenever you want, not just at the end of the month.
Build a Live Cash Flow Dashboard in Excel
While reports are great for looking back, a dashboard gives you a live look at your financial pulse. You can set up a powerful dashboard right in Excel that pulls information directly from your reconciled expense data.
Create a new sheet in your workbook to serve as your dashboard. Here, you'll use a few simple formulas to summarize the most important numbers, and they'll update automatically as you add new expenses.
Key Metrics to Track on Your Dashboard:
- Total Monthly Expenses: A straightforward
=SUM(Expenses!E:E)formula pointing to your 'Amount' column. - Spending by Category: Use
SUMIFSto break down totals for key areas like 'Software,' 'Marketing,' and 'Travel.' - Budget vs. Actual: Add a column to calculate the difference between what you planned to spend and what you actually spent for each category.
A live dashboard transforms your expense tracker from a historical log into a dynamic, forward-looking tool. It gives you an immediate, visual answer to the most critical question: "Where is our money going right now?"
By combining quick AI-powered reconciliation with on-demand reports and a live dashboard, you create a comprehensive system that ensures your numbers are always accurate and gives you the continuous visibility needed to make smarter, faster decisions.
Stay Compliant and Breeze Through Tax Season
Managing business expenses well goes beyond just watching your budget. It’s about building a solid, reliable system that keeps you compliant and turns tax season from a chaotic scramble into a smooth, stress-free process. An organized system is your best defense against audits, ensuring you can confidently claim every deduction you're entitled to.
This is more important than ever, especially with costs like business travel on the rise. Global business travel spending is projected to hit $1.57 trillion by 2025. You can dig into the details of this trend in the GBTA forecast analysis. With an AI assistant in Excel, you can drop in your travel receipts and ask, "Analyze travel expenses by region and highlight variances against the budget." Just like that, you've turned a pile of raw data into a compliant, insightful report.

Create a Bulletproof Digital Receipt Archive
A rock-solid documentation process is the bedrock of compliance. Losing one receipt for a significant purchase could mean missing a valuable tax deduction. The best way to avoid this is to build a digital archive and link it directly to your Excel tracker.
Set up a dedicated folder in a cloud service like Google Drive or OneDrive. Inside, create subfolders for each month. Whenever you log an expense, save the digital receipt there using a consistent naming format, like YYYY-MM-DD_Vendor_Amount.
Then, back in your Excel sheet, use the HYPERLINK function to connect each expense entry directly to its digital receipt.
Here’s the formula:=HYPERLINK("C:\Receipts\2023-10-26_Adobe_$650.pdf", "View Receipt")
Here is a detailed explanation of the formula:
"C:\Receipts\..."is the first argument, which is the file path to your saved receipt. You can also use a URL if you're storing files in the cloud."View Receipt"is the second (optional) argument, which determines the clean, clickable text that appears in the cell.
With this step, your spreadsheet becomes an organized, audit-ready database.
Use AI to Spot Compliance Risks Before They Become Problems
Manually checking every expense for policy violations is a mind-numbing task. An AI assistant can become your automated compliance officer, scanning your data for red flags in seconds.
You can give it direct commands to find common issues:
- Missing Paperwork: "Highlight all rows where the 'Receipt Link' column is empty."
- Policy Breaches: "Flag any 'Meals' expenses that are over our $75 policy limit."
- Odd Timing: "Identify all transactions that happened on a Saturday or Sunday and list them for me to review."
This proactive approach means you catch compliance issues as they happen, not months later during a high-pressure audit. You can stop being a manual reviewer and start being a strategic manager, focusing only on the exceptions that need your attention.
Categorize for Maximum Tax Deductions
To get the most out of your tax write-offs, your expense categories need to mirror what the IRS considers deductible. Don't settle for a generic label like "Travel." Get granular with subcategories like "Airfare," "Lodging," and "Business Meals." This makes tallying up totals for your tax forms incredibly easy.
Make sure to add these specific categories to your data validation dropdown list in Excel. That way, every expense is classified correctly from the start. When tax time comes, a quick AI prompt like, "Calculate the total spend for 'Business Meals' and 'Software Subscriptions' for the full year," will give you the exact figures you need instantly.
For more hands-on advice on getting your records in order, our comprehensive audit preparation checklist is a great place to start.
Common Questions About Managing Business Expenses in Excel
Even with a solid plan, practical questions are bound to come up. Let's walk through some of the most common hurdles, from handling foreign currencies to getting your team on board with the new system.
Getting ahead of these common issues will save you a ton of headaches down the road.
How Should I Handle Multi-Currency Expenses?
This is a big one, especially with international clients or suppliers. The trick is to standardize everything into your primary business currency right inside your Excel tracker to keep all reporting consistent.
Start by adding two new columns to your expense log: 'Original Amount' and 'Original Currency.' So, if you have a receipt for €100, you’d log 100 in the 'Original Amount' column and EUR in the 'Original Currency' column. The main 'Amount' column is where you'll put the converted value in your home currency (e.g., USD).
You have a few ways to get that conversion done:
- Go Manual: Look up the exchange rate for the transaction date and plug it in. It's simple and direct, but tedious.
- Ask Your AI Assistant: This is the fastest method. Just ask your AI tool, "Convert 100 EUR to USD based on the exchange rate for October 26, 2023."
- Use an Excel Formula: If your version of Excel supports it, the
GET.EXCHANGE.RATEformula (or similar, depending on add-ins) can pull rates automatically. - Set Up an Automated Feed: Use Power Query to link to a live exchange rate API. This automatically pulls in the latest rates, so your conversions are always up-to-date.
By converting every expense to a single base currency the moment you log it, you ensure your financial reports are telling the truth and give you a clear picture of your total spending.
What's the Best Way to Get My Team to Adopt This System?
Nobody gets excited about a new administrative process. The key to getting your team on board is to make the new system incredibly easy to use and to show them what's in it for them.
First, explain the "why." Don't just drop a new spreadsheet on them. Explain how better tracking keeps the company financially healthy and helps them get reimbursed faster.
Next, simplicity is everything. Your Excel template should be clean, with clear instructions. Use those data validation dropdowns we talked about to reduce typing and prevent mistakes. A simple one-page guide with clear examples can work wonders. If you're looking for more ideas, you'll find some great effective small business expense tracking tips.
Finally, lead by example. When managers use the system consistently, it sends a clear message that this is the new standard.
How Can I Scale My Excel Tracker as My Business Grows?
It’s a valid concern—will this Excel system buckle under the pressure as your company grows? While huge corporations will eventually need dedicated software, a well-built Excel workbook can handle a surprising amount of data.
Here’s how to keep your spreadsheet from slowing to a crawl:
- Separate Data from Reports: Keep your raw expense entries on one sheet and build your dashboards and summaries on another. This stops Excel from recalculating everything every time you add a new expense.
- Archive Old Data: At the end of each fiscal year, copy that year's data into a separate "Archive" workbook. This keeps your main file lean and fast.
- Avoid Volatile Formulas: Functions like
NOW(),TODAY(), andOFFSETrecalculate every time any cell changes and can slow down large files. Use them sparingly. - Lean on AI for Analysis: Instead of cluttering your spreadsheet with dozens of complex, formula-heavy reports, keep the raw data clean. When you need analysis, just ask your AI assistant to generate it on the fly. This keeps your file size small and performance snappy.
With these practices, your Excel system can be a powerful and scalable tool that grows right alongside your business.
Ready to stop wrestling with spreadsheets and let AI do the heavy lifting? Elyx.AI acts as your autonomous data expert right inside Excel, handling everything from data cleaning to report generation with a single command. Save hours each week and get the insights you need, faster than ever.
Start your free trial of Elyx.AI today!
Reading Excel tutorials to save time?
What if an AI did the work for you?
Describe what you need, Elyx executes it in Excel.
Sign up