How to Calculate Net Present Value in Excel: An AI-Powered Guide

Calculating Net Present Value (NPV) is a core skill for making smart financial decisions. It's a method for taking all the future cash you expect from an investment—both the money coming in and the money going out—and figuring out what it’s worth in today's dollars. After you've done that, you subtract your initial investment.
If you end up with a positive NPV, you’re looking at a potentially profitable venture. A negative number, on the other hand, suggests the costs will likely outweigh the returns. This guide will walk you through how to calculate NPV step-by-step in Excel and demonstrate how AI can make the process faster and more insightful.
What Is Net Present Value and Why Does It Matter

Spending too much time on Excel?
Elyx AI generates your formulas and automates your tasks in seconds.
Sign up →At its heart, NPV answers a single, critical question: will this investment create more value than it costs? It accomplishes this by translating all future money into its present-day equivalent, giving you one clear number to guide your thinking.
The entire concept hinges on the time value of money. Simply put, a dollar today is worth more than a dollar you’ll receive next year. Why? Because you can invest that dollar today and earn a return on it. NPV is the tool that systematically applies this principle to investment analysis.
The Power of a Single Number
Let's say you're a project manager trying to choose between two different technology upgrades. Project A offers quick, modest returns. Project B promises much larger payouts, but they’re spread out over a longer timeline. Comparing them directly is tough because the timing of the money is completely different.
This is where NPV shines. By discounting all future cash flows back to their present value, it puts every potential dollar on a level playing field. The result is one number that tells you the total value an investment is expected to add to—or subtract from—your business.
Key Takeaway: A positive NPV means the project is projected to earn a return greater than your required rate (the discount rate). A negative NPV means it's expected to earn less.
From Historical Concept to Modern Standard
NPV isn't some new-fangled idea. Its origins trace back to engineering journals in the early 1900s as a method for evaluating projects with inconsistent cash flows. Over the decades, it has become a cornerstone of corporate finance.
In fact, a 2002 survey revealed that a staggering 85.1% of firms were using NPV for their capital budgeting decisions. It's a trusted tool for major players, too; giants like Google's parent company, Alphabet, reportedly rely on it for their most significant financial choices.
Connecting NPV to Other Financial Metrics
NPV doesn't operate in a silo. It’s most powerful when used alongside other key metrics to paint a complete financial picture.
For instance, understanding how the Internal Rate of Return (IRR) relates to NPV can give you a much more robust framework for your analysis. They often tell a similar story but from different angles.
Ultimately, getting a handle on NPV isn't just an academic exercise. It's a practical skill that helps you allocate capital wisely, pick the winning projects, and drive real business growth with confidence.
Getting Your Numbers Right: Cash Flows and the Discount Rate
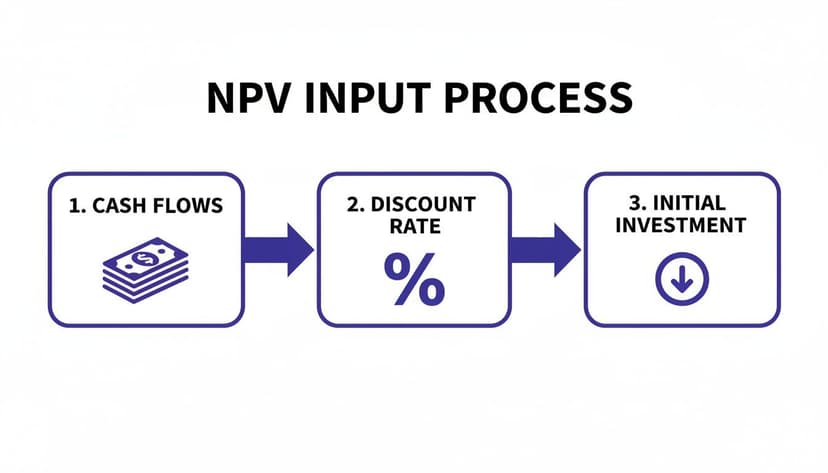
An NPV calculation is only as good as the numbers you feed it. The math itself is simple, but the real skill comes in forecasting the future cash flows and choosing the right discount rate. These two inputs are the foundation of your entire analysis. Get them wrong, and the result is meaningless.
Let's say a manufacturing company is looking at buying a new machine for $50,000. We need to figure out if this is a smart move financially. To do that, we have to map out the cash this machine will bring in and cost us over its lifespan.
Building a Cash Flow Forecast That Reflects Reality
Forecasting cash flow isn't about plucking numbers out of thin air. You need to build a detailed picture of all the extra cash that will flow in and out of the business because of this specific project.
Here’s what you need to nail down:
- Extra Revenue: Will the new machine boost production and sales? If you expect to sell an extra $20,000 worth of products each year, that's a cash inflow.
- Cost Savings: Maybe the machine is more efficient and will cut your annual operating costs—like labor or electricity—by $5,000. That saving acts just like a cash inflow.
- New Expenses: Don't forget the new costs. If maintenance is going to run you $2,000 a year, that’s a cash outflow you have to factor in.
- Salvage Value: What's the machine worth at the end of its useful life? If you think you can sell it in five years for $5,000, that future inflow is part of the calculation.
Just as important is knowing what not to include. The classic mistake is throwing in sunk costs—money you've already spent and can't get back. For instance, if you paid a consultant $3,000 last year to research this machine, that money is gone. It has no place in your NPV calculation for a decision you're making today.
A solid forecast focuses only on how the future will change with the project versus without it. That's the only comparison that matters.
If you want to get better at projecting these numbers, sharpening your knowledge of different business forecasting methods is a great next step.
What’s the Right Discount Rate?
The other critical piece of the puzzle is the discount rate. This is the rate you use to translate future dollars into today's dollars. Think of it as your project's minimum acceptable return. If the investment can't generate a return higher than this rate, your money would be better off somewhere else.
So, where does this number come from?
A company's Weighted Average Cost of Capital (WACC) is almost always the starting point. The WACC is essentially the average return a company needs to earn to satisfy all its investors, both shareholders and lenders. It’s a fantastic baseline because it reflects the company’s overall risk and how it’s financed.
Adjusting for a Project’s Unique Risk
But you can’t just stop at WACC. Not every project has the same risk profile as the entire company. A seasoned analyst will always tweak the discount rate to match the specific risks of the investment at hand.
Think about it this way:
- Low-Risk Project: Swapping out an old machine for a new, more efficient one is pretty straightforward. The cost savings are predictable. Here, using the company's WACC as your discount rate is perfectly fine.
- High-Risk Project: Now imagine you’re launching a totally new product in a market you've never entered. That’s a whole different level of uncertainty. To account for that risk, you need to demand a higher return. You’d use a higher discount rate—maybe WACC plus a 5% risk premium—to ensure the potential payoff is worth the gamble.
By tailoring the discount rate, you make your NPV analysis a much more accurate judge of an investment's true potential, accounting for both the time value of money and the real-world risk involved.
How to Calculate Net Present Value in Excel
Alright, let's move from theory to the real world and get our hands dirty in a spreadsheet. This is where you can truly see the power of NPV. I'll walk you through building a Net Present Value model right in Excel, covering three different methods to get the job done right. Each one gives you a slightly different perspective, from a granular, build-it-yourself approach to using Excel’s powerful built-in functions.
First, we'll actually construct the NPV calculation manually, cell by cell. I find this is the best way to really understand what's happening under the hood with discounting and the time value of money. After that, we’ll speed things up with Excel’s dedicated =NPV() function. It's fast, but it has one major quirk involving the initial investment that trips a lot of people up—I'll show you exactly how to sidestep it.
Finally, we'll look at the more powerful and flexible =XNPV() function. This is my go-to for real-world projects where cash flows don't arrive on a perfect, clean annual schedule.
Method 1: The Manual Calculation
Building your NPV model from the ground up is the single best way to see how each future cash flow gets discounted back to today's dollars. It’s completely transparent and a crucial step to master before you start leaning on the automated functions.
Let's work with a tangible example. Imagine a project that needs a $100,000 upfront investment. Over the next five years, you forecast the following net cash flows: $25,000, $30,000, $35,000, $40,000, and $45,000. For this project, the company's discount rate is 10%.
Here’s how you’d set this up in Excel:
- Column A: List the periods (0 for the initial investment, then 1, 2, 3, 4, 5).
- Column B: Plug in your cash flows. Remember, the initial investment is a negative number, so -100,000 goes in the cell for Period 0.
- Column C: This is where we'll calculate the Present Value for each cash flow.
The formula to find the present value of any single cash flow is: PV = Cash Flow / (1 + Discount Rate) ^ Period.
So, in your spreadsheet, the Excel formula for the Year 1 cash flow (let's say it's in cell B3, with the discount rate in E1) would be =B3/(1+$E$1)^A3. The dollar signs on $E$1 lock that cell reference, so you can just drag the formula down for all the future cash flows.
What about the initial investment? Since it happens at Period 0, it's already in present value terms. Its PV is simply -$100,000. To get the final NPV, you just sum up everything in Column C—the discounted future cash flows and that initial negative outlay.
Method 2: Using Excel's NPV Function
Once you're comfortable with the manual build, you can save a ton of time with Excel’s built-in =NPV() function. But here's a word of caution: its name is a little misleading, and it’s a classic mistake I see all the time. The function is designed to calculate the present value of a stream of future cash flows, starting from Period 1.
Critical Tip: The Excel
=NPV()function does not include the initial investment at Period 0. You have to subtract that initial outlay separately.
The syntax itself is simple: =NPV(rate, value1, [value2], ...)
rate: This is your discount rate. In our example,10%or the cell containing it.value1, [value2], ...: This is the range of your cash flows, but it must start with the cash flow from the end of the first period.
Using our same example, if the cash flows from Year 1 to Year 5 are in cells B3:B7 and the initial investment of -$100,000 is in cell B2, the correct formula would be:=NPV(10%, B3:B7) + B2
This formula first calculates the present value of all future cash flows and then adds the initial investment (which is already a negative number) to arrive at the correct Net Present Value.
This just goes to show that solid forecasting and a thoughtful discount rate are the bedrock of any meaningful NPV analysis.
Method 3: The XNPV Function for Irregular Timelines
The real world is messy. Cash rarely flows in and out on perfect annual anniversaries. A customer might pay on the 15th of the month, and a major expense might hit on the 3rd. This is where the =XNPV() function is a lifesaver. It’s specifically designed to calculate NPV for a series of cash flows that don't fall into neat, periodic buckets. As some 2011 research on capital budgeting techniques highlighted, precision in discounting matters, and XNPV delivers that.
The syntax is a bit different: =XNPV(rate, values, dates)
rate: Your discount rate.values: The series of cash flows, and this time, you do include the initial investment in the range.dates: A corresponding range of the exact dates for each cash flow.
Unlike the standard =NPV() function, =XNPV() is smart enough to handle the initial investment correctly, as long as you provide its date. This makes it far more robust and, frankly, a more accurate tool for most real-world financial modeling. If you want to get really good at handling non-periodic cash flows, this deep dive on using the XNPV function in Excel is a great resource.
By mastering all three of these methods, you'll have the flexibility to calculate NPV accurately for any kind of project, no matter how complex or unpredictable its timeline might be.
Let AI Handle Your NPV Analysis in Excel
Let’s be honest—building NPV models from scratch, hunting down formula errors, and creating charts takes a lot of time. It's important work, but every minute you spend wrestling with Excel's mechanics is a minute you're not spending on what really matters: interpreting the numbers and making smart decisions.
What if you had an expert analyst right inside your spreadsheet, ready to do the heavy lifting for you?
This is exactly where AI tools like Elyx.AI are changing the game for financial analysis. They turn the tedious, manual process of calculating Net Present Value into a simple conversation. Instead of memorizing the quirks of =NPV() or =XNPV(), you just use plain English to get the job done right.
From Formulas to Conversation
Think about how we usually do this. You have to lay out your columns, plug in the cash flows, recall the exact formula syntax, and then manually correct for common issues, like how =NPV() doesn't actually include the initial investment in its calculation. It's a multi-step process with plenty of room for error.
With an AI agent, you just describe what you want.
This is a huge shift. It lets you stay focused on the "what" and "why" behind your analysis, leaving the "how" to the AI. For anyone who spends hours building financial models, this simple change can free up a huge chunk of their day.
For example, rather than typing out =NPV(C2, D5:H5) + D4, you could just ask:
"Calculate the NPV in cell C7 for the cash flows in C5:H5 with a 9% discount rate, using the initial investment in C4."
That single, natural-language prompt handles a task that would otherwise require several careful clicks and keystrokes. It’s not just faster—it’s a great way to reduce the risk of a simple typo throwing off your entire model.
Get Instant Analysis and Visualizations
Beyond just one-off calculations, AI in Excel can seriously speed up the deeper analysis. After you get your base-case NPV, the next logical step is always a sensitivity analysis. How does the result change if the discount rate goes up or sales growth slows down? This usually means building data tables and charts to see the impact.
An AI agent makes this as easy as the first calculation. You can ask for sophisticated analysis in a single command.
Here are a few prompts you could give Elyx.AI to see how it works:
- For a quick calculation: "What is the Net Present Value for the cash flows in column D, using a discount rate of 8%?"
- For sensitivity analysis: "Generate a chart showing how the NPV changes if the discount rate varies from 5% to 15% in 1% increments."
- For comparing scenarios: "Create a pivot table comparing the NPV of Project A (Columns B-C) and Project B (Columns E-F)."
The AI reads your data, understands the request, builds the necessary tables, and gives you a professional-looking chart in seconds. It closes the gap between having a question and seeing the answer, letting you explore far more possibilities in less time. If you want to see more on how this works, our guide on using an AI Excel formula generator breaks down the technology.
Focus on What Really Matters
The biggest win here isn't just about saving time; it's about freeing up your brainpower. When you’re not bogged down in spreadsheet mechanics, you can focus on the high-level strategic thinking that AI can't do for you.
This means you have more time for:
- Questioning Assumptions: Is that sales forecast a little too rosy? Did we choose the right discount rate for this project's risk profile?
- Interpreting Results: What does a barely positive NPV actually tell us about this investment? What other, non-financial factors should we be thinking about?
- Communicating Insights: How can I present these findings to leadership in a way that leads to a clear, confident decision?
Ultimately, AI acts as your dedicated Excel co-pilot, handling the repetitive tasks with speed and accuracy. The future of financial modeling in Excel will lean heavily on tools like this, a trend explored in this great article about Microsoft Copilot, the ultimate guide to AI-powered assistant. By adopting these tools, you can shift your role from number-cruncher to strategic advisor, focusing entirely on making the best data-driven decisions to move the business forward.
Avoiding Common NPV Mistakes and Pitfalls

Knowing the NPV formula is one thing, but sidestepping the real-world traps that can throw off your analysis is another game entirely. I’ve seen even seasoned pros make simple errors that lead to bad investment calls. Getting the calculation right is just the entry ticket; avoiding these common pitfalls is where you truly create value.
One of the most common blunders happens right in Excel with the =NPV() function. Remember, that function is built to discount future cash flows, starting from period one. A critical mistake is wrapping the initial investment (your period-zero outflow) inside the formula. If you do that, you're accidentally discounting your startup cost, which artificially inflates the NPV and makes a project look better than it is.
Always remember: The initial investment is a time-zero event. It should be handled outside the
=NPV()function. The correct method is to calculate the NPV of future cash flows first, then add your initial outlay.
Stress-Testing Your Assumptions
A single NPV figure is static. It’s based on a perfect, predictable future that never actually happens. What if your sales forecast is a bit too rosy? Or what if a key supplier jacks up their prices? A solid analysis doesn't just stop at one number; it pushes the model to its limits to see how fragile that number is.
This is where sensitivity analysis comes in. By methodically tweaking your key variables—like the discount rate, sales growth, or operating costs—you can map out how much "wiggle room" you have before a winner turns into a loser. It gives you a much clearer sense of the project's real-world risk profile. For a detailed walkthrough, you can learn more about how to perform a comprehensive sensitivity analysis in Excel.
Think about it. If the NPV stays positive even after modeling a 15% drop in revenue, you can move forward with a lot more confidence.
When a Negative NPV Isn't the End of the Story
The textbook rule is simple: positive NPV means go, negative means stop. But in the real world, it’s rarely that black and white. A negative NPV doesn't always mean you should automatically kill the project. You have to consider the strategic or non-financial benefits that don't show up in a spreadsheet.
For instance, a project to overhaul your customer service platform might show a negative NPV on paper. But what if it dramatically improves customer retention and builds powerful brand loyalty? Those long-term, qualitative wins could easily outweigh the short-term financial loss. NPV is a powerful tool, but it should never be the only tool in your box.
Comparing NPV with Internal Rate of Return (IRR)
Another classic mistake is looking at NPV in a vacuum without its popular counterpart, the Internal Rate of Return (IRR). They are two sides of the same coin and give you different, equally valuable perspectives. While NPV gives you the absolute dollar value a project adds, IRR shows you the project’s effective percentage return.
Looking at both NPV and IRR helps you build a more complete financial narrative before making a decision.
NPV vs IRR A Practical Comparison
| Metric | What It Measures | Best For | Key Limitation |
|---|---|---|---|
| NPV | The total value added in today's dollars. | Comparing mutually exclusive projects of different sizes. | Doesn't show the efficiency of the return (the rate). |
| IRR | The project's breakeven discount rate (%). | Quickly assessing if a project exceeds a hurdle rate. | Can be misleading with unconventional cash flows. |
Using both metrics prevents blind spots. A project with a huge NPV but a tiny IRR might be a massive undertaking that isn't an efficient use of capital. On the flip side, a project with a sky-high IRR might be too small to meaningfully impact the company's bottom line. The smartest decisions come from weighing both the absolute value (NPV) and the efficiency of the return (IRR).
Common Questions When Calculating NPV
Once you've got the formulas down, you'll find that real-world projects bring up some tricky questions. Let's tackle a few of the most common ones that pop up when you move from theory to practice.
What Is a Good NPV?
Technically, any NPV greater than zero is a "good" one. A positive NPV means the project is expected to earn more than your required rate of return, so it's adding value to the business.
But the real answer depends on your situation. An NPV of $5,000 could be a huge win for a startup, but it might not even get noticed at a massive corporation looking for multi-million dollar opportunities. The goal isn't just to be in the black; it's about whether the projected value is big enough to be worth the effort and risk.
Can Net Present Value Be Negative?
Absolutely. A negative NPV is a clear signal that the project is expected to earn less than your required rate of return. In other words, the discounted value of the money you'll spend is greater than the discounted value of the money you'll get back.
Most of the time, a negative NPV is a deal-breaker. But there are exceptions. Sometimes a project with a small negative NPV is a strategic necessity—think of a mandatory compliance upgrade or a small investment that opens the door to a massive new market. It's a financial loss, but a strategic win.
Why Is the Initial Investment Excluded from Excel's NPV Function?
This is a classic Excel mistake that catches everyone at some point. The built-in =NPV() function is designed to work on a series of future cash flows. It assumes the first value in your range occurs one period from today.
Your initial investment, however, happens at Time 0. It's already a "present" value. If you include it inside the =NPV() formula, Excel incorrectly discounts it by one period, which will skew your result and make a bad project look better than it is.
The right way: Use
=NPV()only for your future cash flows (from Year 1 onward). Then, simply add your initial investment (as a negative number) to that result to get the true NPV.
How Do NPV and IRR Differ?
They're related, but they answer different questions.
- NPV gives you a hard number in dollars. It tells you exactly how much value a project is expected to create.
- IRR gives you a percentage. It tells you the exact discount rate where the project's NPV would hit zero.
NPV is generally the better tool for comparing different projects because it shows the total value each one brings to the table. IRR is fantastic for quickly checking if a single project's expected return clears your company's hurdle rate. To go deeper, check out our guide on the Internal Rate of Return (IRR) formula in Excel, which really breaks down how these two metrics work together.
Ready to stop wrestling with formulas and start getting instant insights? Elyx.AI is your autonomous analyst inside Excel. Describe what you need in plain English—from complex NPV calculations and sensitivity charts to full financial reports—and watch it get done in seconds. Start your free trial and save hours of manual work. https://getelyxai.com
Reading Excel tutorials to save time?
What if an AI did the work for you?
Describe what you need, Elyx executes it in Excel.
Sign up