7 Actionable Steps to Build Your DCF Excel Model

Building a Discounted Cash Flow (DCF) model in Excel is one of the most fundamental skills in finance. It's how we look past the daily noise of the market to figure out what a company is really worth based on the cash it's expected to generate in the future.
At its heart, the process is straightforward: we forecast a company's free cash flow, discount those future earnings to what they're worth today, and add it all up. Getting this right turns a spreadsheet from a simple grid of numbers into a powerful tool for making smart investment decisions, especially when you leverage AI within Excel to streamline the process.
1. Getting Started With Your First DCF Model in Excel
Think of a DCF model as a financial story. It requires a clear, logical approach to make sure the final valuation is not just a number, but a credible and defensible estimate of value. You have to build it systematically, almost like learning how to solve math problems step by step.
Spending too much time on Excel?
Elyx AI generates your formulas and automates your tasks in seconds.
Sign up →The core logic hasn't changed much since people started doing this. When Excel came along in 1985, it quickly became the standard for this kind of work. By 1990, a staggering 70% of Fortune 500 companies were using spreadsheet-based DCF models to evaluate mergers and acquisitions, a huge leap from less than 10% just a decade earlier in 1980.
The 3 Phases of the Core DCF Workflow
The whole process can be broken down into three main phases: setting everything up, forecasting the financials, and finally, calculating the valuation.
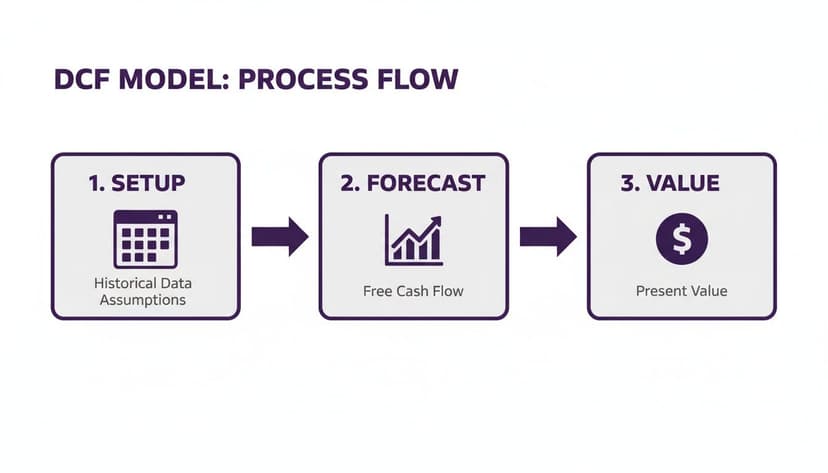
This workflow shows that a solid valuation is built on two things: a well-organized setup and a thoughtful forecast. Before you even think about plugging in formulas, you need to get your data and assumptions in order. If you're working with messy historical data, check out our guide on https://getelyxai.com/en/ai-data-cleaning to see how you can streamline this crucial first step.
A DCF model is only as good as its assumptions. The final valuation is a direct reflection of the quality of your inputs, which is why the initial setup and forecasting stages are the most critical parts of the entire exercise.
Tools like Elyx.AI are changing the game here. Instead of getting bogged down in manual data entry and wrestling with complex formulas, you can have an AI assistant handle the heavy lifting. This frees you up to focus on what really matters: the strategic thinking behind the numbers.
To give you a clearer picture of the road ahead, here's a breakdown of the entire model-building process.
The 7 Core Stages of Building a DCF Model in Excel
This table outlines the key milestones in constructing a robust DCF model from scratch.
| Stage Number | Stage Name | Objective and Key Activities |
|---|---|---|
| 1 | Setup and Assumptions | Gather historical financial data (Income Statement, Balance Sheet, Cash Flow Statement). Define key assumptions for growth rates, margins, and capital expenditures. |
| 2 | Revenue Forecast | Project future revenue based on historical trends, market analysis, and company-specific drivers. This is the top-line driver for the entire model. |
| 3 | Working Capital Schedule | Forecast changes in current assets (like inventory and accounts receivable) and current liabilities (like accounts payable). This helps determine cash tied up in operations. |
| 4 | Capital Expenditures & Depreciation | Project future investments in property, plant, and equipment (PP&E). Build a depreciation schedule based on existing and new assets. |
| 5 | Free Cash Flow Calculation | Integrate all schedules to calculate Unlevered Free Cash Flow (UFCF) for the explicit forecast period (typically 5-10 years). |
| 6 | WACC and Terminal Value | Calculate the Weighted Average Cost of Capital (WACC), which will be our discount rate. Estimate the company's value beyond the forecast period using a Terminal Value calculation. |
| 7 | Valuation and Analysis | Discount the projected cash flows and Terminal Value back to the present. Perform sensitivity and scenario analysis to test assumptions and understand the range of potential outcomes. |
Following these stages provides a structured path, ensuring you cover all the essential components for a comprehensive and defensible valuation.
2. A 5-Step Blueprint for Structuring Your Model and Projecting Revenue
Before you even think about writing a single formula, let's talk about structure. A solid DCF model is built on a clean, organized foundation. I’ve seen countless models become a tangled mess of formulas because they lacked a logical structure from the start, making them impossible to audit and even harder to trust. A well-organized workbook is your first and best defense against costly errors.

The trick is to think in modules, separating your model into dedicated tabs. This approach keeps your data pristine, your logic transparent, and makes it a breeze to update assumptions without accidentally breaking your calculations.
Your 5-Step Model Structure
Here’s a proven, scalable blueprint for organizing your workbook that I use in my own models:
- Assumptions Tab: Think of this as the control center for your entire model. All your key drivers—revenue growth rates, margins, tax rates, discount rates—live here. This setup is crucial for running sensitivity analysis later on.
- Historical Data Tab: Pull in at least three to five years of financial statements here. This historical data is the bedrock of your projections and helps you spot the underlying trends.
- Calculations/Schedules Tab: This is the engine room. It’s where you’ll build out all the supporting schedules for things like debt amortization, working capital changes, and depreciation. This keeps your main financial statements uncluttered and easy to follow.
- Financial Statements Tab: This tab brings it all together, housing your projected Income Statement, Balance Sheet, and Statement of Cash Flows. Every number here should be linked and flow logically from your assumptions and schedules.
- Valuation (DCF) Tab: This is the grand finale. This tab pulls the free cash flows you’ve calculated, applies the discount rate, and spits out the final enterprise and equity value.
A rookie mistake I see all the time is hard-coding assumptions directly into formulas. Don't do it. Always, always link back to your dedicated 'Assumptions' tab. This simple discipline makes your model dynamic and drastically cuts down the risk of errors when you're testing different scenarios.
2 Ways to Build Driver-Based Revenue Forecasts
With your structure in place, it’s time to tackle the most critical part: projecting revenue. Please, don't just slap a simple year-over-year growth percentage on it and call it a day. That adds very little insight. The professional approach is to build a driver-based forecast.
This method breaks revenue down into its core operational components. For a software company, that might be Number of Subscribers × Average Revenue Per User (ARPU). For a retailer, it could be Number of Stores × Sales per Square Foot. This gives your model a real-world connection.
Let’s say you’re valuing a subscription business. A driver-based forecast would involve projecting the number of new subscribers each year, churn rates, and the average subscription price. It's a far more defensible and insightful approach than just assuming a flat 10% annual growth rate out of thin air.
Using Excel and AI for Projections
Excel gives you some powerful tools for this right out of the box. The FORECAST.LINEAR function, for example, is great for creating a quick baseline from historical data.
Let's say you have five years of historical unit sales in cells B2:B6 that correspond to the years in A2:A6. You can project the sixth year's sales with a simple formula:
=FORECAST.LINEAR(A7, B2:B6, A2:A6)
A7is the future year you want to project for.B2:B6is the range of your historical sales data (the known y-values).A2:A6is the range of the corresponding historical years (the known x-values).
This formula uses linear regression to draw a straight line through your past performance and extend it into the future. It’s a solid starting point, but this is where an AI assistant like Elyx.AI can really speed things up.
You could just ask it to "import historical sales data and generate a 5-year baseline revenue projection using a linear forecast." The tool can handle these steps for you, giving you a solid foundation that you can then tweak with your own strategic assumptions and industry knowledge. Getting familiar with the different Excel use cases for AI can show you just how much of the grunt work you can automate.
3. Forecasting the Financials and Getting to Free Cash Flow
Once your revenue forecast is dialed in, it’s time to build the engine of your dcf excel model: the three financial statements. This is where the Income Statement, Balance Sheet, and Statement of Cash Flows get wired together. Everything needs to be dynamically linked, so a change in one place flows logically through the others. The ultimate gut-check? A balance sheet that actually balances. If it doesn't, you've got a "plug" somewhere, and your model's integrity is shot.
The whole point of this exercise is to project all the necessary line items to get to one crucial number: Unlevered Free Cash Flow (UFCF). Think of UFCF as the raw cash profit the business generates before any debt payments. It’s the cash available to everyone who has a claim on the company—both lenders and owners.
2 Steps to Projecting the Income Statement and Balance Sheet
Forecasting expenses like Cost of Goods Sold (COGS) and Selling, General & Administrative (SG&A) usually starts by looking backward. The simplest way is to calculate these as a percentage of revenue from past years and then apply that average to your future revenue numbers.
For example, if COGS has consistently been 45% of revenue, you can start there. But don't just set it and forget it. A smart model considers things like economies of scale. As the company grows, it might gain buying power, so you could realistically model that percentage ticking down slightly over the forecast period.
A rookie mistake is slapping a single, flat growth rate on every expense line. You need to connect expenses to their actual drivers. COGS is almost always tied to revenue, but SG&A might have a fixed component (like head office rent) and a variable one that grows with sales. This adds a layer of realism that separates a great model from an average one.
The same logic applies to the balance sheet. Items like Accounts Receivable (A/R) and Inventory can be projected using historical turnover days. You can calculate Days Sales Outstanding (DSO) from past data and use that assumption to forecast the A/R balance based on your new revenue projections.
The 5-Part Path to Unlevered Free Cash Flow
Calculating UFCF is the main event here. It’s the number we’re going to discount back to the present to find our valuation. The calculation always begins with EBIT (Earnings Before Interest and Taxes), which gives us a clean look at the company's core profitability.
Here’s the standard formula and a quick breakdown of what each piece means:
| Component | Description | Why It's Included |
|---|---|---|
| EBIT | Earnings Before Interest and Taxes | Your starting point, representing the company's operating profit. |
| – Taxes on EBIT | EBIT x (1 – Tax Rate) | We need to figure out the taxes the company would pay if it were debt-free (unlevered). |
| + Depreciation & Amortization (D&A) | Add back non-cash expenses. | D&A is just an accounting entry; it reduces taxable income, but no cash actually leaves the building. |
| – Capital Expenditures (CapEx) | Subtract investments in long-term assets. | This is a very real cash outflow needed to maintain and grow the business's asset base. |
| -/+ Change in Net Working Capital | Adjust for cash used or freed by operations. | If inventory goes up, that ties up cash. If customers pay you faster, that frees up cash. |
2 Common Forecasting Pitfalls to Avoid
Building these schedules is tricky, and a small mistake can snowball into a massive valuation error. One thing people often forget is stock-based compensation. Just like D&A, it's a non-cash expense that reduces reported profit, so it needs to be added back after you calculate the tax hit on EBIT.
Forecasting Capital Expenditures (CapEx) is another area where people get tripped up. Just projecting it as a simple percentage of revenue is lazy and often wrong. A much better approach is to split it in two:
- Maintenance CapEx: What the company must spend just to keep the lights on and maintain its current level of operations. This is often estimated as being roughly equal to the D&A expense.
- Growth CapEx: The extra investment needed to actually support the revenue growth you’ve forecasted.
This two-part method gives you a far more defensible and accurate picture of the company's future cash needs. If you find yourself wrestling with complicated formulas to model these relationships, an AI formula generator for Excel can be a lifesaver, helping you build the right logic without getting tangled up in a mess of nested functions. Nailing your cash flow projections is the single most important part of building a reliable dcf excel model.
4. Nailing the Discount Rate and Terminal Value: 4 Key Calculations
Once you've projected the future free cash flows, you hit the most subjective—and frankly, most argued-over—parts of any dcf excel model: the discount rate and the terminal value. A tiny adjustment here can send your final valuation swinging wildly. This is where you translate your story about future growth into a concrete number in today's dollars.

Let's break down these crucial calculations into four distinct parts, starting with the rate we'll use to discount all those future cash flows back to the present.
1. Find the Cost of Equity Using CAPM
The discount rate we're after is the Weighted Average Cost of Capital (WACC). This is simply the blended cost of a company's financing from both its shareholders (equity) and its lenders (debt).
First up is the cost of equity, which is the return shareholders demand for the risk they're taking. The classic way to figure this out is with the Capital Asset Pricing Model (CAPM).
The CAPM formula looks like this:
Cost of Equity (Re) = Risk-Free Rate + Beta × (Expected Market Return – Risk-Free Rate)
Here's what each piece means in practice:
- Risk-Free Rate: This is your baseline, a theoretically "zero-risk" investment. Most analysts use the yield on a long-term government bond, like the 10-year U.S. Treasury note.
- Beta: This measures how much a stock's price swings compared to the market as a whole. A beta of 1 means it moves in lockstep with the market; over 1 means it's more volatile. You can pull beta figures from financial data providers like Yahoo Finance or a Bloomberg Terminal.
- Expected Market Return: This is an estimate of the stock market's long-term average return, often assumed to be in the 8-10% range.
2. Calculate the After-Tax Cost of Debt
Figuring out the cost of debt is usually more straightforward. It’s simply the interest rate the company pays on its loans and bonds. But there's a key twist: interest payments are tax-deductible. This "tax shield" lowers the actual cost of debt to the company.
The formula is simple:
After-Tax Cost of Debt (Rd) = Pre-Tax Cost of Debt × (1 – Corporate Tax Rate)
So, if a company borrows money at an average interest rate of 5% and faces a corporate tax rate of 21%, its true, after-tax cost of debt is only 3.95% (which is 5% × (1 – 0.21)).
With the cost of equity and after-tax cost of debt in hand, you can finally calculate the WACC. You'll weight each component based on the company's capital structure—the mix of equity and debt it uses to fund its operations. This WACC is the magic number you'll use to discount your projected cash flows.
3. Choose Your Terminal Value Method
A DCF model doesn't forecast cash flows into infinity. We typically project out for a 5 to 10-year period and then estimate a Terminal Value to capture the value of all cash flows beyond that point.
You have two main tools for this:
- Gordon Growth Model (Perpetuity Growth Method): This approach assumes the company’s cash flows will grow at a slow, steady rate forever. It’s a great fit for mature, stable companies in predictable industries.
- Exit Multiple Method: This method pretends you're selling the business at the end of the forecast period. You value it by applying a market multiple (like an EV/EBITDA multiple) to its final year's earnings, just like you would in a real M&A deal. This often works better for high-growth or cyclical businesses where predicting long-term stability is a shot in the dark.
4. Build the Terminal Value Calculation in Excel
Now, let's put this into Excel. Your choice of method here is a major fork in the road for your valuation, so it's vital to get the mechanics right.
The Gordon Growth Model formula is:= (Final Year FCF * (1 + g)) / (WACC - g)
- Final Year FCF: This is the unlevered free cash flow from the last year of your explicit forecast.
- g: The perpetual growth rate. Be conservative here; it shouldn't be higher than the long-term GDP growth rate of the economy (think 2-3%).
- WACC: Your freshly calculated Weighted Average Cost of Capital.
For the Exit Multiple Method, the formula is:= Final Year EBITDA * Exit Multiple
- Final Year EBITDA: The company's Earnings Before Interest, Taxes, Depreciation, and Amortization in the final forecast year.
- Exit Multiple: An appropriate EV/EBITDA multiple you've researched from comparable public companies or recent acquisitions in the same industry.
The right method really depends on the company you're analyzing. Here’s a quick guide to help you choose.
2 Terminal Value Methods Compared
| Method | Formula | Key Assumptions | Best Used For |
|---|---|---|---|
| Gordon Growth Model | (FCFn * (1 + g)) / (WACC - g) |
The company achieves a stable, constant growth rate into perpetuity. | Mature, stable industries like utilities or consumer staples. |
| Exit Multiple Method | EBITDAn * Exit Multiple |
The company's value at the end of the forecast period will align with current market multiples. | High-growth, cyclical, or tech companies where long-term stability is hard to predict. |
Ultimately, both methods are heavily dependent on your assumptions. But mastering their application is fundamental to building a credible dcf excel model. If you want to get more comfortable with these and other functions, our guide on essential Excel formulas for financial modeling is a great place to start.
5. Pulling It All Together: 3 Steps to the Final Valuation and Analysis
You've done the heavy lifting—building out your forecasts and nailing down a discount rate. Now comes the payoff. This is where all those carefully crafted assumptions converge into a clear valuation, translating future potential into a concrete, present-day value for the company.
The entire process boils down to one core concept: bringing all future cash flows back to today's dollars. That means taking your projected Unlevered Free Cash Flows (UFCF) and the Terminal Value and discounting them using your Weighted Average Cost of Capital (WACC). This is where Excel's Net Present Value function really shines.
1. Nailing the NPV Formula for Enterprise Value
Excel’s =NPV function is a workhorse for any analyst, but it’s notoriously easy to misuse. I've seen it countless times: a junior analyst includes the first year's cash flow inside the NPV calculation. This is a classic mistake that over-discounts your cash flows by an extra period.
Here’s the right way to do it. The =NPV function should only be used for the cash flows in your future forecast period. The cash flow from the current period (Year 0) is already in today's dollars, so you leave it out of the formula.
Imagine your WACC is sitting in cell B1 and your projected cash flows for Years 1 through 5 are in the range C10:G10. Your formula would look like this:
=NPV(B1, C10:G10)
B1is your discount rate (WACC).C10:G10is the range holding your series of future cash flows.
But that’s only half the story. This formula just gives you the present value of the cash flows from your explicit forecast. You still have to account for the Terminal Value. If you calculated your Terminal Value at the end of Year 5 (let's say it's in cell G11), you need to discount it back five full periods.
The formula for that is: =G11 / (1 + B1)^5
Your Enterprise Value is simply the sum of these two pieces: the present value of your forecasted cash flows and the present value of your terminal value. It’s the total value of the company's core business operations. When you're in the thick of a corporate deal, remember that value isn't just about the numbers; operational details like IT considerations in Mergers & Acquisitions can have a massive, tangible impact.
2. Getting from Enterprise Value to a Price Per Share
So, you have the Enterprise Value. What does that mean for an individual shareholder? To figure that out, you need to build a bridge to Equity Value.
It's a pretty straightforward path:
- Start with your calculated Enterprise Value.
- Add any Cash & Cash Equivalents on the balance sheet.
- Subtract all forms of Debt (short-term and long-term).
- Subtract other non-equity claims like Minority Interest or Preferred Stock.
What's left is the company's Equity Value. The final step is to divide this number by the total diluted shares outstanding to get your implied price per share.
A single valuation number is a precise-looking answer to an imprecise question. A great analyst knows that the real insight comes from testing the assumptions that produced that number. A DCF model is a tool for thought, not just a calculator.
3. Stress-Testing Your Model: The 3 Essential Analyses
A single share price is an output, not the answer. The real magic of a DCF is understanding which levers move the valuation the most. This is what separates a truly professional model from a simple academic exercise.
Here are the three analyses you absolutely must run to pressure-test your assumptions.
- Sensitivity Analysis: How does your valuation wiggle when two key variables change at the same time? The classic pairing is testing your WACC against your Terminal Growth Rate (or an Exit Multiple). Excel’s Data Table feature (under the Data tab > What-If Analysis) is built for this. It creates a simple matrix showing the implied share price across a whole range of WACC and growth rate combinations. It gives you a fantastic feel for your model's sensitivity.
- Scenario Analysis: This is about storytelling with numbers. Instead of tweaking one or two variables, you build out complete, internally consistent narratives. You'll want a "Base Case" (your best guess), an "Upside Case" (everything goes right), and a "Downside Case" (a more pessimistic view). This shows a realistic range of outcomes based on different potential futures for the company.
- Football Field Chart: This is your grand summary. A football field chart is a powerful visual that plots the valuation ranges from your different DCF scenarios on a single graph. You can (and should) also layer in valuation ranges from other methods, like comparable company analysis or recent transactions. It gives you and anyone you're presenting to a bird's-eye view of what the company might be worth from multiple angles.
Building these analyses, especially the charts and tables, can be a real grind. This is where an AI tool like Elyx.AI can be a game-changer. Instead of fiddling with data tables and chart formatting, you could just prompt: "Create a sensitivity table for WACC and Terminal Growth Rate, then visualize my scenarios in a football field chart." It can turn an hour of manual Excel work into a quick command.
6. The 6 Most Common Pitfalls to Avoid in Your DCF Model
You can build the most elegant dcf excel model on the planet, but it's worthless if you fall into a few all-too-common traps. I've seen it happen countless times—a single flawed assumption sends the entire valuation spiraling into fantasy land. Think of your analysis as a house of cards; one wrong move and the whole thing comes tumbling down.
Knowing what these pitfalls are is half the battle.

One of the biggest red flags I see is wildly optimistic growth projections. It's tempting to plug in double-digit growth for a decade, but is it realistic? If your assumptions aren't rooted in solid market analysis and the company's actual track record, you’re just setting yourself up for an inflated, indefensible number.
Another classic mistake happens in the terminal value calculation. If you set your terminal growth rate higher than your discount rate, the math breaks down. It implies the company will one day be bigger than the global economy—a clear impossibility. A safe, conservative terminal growth rate usually hangs around long-term GDP growth, somewhere in the 2-3% range.
3 Key Traps That Compromise Your Model
Here are a few other frequent offenders I’ve run into that can completely derail your valuation work:
- One-Size-Fits-All WACC: Grabbing a generic Weighted Average Cost of Capital is a huge no-no. Your WACC needs to be tailored to the specific company, reflecting its unique risks based on size, industry volatility, and debt levels.
- Sloppy Working Capital Forecasts: Simply projecting net working capital as a flat percentage of revenue can throw your free cash flow way off. You need to dig deeper into the actual drivers, like how long it takes to sell inventory or collect from customers.
- The Dreaded Circular Reference: This is a rite of passage for any modeler. When you have a debt schedule, interest expense depends on the debt balance, but the debt balance depends on the cash flow, which is affected by interest expense. It's a loop that can easily break your model if not managed carefully.
A DCF valuation is as much an art as it is a science. Your final number is incredibly sensitive to the inputs. Skipping a rigorous sensitivity analysis isn't just taking a shortcut; it's a fundamental failure to grasp the model's limitations and risk profile.
Building solid models means staying vigilant. It helps to be familiar with the most common Excel errors that can trip you up and, more importantly, how to squash them quickly when they pop up.
7. 2 Common Questions (and Answers) About DCF Models
Even after you've built a few DCF models, certain tricky questions always seem to pop up. Here are a couple of the most common ones I hear, along with some practical advice to keep your analysis on track.
1. What's a Reasonable Terminal Growth Rate?
Choosing the terminal growth rate is one of those areas that feels more like an art than a science, but there's a guiding principle that will keep you out of trouble: be conservative. Remember, this number is your estimate for how fast the company's free cash flow will grow forever.
A safe and highly defensible bet is to peg it to the long-term inflation rate or the expected long-term GDP growth rate for the country where the company primarily operates. This usually lands you somewhere in the 2% to 3% range.
If you push it much higher than that, you're essentially saying the company will eventually become bigger than the entire economy. That's not just unlikely; it's impossible. It's a huge red flag that will get your model immediately questioned.
2. Why Won't My Balance Sheet Balance?
Ah, the classic headache. An unbalanced balance sheet is almost always a sign that something is broken in your dcf excel model. It's the model's way of telling you to double-check your work. In my experience, the error usually hides in how the three financial statements are linked together.
The first place to look is almost always the Retained Earnings calculation. Make sure your closing Retained Earnings on the Balance Sheet is correctly calculated: Opening Balance + Net Income (from the Income Statement) – Dividends (from the Cash Flow Statement). A simple copy-paste error here can throw the whole thing off.
Another common culprit is a circular reference error involving debt and interest. Your interest expense (which hits Net Income) depends on your debt balance, but the cash flow available to pay down that debt is affected by your Net Income. It's a loop that's easy to get wrong. Carefully trace the formulas from your debt schedule to your income statement and back to your cash flow statement.
Building a solid DCF model demands a sharp eye for detail, from the first assumption to the final valuation. Instead of getting bogged down in formula auditing and formatting, imagine having an expert assistant right inside Excel. That's where Elyx AI comes in. Just describe what you need in plain English, and our autonomous agent can handle the entire workflow, from forecasting schedules to setting up sensitivity tables.
Start your free 7-day trial and build better models faster with Elyx AI.
Reading Excel tutorials to save time?
What if an AI did the work for you?
Describe what you need, Elyx executes it in Excel.
Sign up